Artigo
| Intraspecific variability of Holostylis reniformis: concentration of lignans, as determined by maceration and supercritical fluid extraction (SFE-CO2), as a function of plant provenance and plant parts |
|
Gislaine F. MartinsI; Marcos D. P. PereiraI; Lucia M. X. Lopes*,I; Tito da SilvaII; Paulo de T. Vieira e RosaIII; Fernanda P. BarbosaIII; Gisele B. MessianoIV; Antoniana U. KrettliV
IInstituto de Química, Universidade Estadual Paulista, 14801-970 Araraquara - SP, Brasil Recebido em 03/07/2013 *e-mail: lopesxl@iq.unesp.br Maceration and supercritical fluid extraction were used to prepare extracts from parts of plants (Holostylis reniformis) collected in two different regions of Brazil. 1H NMR, HPLC-DAD-ESI/MS, HPLC-DAD, GC-MS, and chemometric techniques were used to analyse lignans in the extracts and showed that yields of SFE-CO2 were less than or equal to those of hexane maceration extracts. These analyses, in conjunction with the concentrations of aliphatic hydrocarbons, fatty acids and their methyl and ethyl derivatives in the extracts, also allowed the chemical composition of parts and provenance of the plant to be differentiated. INTRODUCTION Holostylis reniformis Duch. (Aristolochiaceae) is widely distributed in Brazil and has been used in traditional Brazilian medicine as an antirheumatic, stomachic, and depurative.1 Extracts from this species have been shown to exhibit antimalarial activity and to contain high concentrations of 8-8' linked lignans without 9,9'-oxygenation that showed antiplasmodial activity.2 Moreover, biosynthetic studies have shown that isoeugenol is a biosynthetic intermediate for these 2,7' lignans (aryltetralone lignans) and 7,7' epoxylignans (furan lignans).3,4 Our previous studies on H. reniformis determined that reverse-phase HPLC-DAD4-6 provided the most suitable conditions for obtaining chromatographic profiles of non-polar extracts from the roots (hexane, chloroform, and acetone), which contained aryltetralone lignans and 7,7' epoxylignans. Under these conditions, at least 10 different lignans were well characterized. To achieve the goal of obtaining clean extracts rich in lignans from this species, supercritical fluid extraction (SFE) was used, since SFE is known to be a rapid, selective and a convenient method for sample preparation prior to the analysis of compounds in natural product matrices.7 The most used supercritical solvent is pure or modified CO2 because of its critical parameters, especially the critical temperature which allows extraction at mild temperatures, decreasing the tendency to degrade thermal sensitive compounds. Moreover, supercritical fluid extraction with carbon dioxide (SFE-CO2) has been used to extract components that present low to medium polarity from solid and liquid pharmaceutical matrices due to its safety as an alternative to the conventional liquid extraction of lignans, such as those of Schisandra chinensis, Schisandra sphenanthera, and Forsythia koreana. In addition, the on-line coupling of SFE with supercritical fluid chromatography (SFC) was previously used for the extraction and separation of neolignans such as magnolol and honokiol in Magnoliae cortex.8 To contribute to advances in pharmacological tests of these extracts and lignans, which are needed in substantial amounts, this report describes a comparative study on two methods for obtaining extracts rich in aryltetralone lignans from H. reniformis, and compares the intraspecific chemical variability of this species collected in two different regions of Brazil (Minas Gerais State (MG) and Maranhao State (MA)).
RESULTS AND DISCUSSION Extractions Extracts of dried roots, leaves, and stems from plants collected in Imperatriz (MA) and Ituiutaba (MG) were prepared by supercritical fluid extraction (SFE-CO2) and by a classical method using maceration (extraction with hexane, acetone, and ethanol, successively) at room temperature. With these two methods, extraction and concentration were completed within 120 min and 8 days, respectively. Opletal et al. and Lojková et al.9 observed that the conditions for supercritical fluid extraction at pressures above 20 MPa and temperatures of 40-80 ºC had little effect on the SFE lignan yields. However, the matrix type, including the part of the plant, greatly influenced the composition of lignans in extracts obtained by SFE.7,10 Thus, the experimental conditions established for SFE-CO2 from roots, stems, and leaves (20.0 g each) of H. reniformis were CO2 at 50 ºC, 27 MPa, and 50 min. Since the amount of raw material was limited and different from that used by the previous SFE studies available in the literature,11,12 the extractions were conducted at high pressure, relatively high temperature and a high CO2 flow rate in order to achieve the largest extraction yield in the shortest time. The extracts obtained were then examined with regard to extraction yield (Table 1) and composition. The yields of SFE-CO2 (E-7 to E-12) were less than or equal to those of the hexane maceration extracts (E-1 to E-6) and their chemical composition similar, as evidenced by the following analyses.
Qualitative and semi-quantitative analyses of aryltetralone lignans Qualitative and semi-quantitative analyses of aryltetralone lignans in the root and stem extracts were performed by using 1H NMR, HPLC-DAD-ESI/MS, HPLC-DAD, HPLC-DAD-CD, and GC-MS techniques. To optimize the experimental conditions (HPLC, ESI-MS, and GC parameters) and quantification, (-)-8'-epi-aristoligone (1) and (-)-aristotetralone (2), previously isolated from H. reniformis, were used as standard references (Figure 1).
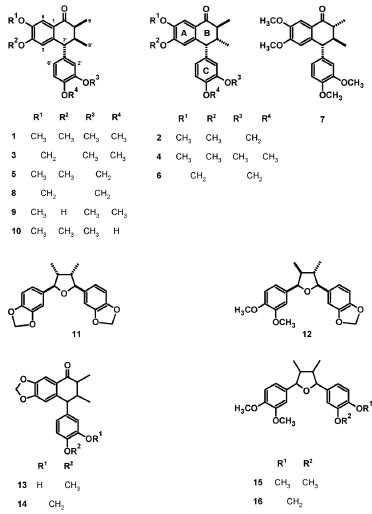 Figure 1. Chemical structures of compounds 1-16
1H NMR analysis 1H NMR spectra of aryltetralone lignans from H. reniformis are very characteristic. They showed hydrogen signals at δ 0.6-1.2 (CH3), 3.6-3.9 (OCH3), 2.0-2.8 (CH), 5.8-6.0 (CH2O2), 6.3-7.0 (Ar-H), and ~7.5 (H-6). As an example, Figure 1S (supplementary material) shows the typical spectra of extracts containing lignan 1 at a high concentration. None of the characteristic signals corresponding to lignan hydrogens were observed in the 1H NMR spectra of extracts from the plant leaves, or in the ethanol extracts from the roots. HPLC analysis Based on an analysis of non-polar extracts (SFE-CO2, hexane, and acetone) under the optimal conditions previously determined for extracts from the roots of H. reniformis,4,6 11 different lignans were well-characterized by comparing their retention times, CD, UV absorptions, and mass spectra: (-)-8'-epi-aristoligone (1), (-)-aristotetralone (2), (-)-4'-O-methylenshicine (3), (-)-aristoligone (4), (-)-8'-epi-aristotetralone (5), cagayanone A (6),8,8'-epi-aristoligone (7), cagayanone B (8), (-)-8-epi-holostylone (9), (-)-holostyligone (10), and calopiptin (12). In addition, basic structures were suggested for two aryltetralone (13 and 14) and two furan lignans (15 and 16) on the basis of their mass spectra (Table 1S, Figures 1 and 2S). The mass spectra of aryltetralone lignans showed characteristic ions corresponding to the molecular ions and protonated molecular ions seen with EI and ESI, respectively. Key ions, which may have arisen from retro Diels-Alder rearrangements involving the A and B rings and naphthol formation, were observed by GC-MS and HPLC-DAD-ESI/MS, respectively (for further details, see supplementary material, Table 1S, Figures 2S and 3S).
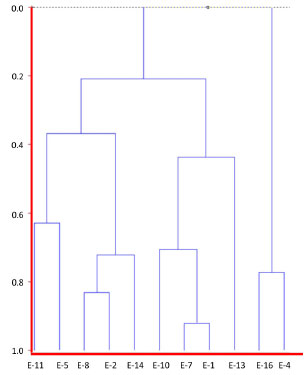 Figure 2. Dendrogram constructed based on an agglomerative hierarchical clustering analysis (HCA) of hexane solutions of extracts of H. reniformis with different provenances by GC-MS (for extract numbering, see Table 1)
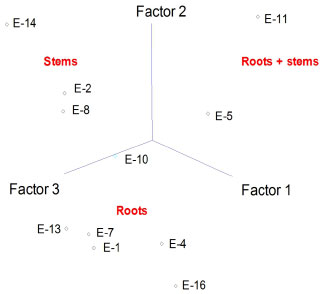 Figure 3. Principal component analysis (PCA) of chemical constituents of hexane solutions of extracts from stems and roots of H. reniformis by GC-MS. The principal components (PC1 and PC2) account for ca. 73.6% of the information (for extract numbering, see Table 1)
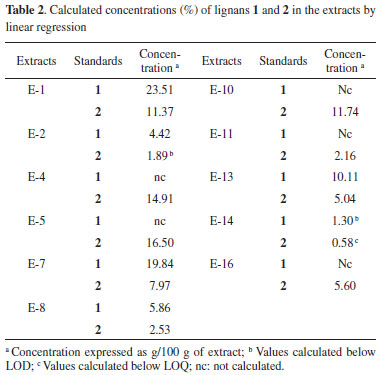
Relative and semi-quantitative analyses by HPLC A relative quantitative analysis by HPLC-DAD-ESI/MS was also performed to compare the compositions of the root and stem extracts. The peak areas of compounds that showed retention times (tR) between 6.1 and 33.3 min in the chromatograms were transformed into percentages. This analysis (Table 1S) showed that acetone and ethanol extracts of stems+roots from MA contain a significant amount of 3, and most of the samples from MA contain higher concentrations of 2 than 1. As seen in Table 1S, plant provenance can be clearly seen by this analysis. A semi-quantitative analysis (HPLC-DAD) was performed by the external standard method for extracts that showed well-resolved peaks with the same retention times as 1 and/or 2 (Figure 4S). Higher concentration of 1 was also determined in the extracts from MG and of 2 in those from MA (Table 2).
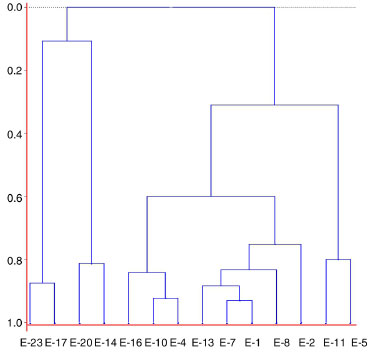 Figure 4. Dendrogram constructed based on an agglomerative hierarchical clustering analysis (HCA) of extracts of H. reniformis of different provenances by HPLC-DAD-ESI/MS and HPLC-DAD (for extract numbering, see Table 1)
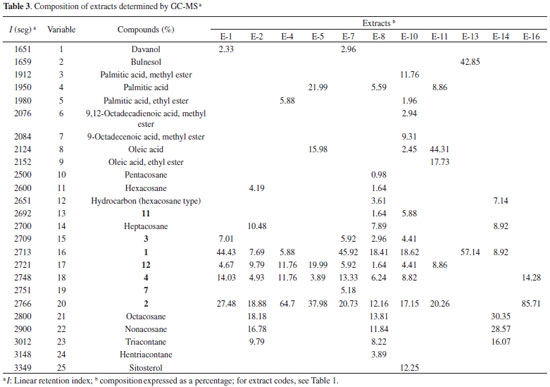
GC-MS analysis The composition of the crude extracts was also established using GC-MS analyses by comparing the linear retention index (I) of the compounds with those of standard samples and with data in the literature, as well as by analysing their mass spectra, where seven lignans were characterized (1-4, 7, 11, and 12, Table 3). In addition to ethyl oleate, ethyl palmitate, methyl esters of 9-ocatadecenoic and 9,12-ocatadecadienoic acids, seven aliphatic hydrocarbons (pentacosane, hexacosane, heptacosane, octacosane, nonacosane, triacontane, and hentriacontane), two fatty acids (palmitic and oleic acids) and their methyl esters were also identified by co-injection of authentic samples from Aldrichr (Table 3). As observed by 1H NMR and HPLC analyses, the extracts of leaves showed a significant concentration of aliphatic esters and hydrocarbons, but not of lignans (data not shown).
Statistical analyses An agglomerative hierarchical cluster analysis (HCA) and principal component analysis (PCA) were individually applied to datasets of normalized chromatograms obtained by GC-MS of the soluble hexane solutions of extracts. These analyses allowed the drawing of similarity plots of the corresponding extracts to the principal components to obtain information about the characteristic peaks, which are the most discriminating for the samples observed on the plots (Figures 2, 3, and 5S). In addition, HCA (Figure 2) showed three distinct groups, two of which were only from roots and a group that contained stems. Moreover, the PCA results were consistent with these three groups and allowed stem extracts to be differentiated from stems+roots extracts (Figure 3, Table 2S). Positive score signals for PC1 corresponded to those extracts of stems and roots from MA, which were highly influenced by octacosane (variable 21), whereas negative values were influenced by 12 (variable 17) (Figure 5S). In addition, the hydrocarbons nonacosane, triacontane, and hentriacontane (variables 22-24) characterized extracts of stems from MG while ethyl oleate (variable 9) characterized SFE-CO2 extract of stems+roots from MA (E-11). This ester and methyl fatty esters were previously isolated from Aristolochia grandiflora and Aristolochia longa.13
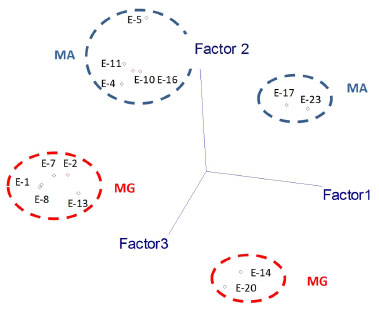 Figure 5. Principal component analysis (PCA) of chemical constituents of extracts from stems and roots of H. reniformis by HPLC-DAD-ESI/MS and HPLC-DAD. The principal components (PC1 and PC2) account for ca. 79.0% of the information (for extract numbering, see Table 1)
Thus, the chemical compositions of the different parts of the plants are significantly dissimilar. In general, SFE-CO2 and hexane extracts from the same plant part have very similar compositions, as evidenced in Figures 2 and 3. To compare the compositions of the root and stem extracts, the peak areas of the compounds, which showed retention times (tR) between 6.1 and 33.3 min, were transformed into percentages. Similar HCA and PCA analyses using 14 extracts from the two provenances, and the peak area (%) for 41 compounds (characteristics) in HPLC chromatograms, were performed (Table 1S). They also indicated that supercritical and hexane extracts from the same plant parts and plant provenance were very similar. In addition, as expected, these analyses showed dissimilarities between these extracts and those obtained from acetone and ethanol extraction (Figures 4 and 5, Table 3S). Lignan 3 contributes significantly to PC1, PC2, and PC3 positive values, whereas lignans 1 and 2 contribute to PC3 positive and negative values, respectively (Figure 6S). As seen in Tables 1S and 3, SFE-CO2 can be successfully applied for the extraction of lignans from plants with different provenances and also from different plant parts. In addition, the richest extracts in aryltetralone lignans are from the roots. Maceration with hexane was more efficient in the extraction of lignans 1 and 2 from roots but supercritical fluid extraction was more efficient in their extraction from stems. Although the analyses by GC and HPLC took into account the compound percentages in the extract samples, the concentrations of the compounds in the extracts (Tables 1S, 2 and 3) should not be compared without considering the different conditions of analysis, sample preparations, and techniques. However, chemometric analyses showed that both GC-MS and HPLC-DAD-ESI/MS were reliable techniques for comparing plant part compositions and for discriminating the plant provenance, since PC1 and PC2 accounted for ca. 74% and 79% of the information, respectively. Furthermore, SFE-CO2 extraction protocol optimization may improve both the extraction yield and lignan purity in the obtained extracts.
EXPERIMENTAL Standard compounds Aldrich kits containing 24 standard hydrocarbons/C5-C30, straight-chain alkanes (Aldrich 29,850-6), 19 fatty acids/C6-C24, straight-chain (Aldrich 29,851-4), and fatty acid methyl esters/C6-C24 straight-chain (Aldrich 29,851-4) were used as standard compounds for GC-MS analyses. Natural compounds isolated and identified by spectroscopic methods (mainly by MS, 1H and 13C NMR) from H. reniformis and other Aristolochia species were also used as standards: bulnesol, lignans: (-)-8'-epi-aristoligone (1), (-)-aristotetralone (2), (-)-4'-O-methylenshicine (3), (-)-aristoligone (4), (-)-8'-epi-aristotetralone (5), cagayanone A (6), 8,8'-epi-aristoligone (7), cagayanone B (8), (-)-8-epi-holostylone (9), holostyligone (10), galbacin (11), and calopiptin (12) (Figure 1).6,14-18 Plant materials The plant materials were collected in Ituiutaba, MG, Brazil, and Imperatriz, MA, Brazil, in February 2008 and 2010, respectively, when the vines were in the blooming stage. The distance between these two collecting regions is about 1510 km.19 The plants were identified as Holostylis reniformis Duch. by Dr. Vinícius C. Souza and Dr. Lindolpho Cappellari Jr. Voucher specimens (ESA 88282/2008 and ESA 110744/2010) were deposited at the herbarium of the Escola Superior de Agricultura, Luiz de Queiroz (ESALQ), Piracicaba, SP, Brazil. The materials were separated according to the plant parts and dried (~ 45 ºC). As separation of roots from the stems is time-consuming, samples from plants of MA were also obtained without these part plant separations to provide information about extract compositions for further plant collections. Maceration extraction Ground plant materials (roots, stems, roots+stems, and leaves, 100.0 g each) from plants collected in MA and MG were individually subjected to maceration extraction with hexane, acetone, and ethanol, successively, as previously described (4 x ~200 mL, 2 days, and shaken manually every 12 h for 2 min for each extraction).4,5 The solvents were then eliminated under reduced pressure in a fume hood to give 18 extracts (E-1 to E-6 and E-13 to E-24, Table 1). Supercritical fluid extraction Similarly, ground plant materials (roots, stems, roots+stems, and leaves, 20 g each) were individually subjected to supercritical fluid extraction by using the extraction system previously described,11 with slight modifications. Briefly, a column (2.0 x 25.0 cm) filled with 20.0 g of the plant material was coupled to a supercritical extraction unit. The extraction system was operated with a static period of 5 min and, the procedure was then conducted using CO2 at 50 ºC and 27 MPa for 50 min and a flow rate of 40 L/min. The extracts were collected in a filtering flask cooled in an ice bath. After extraction, the pressure of the system was reduced, and the tubing located after the extraction column was washed with ethanol (10 mL) to recover residual matter deposited in this area. The solvent was eliminated in a fume hood to produce 6 extracts (E-7 to E-12, Table 1). Each combination of extraction and concentration was thus completed within 120 min. 1H NMR analyses 1H NMR experiments were performed on a Varian INOVA 500 spectrometer (11.7 T) at 500 MHz (1H) using deuterated solvents (CDCl3 and DMSO-d6) (P 99.9% D) and residual solvent as an internal standard for 1H NMR. d values are reported relative to TMS. Samples (30 mg each) were filtered through cotton wool, dissolved in 1.0 mL of deuterated solvent (CDCl3 or DMSO-d6), and then subjected to 1H NMR experiments (field: 11.7 T, temperature: 28 ºC, pulse: 45º, relax. delay: 0.904 sec, width: 7489.9 Hz; acq. time: 4.096 sec, repetitions: 16, FT size: 65536, total time: 80 sec). The compounds were identified by dereplication analyses of 1H NMR spectra of the crude extracts and by comparing 1H NMR data with those reported in the literature and/or with the authentic samples.2-6,15,18 Preparation of samples and standard solutions of extracts and their analyses by HPLC-DAD, HPLC-DAD-CD, and HPLC-DAD-ESI/MS Extracts and standard lignans (1 mg/mL MeOH) were filtered through a PVDF 0.45 µm membrane and subjected to qualitative (HPLC-DAD-ESI/MS, HPLC-DAD, and HPLC-DAD-CD) and semi-quantitative (HPLC-DAD) analyses. HPLC analyses were performed using a Shimadzu liquid chromatograph (SPD-10 Avp) equipped with UV-vis and 341-LC polarimeter detectors, and chromatograms were acquired at 336 and 254 nm using a Jasco LC-NetII/ADC equipped with photodiode array (MD-2018 Plus) and CD (2095 Plus) detectors (range of 200 to 420 nm). All HPLC conditions used in this work were identical: the samples were injected by an automatic injector; the injection volume was 20 µL and the elution time was 60 min; the columns were RP-18 (Varian, C18, with a particle size of 5 µm,250 x 4.6 mm); the mobile phase used was MeOH:H2O (7:3; v/v). HPLC-DAD-CD were used for determination of the Cotton effect signal characteristic of aryltetralone lignans at 310 nm.15 Mass spectra (ESI-MS) were obtained on an LCQ Fleet-Thermo Scientific, in positive ionisation mode (20V) recorded over a mass range of m/z 150-1050, and flow injection into the electrospray source was used for HPLC-DAD-ESI/MS. GC-MS analyses Except for E-17 to E-24, which showed very low solubility in hexane, the composition of the hexane solutions of the crude extracts was established by GC-MS analyses. These analyses were performed on a Shimadzu GCMS-QP5050A system in EI mode (70 eV) equipped with an automatic split/splitless injector (220 ºC), at a split ratio of 1/10, using a VF-1MS fused-silica capillary column (30 m x 0.25 mm i.d.; film thickness: 0.25 µm). The oven temperature was programmed from 60 ºC (5 min) to 280 ºC at a rate of 4 ºC/min and held at this temperature for 10 min. Helium was used as a carrier gas at a flow rate of 0.8 mL/min. The injection volume was 2 µL. Portions (0.5 mg) of each extract were dissolved with the GC-grade n-hexane (1 mL), filtered through a PVDF 0.45 µm membrane, and analysed by GC-MS (Table 3). Retention indices for all compounds were determined according to the equation proposed by van den Dool and Kratz,20 using n-alkanes as standards. Adjusted retention times (RRt) for each peak were determined by subtracting the retention time of helium from the retention time of each peak. Components were identified based on a comparison of their mass spectra with those held on the NIST/EPA/NIH Mass Spectral Database (NIST08), Mass Spectrometry Data Centre, and those described by Adams, as well as by comparing their I values with those of n-alkanes, fatty acids and acid methyl esters from Aldrichr, and with data in the literature.21 The extracts were co-injected with several compounds that had been previously isolated from H. Reniformis.2-6,15,18 Statistical analysis Relative quantitative analysis of data obtained from GC-MS and HPLC-DAD-ESI/MS Agglomerative hierarchical cluster analyses (HCA) and principal component analysis (PCA) were used as statistical methods to suggest the structure of the set and to analyse the variables in relation to the characteristics being studied. GC-MS statistical analysis Overall, 25 characteristics (chemical compounds identified by GC-MS) were analysed in 11 extracts by HCA and PCA (Tables 3 and 2S, Figures 2, 3, and 5S) by using the Pirouetter version 3.11 program.22 The chemical compositions were determined from the chromatographic profiles of 5 (6) extracts from parts of plants collected in MA (MG). To reduce scattering effects and to compare samples, the chromatograms were normalized by reducing the areas under each chromatogram to a value of 1.23 Plots defined by PC1 (score 1), PC2 (score 2), and PC3 (score 3) for the 25 characteristics were obtained for chromatographic data using Pirouetter version 3.11.22 HPLC-DAD-MS statistical analysis Analogously, plots defined by PC1 (score 1), PC2 (score 2), and PC3 (score 3) for 41 characteristics (tR determined by HPLC-DAD-ESI/MS and HPLC-DAD, Tables 1S and 3S, Figures 5 and 6S) and 14 samples (7 (7) extracts from parts of plants collected in MA (MG)) were obtained for HPLC data. In these cases, the variances of PC1 (9432.7588), PC2 (4662.0273), and PC3 (2356.6843) accounted for 52.88%, 26.14%, and 13.24%, respectively, of the total PCA variance. As described above, HCA was also performed for these 14 extracts and 41 compounds (Figure 4). Evaluation of linearity and limits of detection and quantification for the HPLC-DAD method The peak areas of the compounds were transformed into percentages to compare the compositions of the root and stem extracts. The contents of individual compounds were measured semi-quantitatively from linear regressions using 1 and 2, which were expressed as g/100 g extract (Table 2). This measuring was not performed in some extracts from MA due to the presence of a co-eluted compound, or in acetone and ethanol extracts that did not show peaks with tR in the selected range. The calibration curves were constructed by plotting peak areas of 1 and 2 against corresponding concentrations in triplicate (1: 0.005, 0.100, 0.200, 0.300, 0.450, 0.600, and 0.800 mg/mL; 2: 0.044, 0.078, 0.098, 0.132, and 0.176 mg/mL). Both calibration curves showed good linearity with correlation coefficients (1: r2 = 0.9999, 2: r2 = 0.9994). The linear regression equations were y = -1800.40818 + 1.76912 x 10⁷ x for 1 and y = 17518.5208 + 1.38655 x 10⁷ x for 2, where y is the peak area and x is the concentration of lignan (mg/mL), and r < 0.0001. The limits of detection (LOD, 1: 0.0121 mg/mL, 2: 6.769 x 10⁻³ mg/mL) and of quantification (LOQ, 1: 0.0367 mg/mL, 2: 0.0205 mg/mL) were estimated from the calibration curves (Figure 4S).24
CONCLUSIONS As a result of these analyses we can infer that the amount of aryltetralone lignans in extracts from the leaves, and in ethanol extracts from roots and stems is not significant. However, the hexane and the supercritical extracts from roots have similar chemical compositions. Although the SFE-CO2 extraction resulted in lower or equal yields, it is a faster and cleaner procedure than maceration extraction for the recovery of lignans. In addition, HCA and PCA showed intraspecific variability between plants collected from different regions of Brazil located a considerable distance from each other, while both GC-MS and HPLC-DAD-ESI/MS are reliable techniques for comparing plant part compositions.
SUPPLEMENTARY MATERIAL Tables 1S-3S and Figures 1S-6S are available at http://quimicanova.sbq.org.br, in PDF format, with free access.
ACKNOWLEDGEMENTS The authors thank Dr. Vinícius C. Souza and Dr. Lindolpho Capellari Jr. for plant identification, Alexandre Cestari for GC-MS experiments, and the Fundaçao de Amparo à Pesquisa do Estado de Sao Paulo (FAPESP), Coordenaçao de Aperfeiçoamento de Pessoal de Nível Superior (CAPES), and Conselho Nacional de Desenvolvimento Científico e Tecnológico (CNPq/MCT/MS/PRONEX, Brazil) for financial support and fellowships.
REFERENCES 1. Hoehne, F. C. Em: Flora Brasílica; Lanzara, F., ed.; Graphicards: Sao Paulo, 1942, vol. 15, p. 1-141. 2. de Andrade-Neto, V. F.; da Silva, T.; Lopes, L. M. X.; do Rosario, V. E.; Varotti. F. P.; Krettli, A. U.; Antimicrob. Agents Chemother. 2007, 51, 2346. 3. Messiano, G. B.; da Silva, T.; Nascimento, I. R.; Lopes, L. M. X.; Planta Med. 2008, 74, 924. 4. Messiano, G. B.; da Silva, T.; Nascimento, I. R.; Lopes, L. M. X.; Phytochemistry 2009, 70, 590. 5. da Silva, T.; Krettli, A. U.; de Andrade-Neto, V. F.; Lopes, L. M. X.; Revista da Propriedade Industrial 2005, 1795, 1774. 6. Messiano, G. B.; Wijeratne, E. M. K.; Lopes, L. M. X.; Gunatilaka, A. A. L.; J. Nat. Prod. 2010, 73, 1933. 7. Slanina, J.; Glatz, Z.; J. Chromatogr. B 2004, 812, 215. 8. Herrero, M.; Castro-Puyana, M.; Mendiola, J. A.; Ibañez, E.; Trends Anal. Chem. 2013, 43, 67; Choi, Y. H.; Kim, J.; Yoo, K.-P.; Chromatographia 2003, 57, 73; Suto, K.; Ito, Y.; Sagara, K.; Itokawa, H.; J. Chromatogr. A 1997, 786, 366. 9. Opletal, L.; Sovová, H.; Bártlová, M.; J. Chromatogr. B 2004, 812, 357; Lojková, L.; Slanina, J.; Mikesova, M.; Táborská, E.; Vejrosta, J.; Phytochem. Anal. 1997, 8, 261. 10. Comin, L. M.; Temelli, F.; Saldaña, M. A.; J. Am. Oil Chem. Soc. 2011, 88, 707; Wang, L.; Weller, C. L.; Trends Food Sci. Technol. 2006, 17, 300. 11. Egydio, J. A.; Moraes, A. M.; Rosa, P. T. V.; J. Supercrit. Fluids 2010, 54, 159. 12. Justo, O. R.; Moraes, A. M.; Barreto, G. P. M.; Mercadante, A. Z.; Rosa, P. T.V.; Quim. Nova 2008, 31, 1699. 13. Teresa, J. P.; Urones, J. G.; Fernandez, A.; Alvarez, M. D. V.; Phytochemistry 1984, 23, 461; Aguilar, M. I.; Espejo, O.; Camacho, D.; Fitoterapia 1992, 63, 275. 14. McAlpine, J. B.; Riggs, N. V.; Gordon, P. G.; Aust. J. Chem. 1968, 21, 2095. 15. da Silva, T.; Lopes, L. M. X.; Phytochemistry 2004, 65, 751. 16. da Silva, T.; Lopes, L. M. X.; Phytochemistry 2006, 67, 929. 17. Lopes, L. M. X.; Pereira, M. D. P.; da Silva, T.; Krettli, A. U.; Pharm. Biol. 2012, 50, 643. 18. Pereira, M. D. P.; da Silva, T.; Lopes, L. M. X.; Krettli, A. U.; Madureira, L. S.; Zukerman-Schpector, J.; Molecules 2012, 17, 14046. 19. http://sistemas.anatel.gov.br/apoio_sitarweb/Tabelas/Municipio/DistanciaDoisPontos/Tela.asp, acessada em dezembro 2012. 20. van den Dool, H.; Kratz, P. D.; J. Chromatogr. A 1963, 11, 463. 21. Houss, T. G.; Road, M.; Eight Peak Index of Mass Spectra, 4th ed., The Royal Society of Chemistry, The Mass Spectrometry Data Centre: Cambridge, 1991, vols. 1-3; Adams, R. P.; Identification of Essential Oil Components by Gas Chromatography/Mass Spectroscopy, 4th ed., Allured Publishing Corporation: Carol Stream, 2009; Francisco, C. S.; Messiano, G. B.; Lopes, L. M. X.; Tininis, A. G.; de Oliveira, J. E.; Capellari Jr., L.; Phytochemistry 2008, 69, 168; http://www.pherobase.com, acessada em março 2012. 22. InfoMetrix; Pirouetter for Windows; Version 3.11, Inc. Bothell, 2003. 23. Bertrand, D.; Scotter, C. N. G.; Appl. Spectrosc. 1992, 46, 1420. 24. Thompson, M.; Ellison, S. L. R.; Wood, R.; Pure Appl. Chem. 2002, 74, 835. |
On-line version ISSN 1678-7064 Printed version ISSN 0100-4042
Qu�mica Nova
Publica��es da Sociedade Brasileira de Qu�mica
Caixa Postal: 26037
05513-970 S�o Paulo - SP
Tel/Fax: +55.11.3032.2299/+55.11.3814.3602
Free access


