Artigo
| A novel rhodamine-based fluorescence chemosensor containing polyether for mercury (II) ions in aqueous solution |
|
Wenqi Du; Yu Cheng; Weixin Shu; Zhengjian Qi*
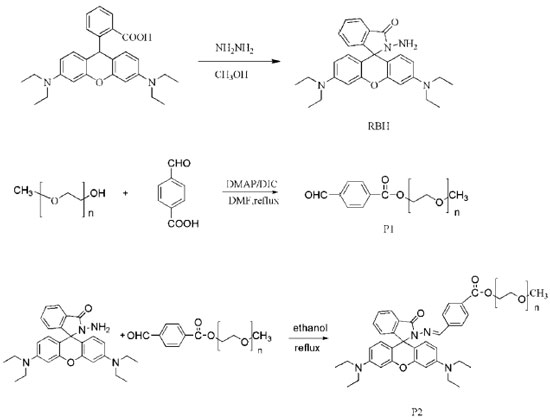
College of Chemistry and Chemical Engineering, Southeast University Road 2, Jiangning District 211189, Nanjing, Jiangsu Province, P.R. China Recebido em 03/12/2016 *e-mail: qizhengjian506@163.com A novel rhodamine-based Hg2+ chemosensor P2 containing polyether was readily synthesized and investigated, which displayed high selectivity and sensitivity for Hg2+. Because of good water-solubility of polyther, the rhodamine-based chemosensor containing polyether can be used in aqueous solution. The sensor responded rapidly to Hg2+ in pure water solutions with a 1:1 stoichiometry. Meanwhile, it indicated excellent adaptability and also the responsiveness. INTRODUCTION Various transition-metal ions are crucial for the life of organisms. Mercury is a not only dangerous but also hazardous toxic which has posed a great threat to our environment.1-4 Nowadays, average daily human intake of Hg2+ is nearly 20~30 µg and more seriously is 200~300 µg. This toxic ion species is a widespread industrial pollutant and make a serious influence on our health. Different speciation mercury can penetrate our environment by various ways, such as methyl mercury produced by aquatic microbes which accumulates through the food chain and oxidation of mercury vapor in atmosphere to water-soluble Hg2+ ions.5,6 It will have a serious effect on human's health after long-term exposure in this environment, which will lead to nausea, vomiting, abdominal pain, renal dysfunction and other diseases. The best way to detect Hg2+ that has gone into the food chain or contaminated the environment is to monitor the extent of mercury present in microorganisms such as bacteria, which survive in waste water or effluents.7 In recent decades, many methods have been developed to apply to mercury detection including graphite furnace atomic absorption spectrometry, atomic emission spectrometry, inductively coupled plasma atomic emission spectrometry and electrochemical methods.8-12 The major disadvantages of these detection techniques are expensive and time-consuming. Conversely, optical detection gives its priority to easy operability and high sensitivity. Great changes in absorption and fluorescent spectra of many compounds after interacting with the metal ions, so fluorescence analytical methods are effective and efficient ways to detect ions.13-15 Rhodamine B and its derivatives (RBHs) are well-known for their desirable properties, including good photostability, high extinction coefficient, and high fluorescence quantum yield, particularly in its nucleotide and nucleic acid conjugates.16 While some rhodamine-based chemosensors for Hg2+ ions have been reported,17-22 dual colorimetric and fluorescent chemosensors for Hg2+ were still rare23 and some of them were not efficient enough to be selective toward Hg2+ or sensed it in solvents. While, some of them were operated in organic solvents or in aqueous solution of organic solvent, which limit their applications in organism.24-28 Hence, the development of novel pure water soluble, sensitive and interference-free fluorescent chemosensors for Hg2+ detection is still highly desired. Poly(ethylene glycol) methyl ether[PEG], which is a well-known nontoxic, flexible, and excellent water-soluble polymer, is widely used in pharmaceutical, cosmetic, food processing and other industries.29-32 So PEG provides a feasible way to enhance the water solubility of rhodamine. Here, we report a novel water-soluble and turn-on rhodamine-based caprolactam derivatives as a chemosensor for Hg2+ incorporating with poly (ethylene glycol) methyl ether (PEG), when binding phenomena could be probed through binding-induced changes in an electronic spectral pattern. Firstly, the hydrophilic polyether could reduce aggregation-caused quenching when rhodamine dyes tend to aggregate at high concentrations. Secondly, after RBH anchored in the PEG, the fluorescence experiments of this probe were performed in a pure aqueous solution, which is different from other probes determined in organic solvent or mixed solutions. We have designed this structure based on the idea that it is well-known that mercury ion is a soft-acid, it has been found that mercury ion is inclined to have a coordination sphere containing N and O. On the other hand, the Schiff base structure provides a good ligand for mercury ion. The rhodamine-B acts as fluorophore which is covalently attached to polyether aromatic compound containing the heterocyclic nitrogen atoms. What's more, polyether aromatic compound has greatly enhanced the solubility of rhodamine B derivative. Sensor P2 was shown in Scheme 1.
EXPERIMENTAL Apparatus Fluorescence spectra measurement were performed on Horiba Jobin Yvon Inc. Fluorolog 3-TSCPC (Under the experiment conditions, all the excitation and emission silts are 5 nm). 1H NMR spectrum was run on a Bruker 300 MHz spectrometer using TMS as the internal standard. Mass spectrum was recorded with a VG ZAB-HS double focusing mass spectrometer. Absorption spectra were measured on a UV-2201 double-beam UV/VIS spectrometer (All the measurements were conducted at room temperature). Materials All the materials for synthesis were purchased from Sinopharm Chemical Reagent Co., Ltd (Shanghai, China) and used without further purification. Poly (ethylene glycol) methyl ether with the number average molecular weight of 350 and degree 98.0 % was purchased from Energy Chemical company and dried in vacuum for 24 h before use. The solutions of metal ions were prepared from their analytical grade nitrate salts. The solutions of metal ions were prepared as 0.2 mmol L-1 in water solution. Synthesis of Rhodamine B hydrazide(RBH) As for the synthesis of RBH, several different procedures have been reported.33-35 In this study, RBH was synthesized by a modified method according to Xiang(yield: 81.0%).36 m/z:457.3([M+H]+);M+ calculated 456.3. IR(KBr, cm-1): ν=3428, 2987, 2926, 1689, 1614, 1514, 1380, 1218, 1117, 818, 767. 1H NMR (400 MHz, CDCl3, δ ppm), δ (ppm):1.17 (t, J=7.0Hz, 12H), 3.34 (q, J=7.0Hz, 8H), 3.62 (s, 2H), 6.27 (d, J=2.8Hz, 1H), 6.30 (d, J=2.4Hz, 1H), 6.43(d, J=2.4Hz, 2H),6.45 (d, 2H), 7.11 (m, 1H), 7.42 (d, 1H), 7.44(d, 1H), 7.93 (m, 1H). Synthesis of P1 P1 was synthesized according to the esterification reaction. To 100mL flask, 4-carboxybenzaldehyde (1.5 g, 0.01 mol) and poly (ethylene glycol) methyl ether (3.5 g, 0.01 mol) were dissloved in 50 mL of dimethyl formamide (DMF). Then dimethylaminopyridine (DMAP) (0.122 g, 0.001 mol) and N, N-diisopropylcarbodiimide (DIC) (1.26 g, 0.01 mol) were added into the flask. The reaction was carried out by reflux for 48 h when the color of solution finally turned yellow into brownish red. In order to remove dimethyl formamide from product, a large amount of saturated salt water was prepared to add into flask. Then the solution changed into turbid solution, and along with a large white precipitate was dissolved out. After filtration, faint yellow filter liquor was extracted by diethyl ether. The resulting product is finally dried under vacuum at room temperature after the aqueous phase conducted reduced pressure distillation. Yield: 50.0%.FT-IR of P1(KBr), cm−1: 3271, 2971, 2865, 1722, 1629, 1551, 1463, 1359, 1322, 1167, 1120, 850. 1H NMR of P1(400 MHz, CDCl3), (δ, ppm): 9.98(s, -CHO), 7.85(m, ArH), 7.72(m, ArH), 3.37-4.30(m, -CH2), 3.24(m, -CH3). Synthesis of P2 RBH (0.5 mmoL, 0.240 g) was dissolved in 30 mL ethanol, and then polymer P1 (0.5 mmoL, 0.241 g) was slowly added. The mixture was stirred and refluxed for 12 h at 80 °C. After distillation in vacuum, the residue was recrystallized with methanol to give the final product P2. Yield: 52.0%. 1H NMR of P2(400 MHz, CDCl3), (δ, ppm): 1.17 (t, J=7.0 Hz, NCH2CH3, 3.24 (q, J=7.0 Hz, -CH3), 3.34 (q, NCH2CH3), 3.80-4.50 (m, -CH2), 6.46 (d, J=2.4HZ, Xanthene-H), 6.42 (d, J=2.4 Hz, Xanthene-H), 6.29 (d, J=2.8 Hz, Xanthene-H), 7.93 (m, ArH), 7.45 (m, ArH), 7.11 (m, ArH), 7.7 (m, ArH), 8.0 (m, ArH), 8.1 (s, -CH).
RESULT AND DISCUSSION The structures of compounds RBH, P1 and P2 were characterized by 1H-NMR, IR and HR-MS. The results were in good agreement with the structure. Fluorescence and UV-vis studies were performed using the 2x10⁻⁵ mol/L solution of P2 in an aqueous solution with appropriate amounts of metal ions. Metal ion selectivity and competition experiments The selectivity of probe P2 toward different metal ions was conducted as shown in Figure 1. Probe P2 show a weak fluorescence in the absence of metal ions. On the addition of 10 eqiv. metal ions, the fluorescence intensity has changed. It is obvious that when 10 eqiv. Hg2+ was introduced into a solution of P2 in pure water, the fluorescence intensity increased. However, under the same condition, other metal ions such as Fe3+, Zn2+, Mg2+, Ca2+, Cd2+, Cu2+, Pb2+, Ni2+, Mn2+, K+, Li+, Ag+, Al3+, Co2+ and Na+, except for Ba2+, did not show remarkable changes in fluorescence intensity and color. Therefore, these phenomena indicated that probe P2 has an excellent selectivity towards Hg2+ in aqueous solution served as an "off-on" chemical sensor. Furthermore, we determined if probe P2 can recognize Hg2+ when it coexists with other metal ions in virtue of competition experiments. As shown in Figure 2, metal ions competiton experiments have conducted, which indicates the background metal ions showed very low interference with the detection of Hg2+ in the pure water solution.
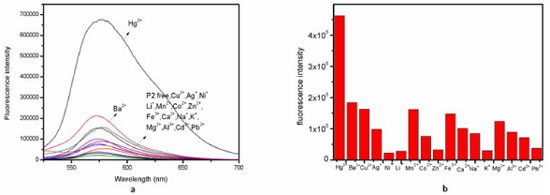 Figure 1. (a) Fluorescence spectra of P2 (10 µmol/L) in aqueous solution the presence of 10 equiv. of various metal ions; (b) Fluorescence intensity of P2 (10 µmol L-1) in aqueous solution the presence of 10 equiv. of various metal ions
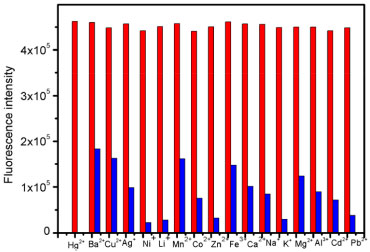 Figure 2. Fluorescence intensity (at 580 nm) of P2 upon the addition of 10 µmol L-1 Hg2+ in the presence of 10 µmol L-1 background metal ions in aqueous solution (Red bar: P2 + competing ions+Hg2+ Blue bar: P2 + competing ions)
Emission spectra and detection limit of sensor P2 As shown in Figure 3, UV-vis spectrum of compound P2 (2x10⁻⁵ mol L-1) exhibited only very weak bands over 450 nm, which could be attributed to the presence of a trace amount of the ring-opened form of compounds. On addition of 10 equiv. Hg2+ into solution, P2 immediately resulted in a significant enhancement of absorbance at about 560 nm simultaneously the color changed into light rose red. Other metal ions such as Zn2+, Mg2+, Ca2+, Cd2+, Cu2+, Pb2+, Ni2+, Mn2+, K+, Li+, Ag+, Co2+, Fe3+except for Ba2+, did not show any significant color and spectral change. These phenomena suggest that these compounds can serve as "naked-eye" chemosensor for Hg2+. The spectral properties of sensor P2 were examined by Fluorolog 3-TSCPC and fluorescence titrations. Fluorescence spectra of Hg2+ titration were shown in Figura 4. Sensor P2 (1x10⁻⁵ mol L-1) has a very weak fluorescence emission at about 560 nm with excitation at 500 nm. Upon addition of Hg2+ (0-1.1 equiv), it displays a remarkable enhancement of fluorescence intensity, which is saturated by 1.4 equiv. of Hg2+with about 9-fold increase.
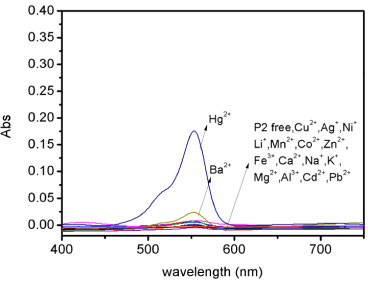 Figure 3. Absorbance spectra of P2 (20 µmol/L) in aqueous solution with the presence of 10 equiv. of various species
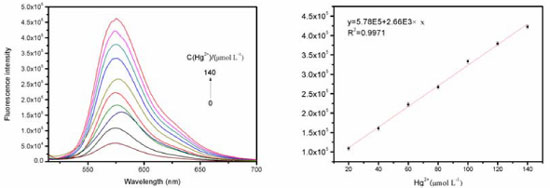 Figure 4. (a) Fluorescence intensity at 580 nm of P2(10.0 µmol L-1) in an H2O solution with different amounts of Hg2+; (b) The fluorescence intensity (at 580 nm) of compound P2 (10 µmol L-1) as a function of the Hg2+ concentration in aqueous solution
Limit detection of metal ions plays an important role in evaluating fluorescence sensor and the determination of the detection limit was calculated with Eq. DL = 3σ/k. Where, σ is the standard deviation of blank measurement and S is the slope from plotting the relative fluorescence intensity versus Hg2+ concentration. As shown in the Figure 4(b), as for probe P2, it demonstrates a good linear relationship (Stern-Volmer equation) between the fluorescence intensity and the Hg2+ concentration. The linear response for the fluorescence intensity response of compound P2 was between 0 and 1.4x10⁻⁴ mol L-1 and the detection limit of Hg2+ was measured to be 1.7x10⁻⁷ mol L-1, which suggests that sensor P2 has moderate affinity and high sensitivity for Hg2+. The association constant K of the complex P2-Hg2+ was then calculated to be 0.93x10³ M−1, with a linear relationship (Figure 5) by Benesi-Hildebrand method (FMax: the maximum of fluorescence intensity when the probe P2 coordinates with mercury ion under the fluorescence titration experiment conditions. FMin: the fluorescence intensity of free probe P2 under the fluorescence titration experiment conditions), Eq. (1)37,38 
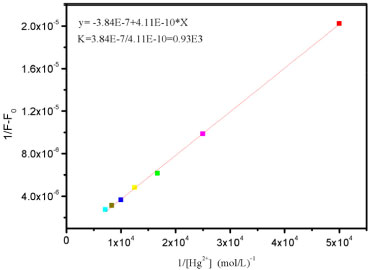 Figure 5. Benesi-Hildebrand plot (λex = 500 nm) of P2, assuming 1:1 stoi chiometry for association between P2 and Hg2+ in the aqueous solutions
Responsiveness and adaptability The adaptability and also the responsiveness have been determined using the lifetime of the P2 and Hg2+ by time-resolved fluorescence spectrofluorometer and time-response plot. The fluorescence lifetime was measured at an excitation 460 nm of the NanoLED source. The decays of probes were found to be monoexponential. The lifetime decays in the absence of Hg2+ and in the presence of Hg2+ are shown in Figure 6. The average lifetime of P2 was 1.72 ns and 5.10ns (XSQ = 1.31) while the lifetime of P2 + Hg2+ was 1.74 ns (XSQ = 1.05). Double exponential fitting equation was used to describe the fluorescence lifetime of probe itself , because xanthene was a chromophore which formed a conjugated system. The upper part of structure formed a plane and orthogonalized with the ring of xanthene which also can be seen as a chromophore. After adding metal ions, the upper part including carbanyl group and phenyl group do not conjugate with xanthenes, and the stereo-hindrance effect of carbanyl group limits the rotation of the benzene ring. So the major chromophore is still xanthene which used single exponential fitting equation. Time-dependence for binding of the probe P2 with Hg2+ is given in Figure 7. Following the addition of 10 equiv. Hg2+ ion to 20.0 mmol L-1 probe P2, the fluorescence intensity of probe P2 was turn on moderately, and reached a stable value within 20 min.
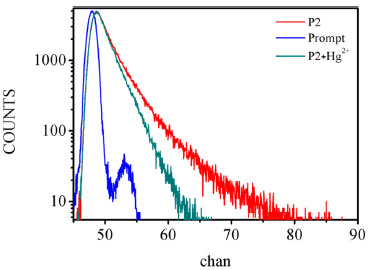 Figure 6. Fluorescence decay curves of P2 and P2 + Hg2+ in aqueous solution obtained at λex =500 nm
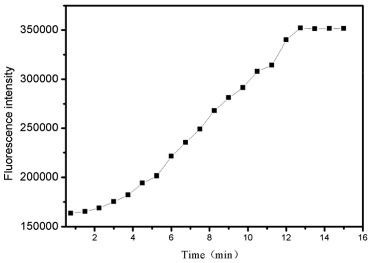 Figure 7. Fluorescence turn on profile of addition Hg2+ (1.5 equiv.) to P2(10.0 µmol L-1) in water (pH 7.2) from 0.4 to 13 min
To further investigate the interaction of Hg2+ and the probe P2, the Hg2+ binding stoichiometry of the probe can be determined from the Job plot. It is obvious in the Figure 8 that the fluorescence intensity reached a maximum when the ratio was 0.5, which suggesting that a 1:1 stoichiometry of the Hg2+ to the probe in the complex. And we also explore the effect of pH on the chemosensor response as shown in Figure 9.
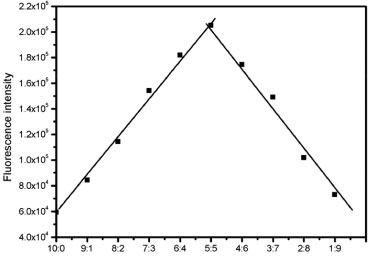 Figure 8. Job's plot of the complexation between P2 and Hg2+, total concen tration of P2 and Hg2+ is 20.0 µmol L-1
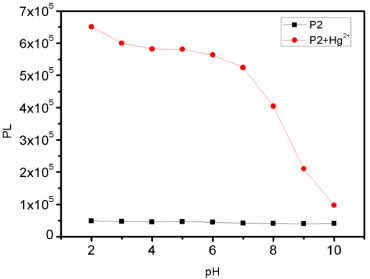 Figure 9. Fluorescence intensity (580 nm) of free chemosensor P2 (10 µmol L-1) and in the presence of 10 equiv. Hg2+ in aqueous solutions with different pH conditions
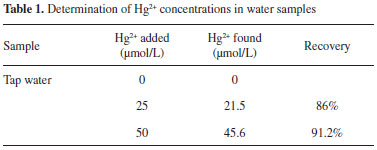
APPLICATION AND MECHANISM In order to explore its practicality in real samples, we selected probe P2 in a standard addition method to determine the mercury ion in water tap from our lab. No fluorescence enhancement was observed when the tap water existed only. When the tap water were spiked with different concentrations of mercury ion(0 µmol L-1, 25 µmol L-1, 50 µmol L-1) and measured with the methods above, mercury recoveries were about 88.0% (Table 1).
From the molecular structure and spectral results of P2, a fluorescent chemosensor for Hg2+ was constructed as shown in Figure 10. It can be concluded from the figure after the addition of the Hg2+ ion induced a ring opening of the spirolactam of rhodamine took place.
CONCLUSIONS In summary, a water-soluble fluorescent sensor P2 for mercury ion has been designed and synthesized. This probe display 1:1 complex formation with mercury ion which could be monitored by the spectral changes as well as color changes. It showed high sensitivity and selectivity for Hg2+ recognition in comparison to other metal ions in pure aqueous solution. Especially, it should be noted that these fluorescence experiments were performed in a pure aqueous solution, which is different from other probes determined in organic solvent or mixed solutions. Based on these conditions, this senor show a great potential in the detection and analysis of diverse mercury-related cases in biological, medical and environmental areas. SUPPLEMENTARY MATERIAL Figures 1S to 5S are available for download at http://quimicanova.sbq.org.br in pdf format with free access
ACKNOWLEDGEMENTS This work was supported by the Fundamental Research Funds for the Central Universities (KYLX15_0125) and National Major Scientific Instruments and Equipment Development Projects (2014YQ060773) and A Project Funded by the Priority Academic Program Development of Jiangsu Higher Education Institutions (1107047002) and Policy Guidance Program (Research Cooperation)-Prospective Joint Research Project (BY2016076-02)
REFERENCES 1. Boening, D. W.; Chemosphere 2000, 40, 1335. 2. Nolan, E. M.; Lippard, S. J.; Chem. Rev. 2008, 108, 3443. 3. Nolan, E. M.; Lippard, S. J.; J. Am. Soc. 2003, 125, 14270. 4. Wang, C.; Wong, K. M.; Inorg. Chem. 2013, 52, 13432. 5. Clarkson,T. W.; Magos, L.; Myers, G. J.; New. Engl. J.Med. 2003, 349, 1731. 6. Llobet, J.; Falco, G.; Casas, C.; Teixido, A.; Domingo, J.; J. Agr. Food. Chem. 2003, 51, 838. 7. Suresh, M.; Shrivastav, A.; Mishra, S.; Suresh E.; Das, A.; Org. Lett. 2008, 10, 3013. 8. Chen,Y.; Han, K. Y.; Liu,Y.; Bioorg. Med. Chem. 2007, 15, 4537. 9. Roy, P.; Dhara, K.; Manassero, M.; Ratha, J.; Banerjee, P.; Inorg. Chem. 2007, 46, 6405. 10. Royzen, M.; Durandin, A.; Young, V. G.; Geacintov, N. E.; Canary, J. W.; J. Am. Soc. 2006, 128, 3854. 11. Banerjee, A.; Sahana, A.; Das, S.; Lohar, S.; Guha, S.; Sarkar, B.; Mukhopadhyay, S. K.; Mukherjee A. K.; Das, D.; Analyst 2012, 137, 2166. 12. Ding, P.; Wang, J.; Cheng, J.; Zhao,Y.; Ye, Y.; New. J. Chem. 2015, 39, 342. 13. Lee, H. Y.; Swamy, K.; Jung, J. Y.; Kim, G.; Yoon, J.; Sens. Actuators, B 2013, 182, 530. 14. Sen, S.; Mukherjee, T.; Chattopadhyay, B.; Moirangthem, A.; Basu, A.; Marek, J.; Chattopadhyay, P.; Analyst 2012, 137, 3975. 15. Patil, R.; Moirangthem, A.; Butcher, R.; Singh, N.; Basu, A.; Tayade, K.; Fegade, U.; Hundiwale, D.; Kuwar, A.; Dalton Trans. 2014, 43, 2895. 16. Haugland, R. P.; The handbook: a guide to fluorescent probes and labeling technologies, Invitrogen Corp.: Carlsbad, 2005. 17. Huang, J.; Xu, Y.; X. Qian; Org. Chem. 2009, 74, 2167. 18. Suresh, M.; Mishra, S.; Mishra, S. K.; Suresh, E.; Mandal, A. K.; Shrivastav, A.; Das, A.; Org. Lett. 2009, 11, 2740. 19. Zhou,Y.; Wang, F.; Kim, Y.; Kim, S. J.; Yoon, J.; Org. Lett. 2009, 11, 4442. 20. Du, J.; Fan, J.; Peng, X.; Sun, P.; Wang, J.; Li, H.; Sun, S.; Org. Lett. 2010, 12, 476. 21. McClure, D. S.; J. Chem. Phys. 1952, 20, 682. 22. Suresh, M.; Ghosh, A.; Das, A.; Chem. Commun. 2008, 33, 3906. 23. Renzoni, A.; Zino, F.; Franchi, E.; Environ. Res. 1998, 77, 68. 24. Kumar, K. S.; Ramakrishnappa, T.; Balakrishna, R. G.; Pandurangappa, M.; J. Fluoresc. 2014, 24, 67. 25. Dong, Z.; Tian, X.; Chen,Y.; Hou, J.; Guo,Y.; Sun, J.; Ma, J.; Dyes Pigm. 2013, 97, 324. 26. Yang, B.; Wu, W.; The Imaging Science Journal 2013, 31, 421. 27. Zhang, Y.; Shi, B.; Zhang, P.; Huo, J.; Chen, P.; Lin, Q.; Liu, J.; Wei, T.; Sci. China Chem. 2013, 56, 612. 28. Wang, L.; Zheng, B.; Zhao, Y.; Du, J.; Xiao, D.; Anal. Methods 2012, 4, 2369. 29. Molineux, G.; Cancer. Treat. Rev. 2002, 28, 13. 30. Fruijtier-Pölloth, C.; Toxicology 2005, 214, 1. 31. Feng, L.; Yang, X.; Shi, X.; Tan, X.; Peng, R.; Wang, J.; Liu, Z.; Small 2013, 9, 1989. 32. Vanin, F.; Sobral, P.; Menegalli, F.; Carvalho, R.; Habitante, A.; Food Hydrocolloids 2005, 19, 899. 33. Dujols, V.; Ford, F.; Czarnik, A. W.; J. Am. Soc. 1997, 119, 7386. 34. Yang, X. F.; Guo, X. Q.; Zhao, Y. B.; Talanta 2002, 57, 883. 35. Geng, T.; Huang, R.; Wu, D.; RSC Adv. 2014, 4, 46332. 36. Xiang, Y.; Mei, L.; Li, N.; Tong, A.; Anal. Chim. Acta 2007, 581, 132. 37. Liu, Y. J.; Chao, H.; Yao, J. H.; Li, H.; Yuan, Y. X.; Ji, L. N.; Helv. Chim. Acta 2004, 87, 3119. 38. Yan, L.; Zhou, Y.; Du, W.; Kong, Z.; Qi, Z.; Spectrochim. Acta, Part A 2016, 155, 116. |
On-line version ISSN 1678-7064 Printed version ISSN 0100-4042
Qu�mica Nova
Publica��es da Sociedade Brasileira de Qu�mica
Caixa Postal: 26037
05513-970 S�o Paulo - SP
Tel/Fax: +55.11.3032.2299/+55.11.3814.3602
Free access


