Artigo
| Highly selective HF-LPME-GC-MS for cocaine and biotransformation products in human hair to monitor drug addicts |
|
Deborah Thais Palma ScanferlaI; Jessica Yuri SakuradaI; Luís Otávio de OliveiraI; Renata Sano LiniI; Raul Gomes AgueraI; Mariana Aparecida Oliveira MadiaI; Paula Pessoa MoreiraI; Jessica Cristina Zoratto RomoliII; Érika BandoII; Miguel Machinski JuniorII; Camila MarchioniIII; Simone Aparecida Galerani MossiniII,*
I. Departamento de Análises Clínicas e Biomedicina, Universidade Estadual de Maringá, 87020-900 Maringá - PR, Brasil Recebido em 12/10/2020 *e-mail: simonegmossini@gmail.com This study aimed to investigate a miniaturized extraction methodology with analysis by GC-MS for simultaneous detection and quantification of cocaine (COC), benzoylecgonine (BZE) and cocaethylene (CE) in hair to monitor drug addicts. The process was done following the international guide of the Scientific Task Force on Forensic Toxicology. After sample extraction, derivatizing solution was added, clean-up was done by the Hollow Fiber Liquid Phase Microextraction (HF-LPME) and adapted to use the ultrasonic bath, a simple and easy-to-handle device. Isobutylchloroformate was first used as derivatization reagent to convert benzoylecgonine to isobutylbenzoylecgonine. Analytes quantification occurred within a linear range of 0.1 to 20 ng mg-1 for COC and 0.05 to 5 ng mg-1 for BZE and CE, with a correlation coefficient of r > 0.99. Limits of detection were 0.05; 0.03 and 0.03 ng mg-1, whereas limits of quantification were 0.1; 0.05 and 0.05 ng mg-1 for COC; BZE and CE, respectively. There was no matrix effect interference. Intra and inter-day precision and accuracy were acceptable according to international guidelines. The analytical method HF-LPME-GC-MS was successfully applied to 14 hair samples from patients admitted in drugs detoxification programs. All samples resulted positive for cocaine (0.80-> 20 ng mg-1) and benzoylecgonine (0.20-> 5 ng mg-1), 11 samples were positive for cocaethylene (0.10-> 0.60 ng mg-1). INTRODUCTION Cocaine (COC) consumption continues to increase, and it is estimated that there are 18 million users all over the world.1 Abusive cocaine consumption is strongly associated with physical and mental risk factors, and it has a direct impact on public health and safety.2,3 Cocaine is quickly metabolized in the body, which generates benzoylecgonine (BZE), by spontaneous hydrolysis, that must go through a derivatization process to be analyzed by Gas Chromatography-Mass Spectrometry (GC-MS). So, the analyzed product can be isobutyl-BZE. Other derivative can also be found such as cocaethylene (CE), which is formed by the transesterification of COC when alcohol is consumed simultaneously.4 COC, BZE, isobutyl-BZE and CE structures are illustrated in Figure 1.
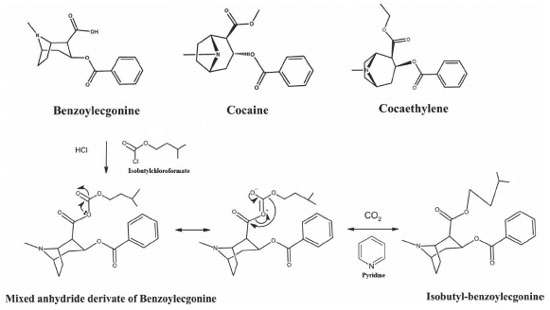 Figure 1. Chemical structure of COC, CE and chemical reaction showing the mechanism for the formation of isobutyl-BZE
Hair analysis has shown its importance in retrospective investigations on the chronic consumption of substances due to its wide window of detection. This is explained by one of the mechanisms for drug incorporation into hair: the diffusion from blood supplying the growing follicle, that is, drugs found in blood are spread and incorporated into the hair matrix.5-7 The hair has a constant growth of approximately 1 cm/month and the drugs and their metabolites once incorporated into this matrix can remain unchanged for a long time without undergoing metabolism or degradation. However, although there is little understanding of this incorporation, some researches have focused on drug properties associated with their concentrations in hair.5,6 In the case of COC, its unchanged form and its main metabolite BZE are the main targets of hair analysis, for the purpose of proving cocaine consumption.4 Nowadays, there have been remarkable advances in terms of sensitive analytical techniques used in forensic toxicology, which allow the analysis of drugs with high sensitivity, quickness and safety when it comes to complex matrices, such as hair. Using hair samples instead of conventional matrices, such as urine and blood, is advantageous due to the fact that its collection is simple, the procedure is not invasive and, in forensic situations, it can be done under strict supervision so as to avoid adulteration and samples replacement.8,9 Sensitive analytical techniques such as miniaturized techniques for sample preparation are worth being highlighted, for example, the Hollow Fiber Liquid Phase Microextraction (HF-LPME). It is known as a green friendly procedure, due to the reduction to a minimum amount of organic solvents applied (microliters). HF-LPME also offers advantages such as lower final cost and high efficiency compared of solid-phase microextraction (SPME).10 In association with this type of extraction, GC-MS can be applied to analyzing drugs in biological matrices11 due to its sensitivity, high precision, quickness, high power of separation and resolution, and the use of small amounts of samples.12 There are several studies in the literature about drug extraction by HF-LPME in whole blood, plasma, urine and oral fluid samples.13-20 However, only one study reports this type of extraction for cocaine and its biotransformation products in hair.21 Given that HF-LPME has excellent sample clean-up effect,13 the execution of the technique in complex matrix, as hair, can be further developed. Therefore, this study aimed to verify the derivatization capacity of benzoylecgonine with a never described reagent, isobutylchloroformate, and the use of an easy-to-handle device, the ultrasonic bath, to evaluate the efficiency of the HF-LPME methodology. Both reagent and ultrasound equipment are more accessible in the toxicology laboratory. The HF-LPME-GC-MS methodology has been validated for the detection of COC, BZE and CE in hair samples. Additionally, samples obtained from patients admitted to a rehabilitation clinic were studied in order to verify the applicability of the technique.
EXPERIMENTAL Chemicals and reagents Standard solutions of COC, BZE and CE (1.0 mg mL-1 in methanol), along with their deuterated internal standards COC-d3 and BZE-d3 (1.0 mg mL-1 in methanol) were purchased from Cerilliant Corporation® (Round Rock, TX, USA). Anhydrous sodium bicarbonate (NaHCO3) and hydrochloric acid (HCl) were purchased from Anidrol® (Diadema, Brazil). Potassium carbonate (K2CO3) was supplied by Labsynth® (Diadema, Brazil). Pyridine was purchased from Vetec® Química Fina (Rio de Janeiro, Brazil). Isobutyl chloroformate and dihexyl ether were supplied by Sigma-Aldrich® (St. Louis, MI, USA). Methanol, acetonitrile and dichloromethane were purchased from Merck® (Darmstadt, Germany). Deionized water was supplied by Milli-Q system, Millipore® (Barueri, Brazil). Working solutions were prepared through adequate dilution of the stock solutions with methanol for final concentrations of 10 µg mL-1 and 1 µg mL-1. All solutions were stored in a freezer at -20 ºC. HF-LPME devices, Accurel KM polypropylene Q3/2 hollow fibers (600 µm i.d., 200 µm wall thickness and 0.2 µm pore size) were supplied by Membrana® (Wuppertal, Germany). GC-MS analysis The analyses were carried out by using a TRACE 1300 GC System Gas Chromatograph coupled to a Thermo Scientific® ISQ Series quadrupole mass-selective detector (MSD) (Thermo Fisher Scientific, Milan, Italy), with the aid of an AI 1310 automated analyzer. Separation of the analytes was done by using a capillary column (30 m x 0.25 mm x 0.25 μm) with 5% of Phenyl Polysilphenylene-Siloxane (TR-5MS), supplied by Thermo Scientific® (Milan, Italy). The temperature of the injector port was 250 °C, and the temperature of the interface was 280 °C. The oven ramp was set to initialize at 90 °C for 1 min, and then increase in 15 °C min-1 until reaching 250 °C, kept for 2 min and then, increasing again in 25 °C min-1 reaching up to 280 °C, kept for 2 min, with the whole process totaling approximately 17 min. The carrier gas (helium) was adjusted to a constant flow of 1.0 mL min-1. The mass spectrometer was operated via electron impact (EI). Qualification and quantification of ions were performed in the selected ion monitoring (SIM) mode, and they were chosen based on selectivity and abundance, in order to maximize the signal - noise in the extracts prepared. The selected ions (underlined quantification ions) are shown in Table 1.
Sample preparation Sample preparation was adapted from the method by Pego et al.21 and Toledo et al.22 A 6 cm hair segment was collected from the proximal to the distal region of the scalp. Then, the hair matrices were carefully stored by using aluminum foil and placed inside paper envelopes properly labeled with their respective reference numbers. This process is in accordance with the guideline Society of Hair Testing (SoHT).23,24 Initially, the capillaries segment collected were efficiently washed according to the process described by Tsanaclis and Wicks,25 and after drying, the samples were weighed for duplicates (100 mg). Then, the samples was cleaned with neutral detergent and water and then with dichloromethane (2.0 mL for every 50 mg of hair), for 15 minutes at 37 °C, in a water bath. After that, dichloromethane was removed and the sample remained at room temperature. The hair strands were cut into small pieces and, then, 50 mg aliquots were separated in Falcon tubes, with 2.0 mL of methanol together with internal standards (2.5 ng mg-1 of BZE-d3 and 10 ng mg-1 of COC-d3). The tubes were incubated at 50 °C for 18 hours. The entire volume of methanol was transferred to a glass bottle (4.0 mL) and the content was led to evaporation at 50 °C, in water bath. The residue was obtained underwent derivatization with 100 µL of acetonitrile, 2.0 µL of pyridine and 2.0 µL of isobutyl chloroformate in ultrasonic bath for 6 min (Figure 2). After that, 1.5 mL of deionized water was added to the bottle, which was agitated by a vortex mixer. All the volume was transferred to an Eppendorf tube containing 30 mg mix (NaHCO3:K2CO3, 2:1 w/w), and agitated by a vortex mixer to obtain the pH between 9 and 10. Finally, the solutions were prepared by applying the HF-LPME technique.
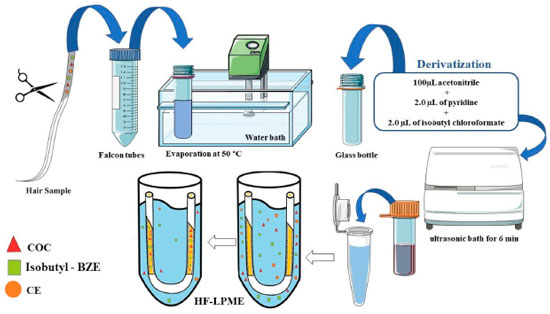 Figure 2. Sample preparation process showing the washing, derivatization and HF-LPME for COC, Isobutyl-BZE and CE
The polypropylene hollow fiber (9 cm) was immersed in organic phase (dihexyl ether) and the system was poured five times. Then, the fiber lumen was filled in with HCl 0.05 mol L-1 (50-70 µL) (acceptor phase) and the edges of the fiber were sealed and placed into the solution of the Eppendorf tube. The system was transferred to ultrasonic bath, where it remained for 10 minutes, for analytes extraction from the aqueous solution through an organic solvent migrating to the acceptor solution. This process is specific and selective, since the analytes are in a more ionized state (lumen fiber) and do not return to the aqueous solution. The extract was taken from inside the fiber and evaporated in water bath (40 °C). In order to carry out the analysis in GC-MS, the samples were resuspended in 50 µL of ethyl acetate and 1.0 µL was injected into GC-MS.22 Case samples A total of 14 authentic hair samples were obtained from patients admitted to a rehabilitation clinic. Along with sample collection, the donors were interviewed for collecting data, such as age at the moment of the interview, the age at which they started making use of the drugs previously mentioned, rehabilitation period, types of drugs consumed and consumption pattern. The criteria of positivity were: COC ≥ 0.5 ng mg-1 and CE or BZE ≥ 0.05 ng mg-1 (Society of Hair Testing).24 Hair samples free from the drugs (COC, BZE e CE) were provided by volunteers who are nonusers. The study was approved by the Ethics Committee for Research on Human Beings from the State University of Maringá (number 458.185). All the participants signed an informed consent form. Validation procedure The method described was validated in accordance with the guidelines of the Scientific Working Group for Forensic Toxicology (SWGTOX),26 Society of Hair Testing24 and the United Nations Office on Drugs and Crime (UNODC).27 A validation protocol was followed, comprising parameters such as selectivity, linearity, limit of detection, limit of quantification, precision, accuracy, matrix effect and carryover. Selectivity The selectivity test was evaluated through the analysis of ten blank hair samples (with no standards addition) and two zeros (blank samples with the addition of internal standards).24 The presence or absence of any interfering peaks (endogenous substances), at a significant level, close to the retention time of the analytes and the internal standard were evaluated.26 Linearity Linearity of the method was stablished in hair samples. Working range of 0.1 to 20 ng mg-1 for COC and 0.05 to 5 ng mg-1 for BZE and CE were used. The analyses of six different concentrations, within the range stablished, were carried out in five repetitions. Calibration curves of the analytes were obtained by correlation between the signal response (area ratio of the analyte peak and the internal standard) and analyte concentration in the sample.26 Acceptance criteria include the correlation coefficient (r) above 0.99. Evaluation of the homoscedasticity of the calibration model was carried out through the Lack of Fit test (significant level of 5%), with the statistical software Minitab®18.26,27 Limit of detection (LoD) and limit of quantification (LoQ) Determination of LoD and LoQ were obtained by fortifying three different blank hair samples analyzed in triplicate. LoD was defined as the lowest concentration capable to produce a reproducible response of the instrument, three times higher (or more) than the noise level of the background signal of the blank samples, and to reach predefined detection criteria. The LoQ estimated was considered to be the lowest concentration capable of obtaining detection, identification, accuracy and precision criteria in all the three fortified samples. Intra-day and inter-day precision and accuracy Intra-day precision and accuracy were evaluated through the analysis, on the same day, of five replicates (n=5) of blank (hair) samples enriched with the analytes (COC, BZE e CE) in three (3) control levels, a low control (0.3 ng mg-1 of COC, 0.15 ng mg-1 BZE and CE), medium control (10 ng mg-1 of COC and 2.5 ng mg-1 of BZE and CE) and high control (16 ng mg-1 of COC and 4 ng mg-1 of BZE and CE). Inter-day accuracy and precision were evaluated during three consecutive days, in five repetitions. Accuracy and precision together determine the total error of the analysis. Precision was calculated by using the coefficient of variation (% CV). Accuracy was determinated by the comparison between the quantified and the enrichment concentration at each control level, and should be expressed as a percentage (%). The acceptance criterion for both parameters was ≤ ± 15% for all concentrations, except at the LoQ, in which ≤ ± 20% was accepted. Matrix Effect Test solutions (without adding hair matrix) containing the internal standards and the analytes at six different concentrations (identical to the calibration curve) were extracted and performed in triplicate. The values obtained were compared to those obtained by the triplicate of the calibration curve (with the addition of a hair matrix). The significant difference in all slopes of the linear curves was evaluated by the p-value. As acceptance criterion has been considered p-value > 0.05, proving parallelism of the lines and absence of constituents of the matrix that could interfering in the analysis. The statistical test performed was Student's t test, using the Minitab®18 software. Carryover For the analysis of the carryover, three injections of a single blank sample was analyzed, one of them before and two others after the injection of a sample at the highest point of the calibration curve. The results of the blank sample injections were compared with those obtained from the LoQ.
RESULTS AND DISCUSSION All validation parameters were considered to be satisfactory, according to international guidelines. The method was selective and no detect interference peaks was observed close to the three retention times of the selected analytes, neither with the retention times of the internal standards, according to blank sample, illustrated in Figure 3.1.
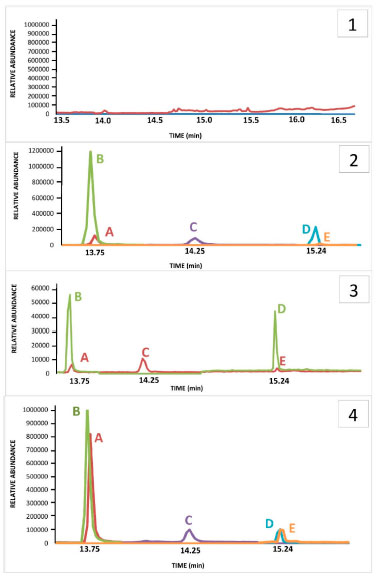 Figure 3. Chromatograms GC-MS obtained from HF-LPME in hair samples. Where: 1) Blank sample 2) LOQ quantification ions chromatogram: A- COC (m/z 182); B- COC-d3 (m/z 185); C- CE (m/z 196); D- BZE isobutyl ester-d3 (m/z 227); E- BZE isobutyl ester (m/z 224). 3) LOQ confirmation ions chromatogram: A- COC (m/z 272); B- COC-d3 (m/z 275); C- CE (m/z 272); D‑ BZE isobutyl ester-d3 (m/z 275); E- BZE isobutyl ester (m/z 272). 4) Authentic sample chromatogram: A- COC (m/z 182); B- COC-d3 (m/z 185); C- CE (m/z 196); D- BZE isobutyl ester-d3 (m/z 227) and E- BZE isobutyl ester (m/z 224). Results of the concentrations found for all analytes were: COC - 8.5 ng mg-1, CE - 0.6 ng mg-1 and BZE - 2.1 ng mg-1
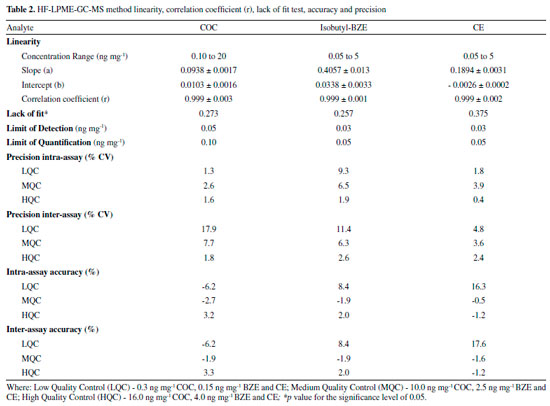
Figure 3.2 and 3.3 shows the chromatograms obtained from the lowest calibration point, referring to the LoQ (0.1; 0.05, 0.05, 2.5 and 10 ng mg-1 for COC; BZE isobutyl ester; CE; BZE isobutyl ester-d3 and COC-d3 respectively). LoD values achieved for HF-LPME-GC-MS were 0.05; 0.03 and 0.03ng mg-1 for COC, BZE and CE, respectively (Table 2).
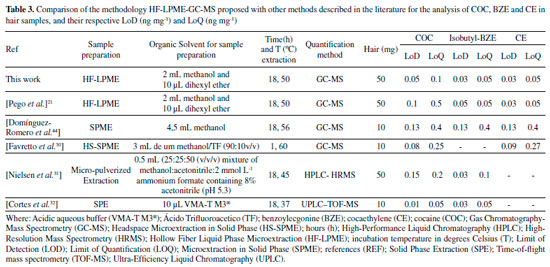
This method showed to be linear, within all the linear curve adopted for the analytes with a correlation coefficient (r) above 0.99. According to recommendations by the Society of Hair Testing (SoHT), the LoQ was deemed to be adequate for this study, since the cut off value for COC and its biotransformation products in hair is 0.5 ng mg-1 and 0.05 ng mg-1, respectively.27 Most of the values found in this study were lower, and therefore better, when compared to other studies.21,22 Homoscedasticity was determined by the Lack of Fit test for evaluating the presence of any abnormal value in the residues and verifying the model adjustment. Lack of Fit (p value) was superior to 0.05, indicating that well-adjusted models were obtained for all analytes (Table 2). Both intra-day and inter-day precision met the criteria established by international guidelines. The coefficients of variation (% CV) obtained were lower than 15% for all concentrations analyzed, except for inter-day precision of the low control (0.3 ng mg-1) of the analyte COC, in which value obtained was higher than 15% (17.86%). However, the guidelines allow values lower than 20% for such concentration.26 Besides, this quality control is lower than the cut off (0.5 ng mg-1) for the analyte in question, and it is not a reference value for drugs consumption. Additionally, intra-day accuracy values ranged from -6.2 to 16.3%, and inter-day accuracy varied from -6.2 to 17.6%. The highest precision and accuracy values refer to CE, and that is probably due to the fact that it was the only substance without an isotopic standard of the analyte itself, since COC-d3 was used. LoD and LoQ obtained by this study can also be considered satisfactory. This data is even more noticeable when compared to analytical methodologies published by other authors, in the same biological matrix and with the same analytes analyzed, as shown by Table 3.21,28-32 In one of these studies, which was carried out through Headspace Solid Phase Microextraction (HS-SPME) and GC-MS, the LoD values obtained were 0.08 ng mg-1 for COC and 0.09 ng mg-1 for CE.29 In another study using HS-SPME-GC-MS, the LoD found for COC and CE were 0.13 ng mg-1 and the LoQ was 0.25 ng mg-1 for COC and 0.27 ng mg-1 for CE,33 that is, higher than the technique performed by our study.
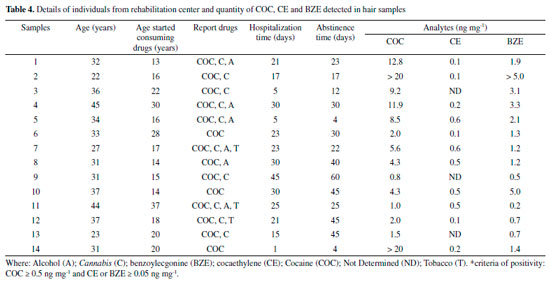
The study of the matrix effect was carried out, even though it is not usual in techniques that are similar to the one in this study.21,34 It is an important parameter for comparing the parallelism of the linear straight lines, done in the test solution without the hair matrix and in the hair matrix. The matrix effect obtained from comparing parallelism of the linear curves (sample and test) provided p values (with 5% significance) of 0.955; 0.729 and 0.852 for COC, BZE and CE, respectively. The p values achieved, through statistical analysis, were higher than 0.05, proving the absence of interference by the matrix constituents, thus confirming the parallelism of linear curves. In other words, the HF-LPME was important to prevent matrix interferences from reaching the extracts analyzed, demonstrating the high efficiency of the cleaning procedure used. In addition, the method developed did not show carryover, because there were no peaks in time retention of the analytes when blank samples was injected right after the highest calibration point. In the study carried out by Pego et al.21 using a similar methodology of extraction and quantification, the LoQ values observed for BZE and CE were identical to this study. In the Table 3, it is possible to see that the LoQ and LoD values of the present method were lower or equal to those found by other authors. The only exception was the study by Nielsen et al.,31 in which the LoQ values for COC and BZE were slightly lower. Nonetheless, the authors did not carry out the determination of the CE metabolite. The HF-LPME technique has advantages such as simple operation and low volume of organic solvents (microscale), as well as SPE and SPME, and relatively low-cost hollow fiber.35-38 However, there is a difficulty in automation, which does not happen with SPE. The disadvantages of SPE are high cartridge costs as well as the need for conditioning steps. For SPME, as well as SPE, besides the cartridges are expensive, they are fragile and require equipment of high value (inline).39-41 Therefore, the method propose achieved preferable sensitivity levels, with a derivatization process that makes minimal use of organic solvents and a small quantity of biological samples, which makes it an appropriate option for routine application in laboratories of toxicological analyses. In addition, our work proposes the use of GC-MS, present in most laboratories. The HF-LPME methodology for the extraction of COC analytes and their biotransformation products in hair matrix, developed with 10 min ultrasound agitation and derivatization performed by the isobutyl chloroformate, was thoroughly validated in accordance with international guidelines.24,26,27 This procedure makes the method applicable to toxicological routine. HF-LPME was used in this study aiming at additional purification of the hair extracts obtained by incubation with methanol. This process is important due to the fact that the methanol extracts show a high degree of contamination of the capillary matrix.42 The HF-LPME is advantageous because it is not an exhaustive extraction technique such as Liquid-Liquid Extraction (LLE) or Solid Phase Extraction (SPE), and it does not demand any stage of centrifugation or filtering. Furthermore, the aforementioned technique allows analytes selection through the fiber in solution, thus, minimizing errors, which was demonstrated by the validation parameters. On top of that, hollow fibers can be discarded after each extraction due to its low cost, compared to SPME21, thus avoiding the presence of residues between analyzes. Hair incubation aiming at liberation of the analytes is due to the hydrophilic characteristic of methanol, which penetrates the strand of hair, leading to swelling, substances liberation through diffusion and dissolution of neutral and lipophilic composites.43 Moreover, methanol is a solvent that evaporates easily, which is helpful for derivatization, stage that demands the obtaining of a dry residue, once the derivatization process of BZE was not successful when directly applied to aqueous solution.22 The extraction using methanol for the determination of COC, BZE and CE has been done in other studies.28,44,45 The derivatization process is often necessary for drugs analyses by GC-MS, and is commonly performed after the extraction procedure, where a variety of reagents is used. However, in miniaturized extraction techniques, such as HF-LPME and SPME, the derivatization occurs before extraction, which can increase the sensitivity of detection of the derivatized BZE, from these miniaturized methods.21,22 Butylchloroformate has been the main derivatization reagent used in these studies, its capable of remaining stable under aqueous conditions, guaranteeing a satisfactory result of derivatization before the procedure of HF-LPME21 or by SPME.22 In the present study, we used a similar reagent, isobutyl chloroformate, because it was available in our laboratory. It was used for the first time in COC and biotransformation products analyzes by HF-LPME-CG-MS. Despite the structural difference of the molecule (addition of methyl to butylchloroformate), the derivatization process proved to be fast and effective, increasing sensitivity of the method for BZE. In this process, it had the derivatization of the BZE analyte into isobutyl benzoylecgonine. Isobutyl chloroformate causes a reaction in contact with the carboxylic acid contained in BZE, creating an anhydrous mixed derivative of BZE, that undergoes decarboxylative esterification in order to produce a volatile final composite named isobutyl-BZE, which can be identified by GC-MS. Pyridine acts in the reaction as a catalyst. The final compost is, therefore, less polar, since the process modifies the functional groups of the BZE molecule, with the purpose of increasing its volatility and, consequently, improving its stability. That way, there is greater efficiency in the separation of the chromatographic peaks, resulting in a greater response in the MS detector.33,46,47 HF-LPME is a balanced extraction technique in which a concentration of analyte in the acceptor solution increases up to a certain level and, subsequently, the system comes into balance.43 In order to make this happen, the HF-LPME system underwent an agitation process, commonly performed by a horizontal multi-tube shaker during 10 minutes at 2400rpm.21 In the present study, this process was done in an ultrasound device, at the time lengths of 5, 10 and 15 minutes. The best time (10 min) was selected for the analyses. The use of an ultrasound device is an advantage for the methodology propose, once it is more easily found at toxicology laboratories, when compared to horizontal multi-tube shaker, which are more specific and costly. In this study, HF-LPME takes place in triphasic mode. The analytes are extracted from the aqueous solution (sample inside the Eppendorf) through a liquid membrane (organic solvent - dihexyl ether) sustained in its pores on the wall of a porous hollow fiber, migrating to the acceptor solution (acid solution), present in the fiber lumen, as illustrated in Figure 2. To ensure that the extraction of the analytes had been happen in an efficient way, the pH sample was increased (pH between 9 and 10). A reagent mix (NaHCO3: K2CO3) was added for the analytes would remain in molecular form (non-ionized), allowing them to pass through the hollow fiber pores. Then, in the fiber lumen (acid solution), they acquire the ionized form, and so are retained in there.42 After validation of the HF-LPME-GC-MS analytical method, analyses were carried out for research of COC and biotransformation products in hair samples from patients admitted to a rehabilitation clinic. The donors' average age was 33±6 years. The age when they started consuming drugs ranged from 13 to 37 years old (Table 4).
Table 4 presents the concentrations of all analytes found in the 14 samples analyzed, which were positively confirmed for COC and BZE. Only three samples were not positive for CE, which matches the reports by these patients, who stated not to consume alcohol and cocaine simultaneously. Concentrations obtained for COC ranged from 0.8 to > 20 ng mg-1. Regarding BZE, concentrations varied from 0.2 to > 5 ng mg-1. The period during which they had been taking part of the rehabilitation program ranged from 1 to 45 days by the time they were interviewed. All the samples analyzed were provided by volunteers who claimed to have used cocaine along with other drugs. The interviewees stated to have made use of the drug (COC) for the last time between 4 and 60 days before the interview (Table 4). Therefore, in some samples, analytes presented concentrations that were high than the superior limit of quantification stablished within the method. For the CE analyte the highest values obtained were 0.6 ng mg-1. Figure 3.4 represents a positive result, in which the concentrations obtained were 8.5 ng mg-1, 0.6 ng mg-1 and 2.1 ng mg-1 for COC, CE and BZE, respectively. A study carried out by Gambelunghe et al.,34 applied to 90 hair samples, classified the use of cocaine at mild (0.5-3 ng mg-1), moderate (3.1-10 ng mg-1) and severe (10.1-40 ng mg-1). According this classification, at the present study 5 samples were fit at mild use, 5 classified within the moderate category, and 4 in the severe use class. This information can be usseful in the treatment process, as care must be intensified in chronic users classified as moderate and severe. The individuals who claimed early and continuous uses showed greater concentrations of COC, thus proving that hair samples are an adequate biological matrix for analyzing drugs. Moreover, the data collected had been available for use at the rehabilitation facility so as to assist in the treatment of chemical dependents. The use of hair sample over conventional samples is preferable due to the fact that its collection is simple, the procedure is not invasive, and, in forensic situations, it can be done under strict supervision so as to avoid adulteration and samples replacement.8,9 Treatments provided by rehabilitation clinics can benefit society and support the rehabilitation of chemical dependents, as well as help to control and, eventually, overcome addiction. It is evident that chemical dependency treatments combined with monitoring the use of drugs are pivotal. Thereby, the interview conducted in rehabilitation clinics, associated with drug analysis, is a means by which the profile of the interned patient can be known, as example, at what age the patient started the consume of drugs and which drugs are the most used. These allowing devising prevention strategies to minimize relapse or even prevent the death of users.
CONCLUSIONS The HF-LPME-GC-MS miniaturized technique, evaluated and thoroughly validated, allowed the detection and simultaneous quantification of COC and its biotransformation products (BZE and CE) in hair samples. The analysis methodology proposed showed high sensitivity, adequate precision and accuracy, and no matrix effect interference or carryover. In addition, it allowed the use of a reduced volume of organic solvents and biological sample. Furthermore, the HF-LPME technique had a low execution cost compared to other miniaturized techniques, such as SPME. The derivatization stage evaluated favored the use of a small amount of the derivatizing solution, and it is a fast process done prior to the HF-LPME. The application of this method is, therefore, adequate, and it is an important tool for routine use at toxicology laboratories. Analyses of COC and its biotransformation products through HF-LPME-GC-MS in hair samples can be carried out for forensic purposes, control of drugs consumption by dependents who seek rehabilitation, criminal investigations and also for controlling the use of drugs by vehicle drivers.
AKNOWLEDGEMENTS The authors gratefully acknowledge the Fundação Araucária de Apoio ao Desenvolvimento Científico e Tecnológico do Paraná [grant number 35197.406.32936.20112012], the Conselho Nacional de Desenvolvimento Científico e Tecnológico (CNPq) and the Coordenação de Aperfeiçoamento de Pessoal de Nível Superior - Brasil (CAPES) - for their financial support, as well as for granting the first author a scholarship. We also thank Prof. Dr. Maurício Yonamine, from Faculty of Pharmaceutical Sciences of University of São Paulo, for donating polypropylene hollow fibers, thus enabling this study.
REFERENCES 1. https://www.unodc.org/wdr2016/, accessed March 2021. 2. https://www.unodc.org/wdr2018/prelaunch/Pre-briefingAM-fixed.pdf, accessed March 2021. 3. https://www.gov.uk/government/publications/health-matters-preventing-drug-misuse-deaths/health-matters-preventing-drug-misuse-deaths, accessed March 2021. 4. Harrison, R.; Fu, S.; J. Forensic Invest. 2014, 2, 8. 5. Mantinieks, D.; Gerostamoulos, D.; Wright, P.; Drummer, O.; Forensic Sci. Med. Pathol. 2018, 14, 349. 6. Suárez-García, A.; Álvarez-Freire, I.; Bermejo-Barrera, A. M.; Cabarcos Fernández, P.; Tabernero-Duque, M. J.; Microchem. J. 2019, 104335. 7. Barroso, M.; Gallardo, E.; Queiroz, J.; Bioanalysis 2009, 1, 977. 8. Kintz, P.; Forensic Sci. Int 2004, 142, 127. 9. Madry, M. M.; Steuer, A. E.; Hysek, C. M.; Liechti, M. E.; Baumgartner, M. R.; Kraemer, T.; Anal. Bioanal. Chem. 2016, 408, 545. 10. Moreda-Piñeiro, J.; Moreda-Piñeiro, A.; Trends Anal. Chem. 2016, 71, 265. 11. Pragst, F.; Balikova, M. A.; Clin. Chim. Acta 2006, 370, 17. 12. Moreau, R. L.; De, M.; Siqueira, M. E. P. B.; Ciências Farmacêuticas: Toxicologia Analítica; Editora Guanabara Koogan, Rio de Janeiro, 2016. 13. Meng L.; Zhang,W.; Meng, P.; Zhu, B.; Zheng, K.; J. Chromatogr. B 2015, 989, 46. 14. de Jager, L. S.; Andrews, A. R. J.; The Analyst 2001, 126, 1298. 15. Kramer, K. E.; Andrews, A. R. J.; J. Chromatogr. B 2001, 760, 27. 16. Pedersen-Bjergaard, S.; Rasmussen, K. E.; Brekke, A.; Ho T. S.; Halvorsen, T. G.; J. Sep. Sci. 2005, 28, 1195. 17. Xiong, J.; Chen, J.; He, M.; Hu, B.; Talanta 2010, 82, 969. 18. Bagheri, H.; Zavareh, A. F.; Koruni, M. H.; J. Sep. Sci. 2016, 39, 1182. 19. de Jager, L.; Andrews A. R. J.; Anal. Chim. Acta 2002, 458, 311. 20. Emidio, E. S.; Prata, V. M.; Santana, F. J. M.; Dórea, H. S.; J. Chromatogr. B 2010, 878, 2175. 21. Pego, A. M. F.; Roveri, F. L.; Kuninari, R. Y.; Leyton, V.; Miziara, I. D.; Yonamine, M.; Forensic Sci. Int. 2017, 274, 83. 22. Toledo, F. C. P.; Yonamine, M.; Moreau, R. L. M.; Silva, O. A.; J. Chromatogr. B 2003, 798, 361. 23. https://www.sbtox.org/, accessed March 2021. 24. Cooper, G. A. A.; Kronstrand, R.; Kintz, P.; Forensic Sci. Int. 2012, 218, 20. 25. Tsanaclis, L.; Wicks, J. F. C.; Forensic Sci. Int. 2008, 176, 19. 26. SWGTOX; J. Anal. Toxicol. 2013, 37, 452. 27. https://www.unodc.org/documents/scientific/validation_E.pdf, accessed March 2021. 28. Aleksa, K.; Walasek, P.; Fulga, N.; Kapur, B.; Gareri, J.; Koren, G.; Forensic Sci. Int. 2012, 218, 31. 29. Merola G.; Gentili, S.; Tagliaro, F.; Anal. Bioanal. Chem. 2010, 397, 2987. 30. Favretto, D.; Vogliardi, S.; Stocchero, G.; Nalesso, A.; Tucci, M.; Ferrara, S. D.; J. Chromatogr. A 2011, 1218, 6583. 31. Nielsen, M. K.; Johansen, S. S.; Dalsgaard, P. W.; Linnet, K.; Forensic Sci. Int. 2010, 196, 85. 32. Cortes, L.; Almeida, L.; Sabra, S.; Muniesa, M.; Busardo, F. P.; Garcia-Algar, O.; Gomez-Roig, M. D.; Curr. Pharm. Biotechnol. 2018, 19, 136. 33. Ruiz-Matute, A. I.; Hernández-Hernández, O.; Rodríguez-Sánchez, S.; Sanz, M. L.; Martínez-Castro, M.; J. Chromatogr. B 2011, 879, 1226. 34. Gambelunghe, C.; Rossi, R.; Aroni, K.; Gili, A.; Bacci, M.; Pascali, V.; Fucci, N.; Drug Test. Anal. 2017, 9, 161. 35. Mafra, G.; Birk, L.; Scheid, C.; Eller, S.; Brognoli, R.; de Oliveira, T. F.; Carasek, E.; Merib, J. J. Chromatogr. A 2020, 1621, 461088. 36. Meng, L.; Zhang, W.; Meng, P.; Zhu, B.; Zheng, K.; J. Chromatogr. B 2015, 989, 46. 37. Lopes, D.; Dias, A. N.; Merib, J.; Carasek, E.; Anal. Chim. Acta 2018, 1040, 33. 38. Bedendo, G. C.; Jardim, I. C.; Carasek, E.; J. Chromatogr. A 2010, 1217, 6449. 39. Semenov, S. N.; Pawliszyn, J.; Koziel, J. A.; J. Chromatogr. A 2009, 873, 39. 40. Bojko, B.; Cudjoe, E.; Gómez-Ríos, G. A.; Gorynski, K.; Jiang, R.; Reyes-Garcés, N.; Risticevic, S.; Silva, É. A. S.; Togunde, O.; Vuckovic, D.; Pawliszyn, J.; Anal. Chim. Acta 2012, 750, 132. 41. Bessonneau, V.; Boyaci, E.; Maciazek-Jurczyk, M.; Pawliszyn, J.; Anal. Chim. Acta 2015, 856, 35. 42. Pedersen-bjergaard, S.; Rasmussen, K. E.; J. Chromatogr. A 2008, 1184, 132. 43. Pragst, F.; Balikova, M. A.; Clin. Chim. Acta 2006, 370, 17. 44. Domínguez-Romero, J. C.; García-Reyes, J. F.; Molina-Díaz, A.; J. Chromatogr. B 2011, 879, 2034. 45. Cappelle, D.; Doncker, M. D.; Gys, C.; Krysiak, K.; De Keukeleire, S.; Maho, W.; Crunelle, C. L.; Dom, G.; Covaci, A.; van Nuijs A. L.; Neels, H.; Anal. Chim. Acta 2017, 960, 101. 46. Penteado, J. C. P.; Magalhães, D.; Masini, J. C.; Quim. Nova 2008, 31, 2190. 47. Montero, C. M.; Dodero, M. C.; Sanchez, D. A. G.; Sanchez, C.; Barroso, G.; Chromatographia 2004, 59, 15. |
On-line version ISSN 1678-7064 Printed version ISSN 0100-4042
Qu�mica Nova
Publica��es da Sociedade Brasileira de Qu�mica
Caixa Postal: 26037
05513-970 S�o Paulo - SP
Tel/Fax: +55.11.3032.2299/+55.11.3814.3602
Free access


