
 |
 |
 |
 |
 |
Artigo
| Investigation of the impact of natural antioxidants found in coffee leaves, yerba mate, and jambolan pulp on the induction period and rate constant of biodiesel oxidation reaction in the presence of metallic ions |
|
Isadora G. BrancoI; Julia W. CamposI; Eduardo G. de SousaI; Nathan F. SilvaI; José Gonçales FilhoI; Elis PauliI; Érica S. RomagnoliI; Ana C. G. MantovaniII I. Departamento de Química, Universidade Estadual de Londrina, 86057-970 Londrina - PR, Brasil Received: 08/08/2024 *e-mail: dborsato@uel.br The present study describes the antioxidant potential of ethanolic extracts of yerba mate (Ilex paraguariensis), coffee leaves (Coffea arabica) and jambolan pulp (Syzygium cumini Lamarck) when added to biodiesel, with and without chromium (Cr3+), manganese (Mn2+) and cobalt (Co2+) metal ions, measuring the induction period (IP) and the rate constant (k) of the oxidation reaction at 110 ºC. Antioxidant activity was observed in all extracts, as they reduced k and increased the IP compared to the control sample. The coffee leaves extract had the most pronounced positive effect, increasing the IP to 12.42 h and reducing k by 5.9 times. However, biodiesel containing metallic ions of chromium, manganese and cobalt, both with and without natural extracts, reduced the IP in all assays conducted in this study. The natural yerba mate extract was the most affected by the manganese ion (Mn2+), reducing the IP by 41.61%. The chromium ion (Cr3+) had the least impact on the biodiesel oxidation process in the presence of coffee leaves extract, increasing the rate constant by 3.55%. Furthermore, the alcoholic jambolan pulp extract was the one that presented the best antioxidant properties in the presence of metal ions. INTRODUCTION Fossil fuels are energy resources formed from organic matter deposited and subjected to pressure and heat over millions of years. The most commonly utilized sources of energy derived from fossil fuels include coal, petroleum, and natural gas. However, their excessive use has led to significant environmental implications. The combustion of fossil fuels releases greenhouse gases, which contribute to air pollution and severe climate changes, including an increase in the global average temperature.1,2 In response to these concerns, there has been an increasing interest in transitioning towards clean and sustainable energy sources, such as solar, wind, hydroelectric renewable energies, as well as the pursuit of more efficient technologies and energy storage solutions.3,4 Among renewable energy sources, biodiesel has stood out. It is defined as a mono-alkyl ester of fatty acids, produced through the transesterification reaction of vegetable oils, animal oils and fats, or both, with an alcohol, usually methanol, using a strong base as a catalyst.5,6 Despite biodiesel generating less energy compared to petroleum diesel, it excels in several key aspects. These include improved lubricity; power and torque performance comparable to fossil fuels; better preservation of engine moving parts; higher combustion efficiency; and, most importantly, a significant reduction in the emission of aromatics and sulfur oxides into the atmosphere.5,7 Various raw materials can be used in biodiesel production, including soybean oil,8 palm oil,9 canola oil,10 sunflower oil,9 animal fats,11 and used cooking oils,12 among others. Every oilseed can produce alkyl esters, but not every oil or fat is recommended for producing commercial biodiesel in compliance with government regulations. A key factor in selecting the raw material is the amount of oil that can be extracted, therefore, sources rich in oil content are preferred in the biodiesel industry to reduce production costs. The fatty acid composition of the raw material used in the biodiesel production process can introduce undesirable characteristics, especially due to the unsaturations present in the fatty acids of vegetable oils and fats.13 Due to the esters derived from fatty acids and their double bonds in their carbon chains, biodiesel has compromised oxidative stability, particularly when exposed to light, high temperatures, humidity, and transition metal ions.9 According to Chendynski et al.,14 the oxidation of the biofuel is influenced not only by the quantity of unsaturations within the carbon chain but also by their specific location in the structure. For instance, the bis-allylic site is particularly susceptible to free radical formation which, in the presence of oxygen, facilitates the formation of peroxides. Aspects like these are relevant to understanding the instability of the bis-allylic site.9,15 The presence of transition metals in non-aqueous systems favors the formation of peroxides and new free radicals, accelerating its oxidation.14,16 As a result of the oxidation reaction, catalyzed by exposure to light, temperature, metal ions, humidity, or microbial contamination, biodiesel usage can lead to significant economic and technical impacts. These include corrosion of engine parts and the formation of deposits, which can compromise the efficiency of the vehicle's injection system.17 In addition to the biodiesel quality issue, oxidative degradation alters the physicochemical properties either during vehicle use or storage.18 Density, flash point, oxidation stability, and cetane index, along with values for iodine number, kinematic viscosity, peroxide index, and acidity, can be affected.19,20 For the commercialization of biodiesel, antioxidants are used to increase the induction period (IP), delay degradation, and extend the storage period.21 The use of synthetic antioxidants such as butylated hydroxyanisole (BHA), butylated hydroxytoluene (BHT), tert-butylhydroquinone (TBHQ), among others, has been an effect method to control the biodiesel oxidation process.22 However, natural extracts with antioxidant properties have gained prominence due to their wide range of sources, renewability and lower cost compared to synthetic alternatives, making them an excellent alternative to synthetic antioxidants.13 Coppo et al.22 demonstrated that a mixture containing 25% ethanolic extract of rosemary and 75% ethanolic extract of oregano was more effective than using each of them separately to delay the biodiesel oxidation process obtained from soybean oil. Gregório et al.23 showed an increase in the activation energy required for biodiesel oxidation in the presence of ethanolic extracts of sage and coffee leaves, either alone or in combination. Romagnoli et al.24 studied the influence of extracts from senna leaves, blackberries, and hibiscus flowers on the oxidation reaction of commercial biodiesel. Chendynski et al.25 evaluated and applied ethanolic extracts of rosemary leaves, araçá pulp, and bacuri peel to inhibit the oxidation reaction of biodiesel. Clemente et al.,26 using mathematical modeling, estimated the storage time of biodiesel at room temperature in a mixture with ethanolic extracts of jabuticaba peels, guava leaves, and hibiscus flowers, in the absence and presence of copper and iron ions, showing that natural extracts are a viable alternative to synthetic substances to delay the biodiesel oxidation reaction and to increase its storage time. The present study analyzed the antioxidant potential of ethanolic extracts from coffee leaves, yerba mate, and jambolan pulp in biodiesel, in the absence and presence of chromium (Cr3+), manganese (Mn2+), and cobalt ions (Co2+).
EXPERIMENTAL Biodiesel production The triglyceride transesterification reaction was conducted with 50% of palm oil (S.S. Moratto Comércio de Insumos, São Paulo, SP, lot SE-0518/25672) and 50% of soybean oil (Coamo®, lot 423058, Campo Mourão, PR), combined with absolute methanol (FMaia, PA 99.8%, Belo Horizonte, MG) and potassium hydroxide (Cinética, 95%, Itapevi, SP) as the reaction catalyst. A concentration of 0.8 g of KOH was used in 100 g of triglycerides in 50 mL of methanol, heating to 60 ºC under reflux with stirring for 2 h. Afterward, the phases were separated using a separation funnel. The biodiesel underwent a two-stage washing process: initially, in a separation funnel with 1% w/w aqueous hydrochloric acid solution, followed by water at 80 ºC until a neutral pH was achieved. Then, the biodiesel was dehumidified using anhydrous Na2SO4 (Anidrol, 99%, Diadema, SP). For the drying process, the anhydrous sodium sulfate was first heated in the oven at 120 ºC for 1 h. Dry sodium sulfate was then added to a 500 mL beaker containing the previously washed biodiesel and allowed to rest for 1 h. Finally, the biodiesel-sulfate mixture was vacuum filtered to obtain the biodiesel used in this study. Physical and chemical characterization of biodiesel The density (20 ºC) was determined according to the ASTM D4052 method; the flash point by the ASTM D93 method; kinematic viscosity (40 ºC) by the ASTM D445 method; acid number by the ASTM D664 method; water content by the ASTM D6304 method; cloud and pour point by the ASTM D2500 method; iodine value by the EN14111 method.27 Chromatographic analysis of biodiesel (GC-MS) As described by Romagnoli et al.,24 to evaluate the concentrations of methyl esters, present in biodiesel samples, a mass of 0.0200 g was precisely weighed on an analytical balance and placed into Eppendorf tubes. To this, 500 µL of standard solution of tricosanoic acid methyl ester (C23:0) was added (Sigma-Aldrich, 99.0%, São Paulo, SP) with a concentration of 1.0 mg mL-1 in heptanes (Sigma-Aldrich, 99.0%, São Paulo, SP). After stirring, 2 µL of the mixture was injected into a Shimadzu GC2010 Plus chromatograph (Kyoto, Japan), coupled to a QP2010 Ultra mass detector. The analysis was performed under the following conditions: RESTEK-RT2560 fused silica chromatographic column (100 m, 0.25 mm and 0.20 μm i.d., 100% non-alloyed bis cyanopropyl polysiloxane) with a He gas flow rate automatically determined by the device, based on the injection conditions and column properties, with a line pressure of 110 kPa, a He flow rate of 17.1 mL min-1, and a pressure of 0.28 kPa; the column exhibited a linear flow of 11.1 mL min-1. The sample split ratio was set at 1:50, and the injector temperature was maintained at 240 ºC. The column was initially set at 190 ºC for 2 min then increased to 200 ºC at a rate of 2.0 ºC min-1, and maintained at this temperature for an additional 2 min. Subsequently, the temperature was raised again to 230 ºC at the same rate of 2.0 ºC min-1 and held steady for another 2 min. The interface temperature from the gas chromatograph (GC) to the mass spectrometer (MS) was consistently maintained at 240 ºC, while the detector was set at 200 ºC. The detector operated in SCAN mode, scanning a mass-to-charge ratio (m/z) range from 35 to 500. Scanning was initiated 15 min after the analysis started, optimizing detector performance and resulting in a total analysis time of 35 min. Peak areas were calculated using the Post Run Analysis software. The identification of methyl esters was established by comparing the retention times with those of known fatty acid from soybean oil samples using the Bibliotec software. Quantitative analyses were conducted in relation to the internal standard, methyl tricosanoate, ensuring accurate and reliable results. Natural extracts Alcoholic extracts of yerba mate (SisGen Registration A957A9), coffee leaves (SisGen Registration ABA1234) and jambolan (SisGen Registration A45BABD) were prepared. Yerba mate (81®, lot 113) was purchased at the Grupo Mufatto supermarket in the city of Londrina, PR. The coffee leaves and jambolan fruits were collected at the State University of Londrina, at different points, with the respective geographic coordinates (-23.327877, -51.200190) and (-23.328047, -51.197556). Samples of yerba mate, coffee leaves, and jambolan pulp were dried in an oven at 60 ºC. Subsequently, the dried samples were crushed and vacuum-sealed. For extract preparation, 10 g of dried and crushed samples were carefully weighed and mixed in a beaker containing 250 mL of absolute ethanol (Anidrol, 99.8%, Diadema, SP). Following the combination of the extracts with absolute ethanol, the beaker was tightly covered with plastic film, enveloped in aluminum foil, and stored in the darkness for 48 h. After a 48-h period, each extract was filtered through a glass funnel equipped with quantitative filter paper. Subsequently, the extract was subjected to concentration on a heating plate at 60 ºC until its volume was reduced to below 50 mL. The final volume of the condensed extract was transferred into a 50 mL volumetric flask, which was then filled to the mark with absolute ethanol. The flask was covered with aluminum foil to protect the contents and stored in a refrigerator for future use. Determination of phenolic compounds in extracts The quantification of the phenolic compounds in the prepared natural alcoholic extracts was conducted at the Laboratory of Chemometrics in Natural Sciences (LQCN/UEL) using UV-Vis spectrometry on Thermo Scientific equipment (model: Evolution 60), within the wavelength range of 760 nm, following the Folin-Ciocalteu method. The methodology of Kumazawa et al.28 was adapted for the concentrations of the analyzed extracts, the concentration of Folin's reagent (0.2 N), and for the sodium carbonate solution (7.5% w/w). Dilutions of the extracts were performed, and the volumes used were determined based on prior studies to ensure that the dilutions presented absorbance values within the limits of the analytical curve. The dilutions were prepared by transferring specific volumes of the alcoholic extracts into 50 mL volumetric flasks, then filling with absolute ethanol. Following thorough homogenization, the samples were incubated in darkness for one hour to ensure stability. After incubation, the samples were centrifuged to facilitate clear separation. Absorbance readings were taken, and the total phenol content was calculated. The results were expressed in milligrams of gallic acid equivalents (GAE) per gram of dry matter, as described by Romagnoli et al.29 Chromatographic analysis of alcoholic extracts by HPLC-PDA The chromatographic analysis was employed to analyze the chemical diversity within ethanolic extracts, enabling the physical separation and subsequent detection of the molecular absorption spectral profile in the ultraviolet and visible ranges, including phenolics compounds, chlorophyll, flavonoids, organic acids, anthocyanins, and their derivatives. For that, it was used a high-performance liquid chromatograph (HPLC) Thermo Scientific® Finnigan Surveyor 61,607 system coupled with a Plus Photodiode Array detector (PDA) (San Jose, USA), monitoring at 190 to 800 nm. Gradient elution occurred at a controlled temperature of 20 ºC and flow rate of 1000 μL min-1. The mobile phase solvent system consisted of ultrapure water (A) and acetonitrile (B), with a mode elution gradient from 10% B held constant during 5 min, 70% B between 5 and 25 min, held constant at 70% B from 25 to 40 min, 10% B between 40 and 45 min, and held constant at 10% B during 5 min. The column used was ACE5 C18 (250 mm × 4.6 mm i.d., particle size: 5 µm), with an injection volume of 20 μL. The extract was diluted at a ratio of 1:100 in the initial mobile phase of the chromatographic run and filtered through a PTFE-20/25-0.20 µm membrane (Chromafil® Xtra). The methodology of Pauli et al.30 was adapted, and the data were processed using the ChromQuest 4.2 program. Chromatographic analysis of alcoholic extracts by UPLC-MS To complement the detection and identification of compounds present in the alcoholic extracts that were not detected by HPLC-PDA, UPLC-MS (ultra-performance liquid chromatography-mass spectrometry) analysis was employed, primarily focusing on identifying anthocyanins and their derivatives. The analyses were conducted using a Bruker Daltonics COMPACT QTOF mass spectrometer with positive ion polarity, a mass range of m/z 50 to 3000, coupled with a ultra-performance liquid chromatography (UPLC) system (Shimadzu), equipped with two high-pressure pumps (model LC-20AD), a UV detector (model UFLCSPD-20A), and an automatic sampler for GPC (gel permeation chromatography) or UPLC (model SIL-20AHT). Gradient elution was performed at a controlled temperature ranging from 20 to 60 ºC, with a flow rate of 0.1 mL min-1. The mobile phase solvent system consisted of ultrapure water (A) and acetonitrile (B), with a gradient elution mode: 10% B held constant for 5 min, 70% B between 5 and 25 min, held constant at 70% B from 25 to 40 min, 10% B between 40 and 45 min, and held constant at 10% B for 5 min. The column used was a KINETEX 5μ EVO C18 100A (100 mm × 4.2 mm i.d.) with an injection volume of 200 μL. The extract was diluted at a ratio of 1:100 in the initial mobile phase of the chromatographic run and filtered through a PTFE-20/25-0.20 µm membrane (Chromafil® Xtra). The methodology of Pauli et al.30 was adapted, and the data were processed using the DataAnalysis 4.3 software (Bruker). Sample preparation for induction period (IP) analysis As described by Clemente et al.,26 the biodiesel samples were individually prepared by adding Cr3+ (CrCl3.6H2O; Cinetica, 97%, Itapevi, SP), Mn2+ (MnCl2.4H2O; Vetec, 99%, Duque de Caxias, RJ) and Co2+ (CoCl2.6H2O; Biotec, 98%, Pinhais, PR) at a concentration of 2.49 × 10⁻⁵ mol of cation in 100 g of biodiesel, both with and without the addition of natural extracts. The ethanol in the extract was evaporated using a heating plate at 60 ºC prior to its addition to the biodiesel. For each 100 g of biodiesel samples, both with and without metals, 8.55 mL of yerba mate extract, 9.75 mL of coffee leaves extract and 18.3 mL of jambolan pulp extract were added individually corresponding to 42.8 mg GAE of each extract. These volumes were determined through prior experimental tests to ensure that each biodiesel sample had the same concentration of GAE with IP equal or greater than 8 h, which is the minimum value specified by the EN14214 standard.31 The ethanol was removed through evaporation using a heating plate at 60 ºC. Samples containing metallic ions were left to rest for 2 h before undergoing oxidative stability testing. The induction period, in triplicate, was analyzed in a Rancimat equipment, model 873, from Metrohm Instruments (Herisau, Switzerland), according to EN 14112 specifications.32 Rate constant (k) With the adjusted data of the natural logarithm (ln) of the electrical conductivity vs. time, provided by the accelerated oxidative stability test (EN 14112)32 at 110 ºC, the rate constants (k) were determined, considering the first order reaction, according to Equation 1.  where Λ is the electrical conductivity at time t; Λ0 is the initial conductivity, ti and tf correspond to the initial and final time, respectively. Statistical analysis The statistical parameters of the models, including the coefficients of determination (R2), applied in the data adjustment of the natural logarithm (ln) of the electrical conductivity vs. time, and the analysis of variance (ANOVA) were calculated using the Statistica software v.13.4.0.33
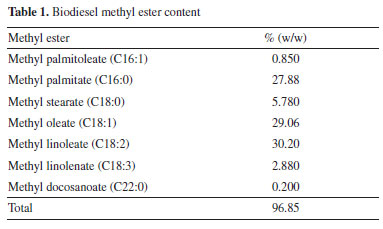
RESULTS AND DISCUSSION Biodiesel was produced through the transesterification reaction of a mixture containing equal parts of soybean and palm oils, using mathanol and potassium hydroxide as catalyst. Chromatographic analysis (GC-MS) revealed that the biodiesel used in the present study consists of methyl esters, with composition ranging from C16 to C22 (Table 1). The saturated fatty acid methyl ester content corresponds to 33.86% w/w of the biodiesel sample, while the unsaturated ones accounted for 62.99% w/w.
The biodiesel used presented average flash point of 176.7 ± 4.46 ºC, which increased to 185.7 ± 5.19 ºC with the adition of the extract. The Tukey test applied to the means showed no significant difference at the 5% level between the means of the flash point values, indicating that the addition of the extract did not significantly influence this parameter. It had specific mass at 20 ºC of 874.2 kg m-3, an acid number of 0.059 ± 0.017 mg KOH g-1, a cloud point of 10 ºC, a pour point of 5 ºC, a water content of 182.3 mg kg-1, a viscosity of 4.31 mm2 s-1 and an iodine value of 97.23 g I2 100 g-1.27 The assays demonstrate compliance within the specification parameters for B100 biodiesel according to current legislation specified in Brazilian Resolution 920.34 The ethanolic extracts of coffee leaves, jambolan pulp and yerba mate were analyzed for their total phenolic content using the Folin-Ciocalteu method. The results, expressed in mg of gallic acid equivalent per gram of dry mass, were as follows: coffee leaves extract contained 21.89 mg GAE g-1dry mass, jambolan pulp extract had 11.68 mg GAE g-1dry mass and yerba mate exhibited 25.03 mg GAE g-1dry mass. Frizon et al.35 used 111 samples of yerba mate from different regions of the state of Paraná, Brazil (Southeast, Center-South, and Metropolitan Region of Curitiba) and the samples analyzed by the Folin-Ciocalteu method showed total phenol content ranging from 23.07-168.50 mg g-1. Gregorio et al.23 studied the influence of the alcoholic coffee leaves extract on both the induction period and the thermodynamic parameters of biodiesel derived from soybean oil, but the total phenolic content revealed within the extract used was 12.472 mg of GAE g-1dry mass, lower value compared to the current study, 21.89 mg of GAE g-1dry mass. Analyzing the phenol content in in natura jambolan samples, at different maturation stages, Brandão et al.36 obtained values in the range of 208.30 to 338.89 mg 100 g-1. The concentrations of phenolic compounds were observed to be higher during the green stage, whereas tannins were more predominant in the green/purple stage. However, it is necessary to consider that certain variability in the composition of the raw material may occur due to factors such as plant cultivation conditions, harvest time and geographic factors. HPLC-PDA chromatograms were used to qualitatively explore the classes of chemical compounds present in the ethanolic extracts of yerba mate leaves, coffee leaves and jambolan fruit (Figures 1-3). The identification of characteristic spectral profiles for chemical classes, such as phenolic acids, flavonoids, and organic acids, was facilitated by analyzing the molecular absorption spectra. This analysis focused on the wavelength region of 190-800 nm, which corresponds to chromatographic peaks indicative of the physical separation of these components.
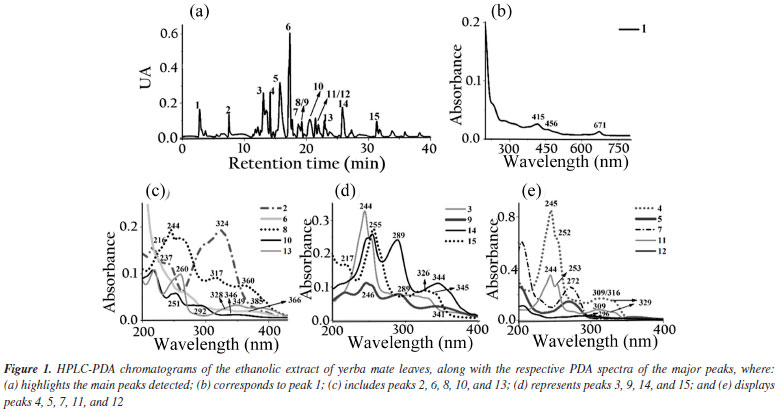
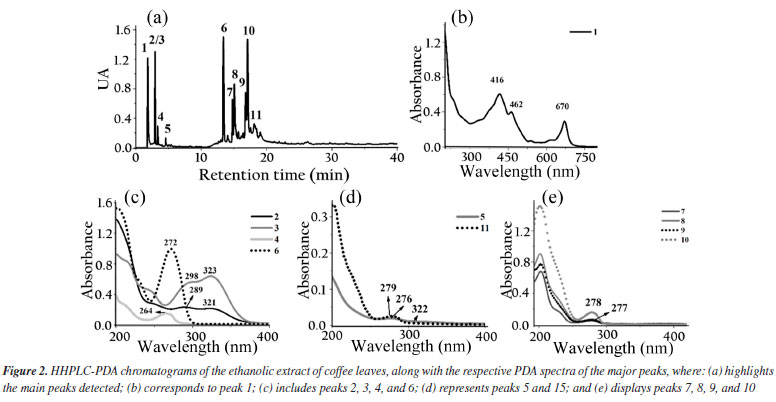
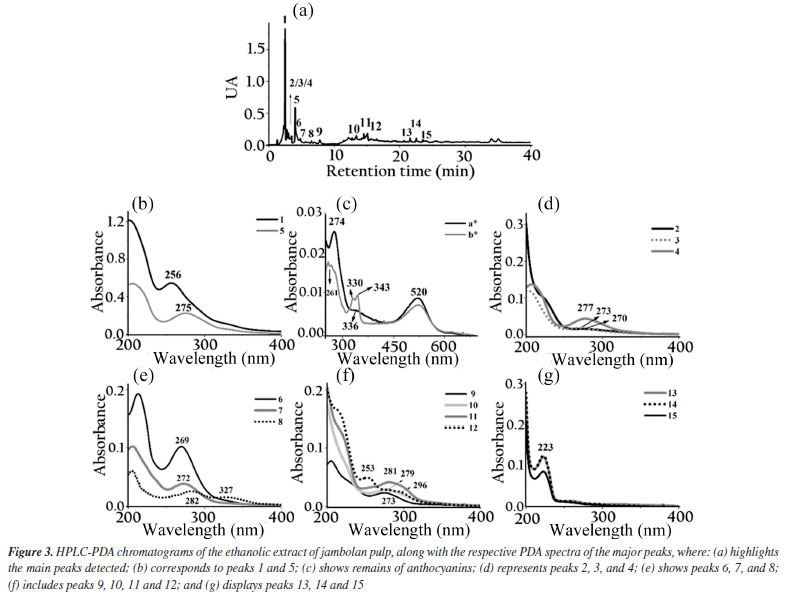
The ethanolic yerba mate leaves extract exhibited 15 main chromatographic peaks (Figure 1a). Given the green nature of the leaves, the presence of chlorophyll or its degradation derivatives was anticipated, as evidenced by peak 1, which shows absorption in the visible region at 670 nm.37 Peak 2 (Figure 1b) has absorption bands at 296 and 323 nm, indicative of chlorogenic acid class, as caffeoylquinic or caffeic acids.38 Flavonoids typically exhibit absorption spectra with two prominent bands: band I (300-380 nm) and band II (240-295 nm),39 as demonstrated by peaks 3, 8, 9, 10, 13, 14 (Figures 1c-1d). Peaks 4, 11, 12, and 15 (Figures 1d-1e) suggest the presence of monohydroxybenzoic acids.40 Peaks 5 and 7 (Figure 1e) are characteristic of theobromine and caffeine with absorption at 272 nm.30 The chromatographic analysis of the alcoholic yerba mate extract by UPLC-MS in positive mode [M + H]+ revealed the presence of rutin (m/z = 610), and chlorophyll degradation products such as phycocyanin (m/z = 612), phycoerythrin (m/z = 593), and phycocyanobilin (m/z = 541). The ethanolic coffee leaves extract exhibited 11 main chromatographic peaks (Figure 2a). Peak 1 is characteristic of chlorophyll a with absorption in the visible region (670 nm).37 Peaks 2 and 3 (Figure 2c) are characteristic of the principal class of chlorogenic acids (CGAs) and subclass of phenolic acids, such as caffeic acid, previously identified in coffee leaves extracts,30 with absorption bands at 298 and 328 nm.41 Trigonelline and caffeine are two of the four types of alkaloids present in coffee leaves.42 These compounds are characterized by absorption bands around 264 and 272 nm, respectively, which may correspond to peaks 4 and 6 (Figure 2c).43 Peak 5, with bands around 276 and 322 nm, can indicate some metabolite from the flavonoid subclass (Figure 2d). Peaks from 7 to 11 (Figures 2d-2e), have a characteristic profile of flavanols, including catechins, which are also found in the leaves of this plant.44 The analysis of the coffee leaves extract using UPLC-MS in positive mode [M + H]+ revealed the presence of caffeoylquinic acid (m/z = 354), feruloylquinic acid (m/z = 368), epigallocatechin (m/z = 306), and chlorophyll degradation products such as phycocyanin (m/z = 612) and phycoerythrin (m/z = 593). Jambolan fruit extract showed 15 main chromatographic peaks (Figure 3a). Peak 1 suggests the metabolite presence of the phenolic acid class, such as hydroxybenzoic or vanillic acid with absorption bands at 256 nm (Figure 3b). These phenolic acids may correspond to anthocyanin degradation products.45 Remains of anthocyanins (Figure 3c) can be inferred from the UV-Vis spectra, which typically exhibit a distinctive absorption pattern characterized by two primary clusters. The first cluster appears at a wavelength region of 260-280 nm and the second at 490-550 nm. Additionally, an extra peak is observed in the wavelength range of 310-340 nm if the sugar moiety of the anthocyanins is acylated.45 Peaks 2-4 (Figure 3d), 7 (Figure 3e), 9, and 10 (Figure 3f), may correspond to monomeric flavan-3-ols and their oligomers and polymers (proanthocyanidins) highly characteristics in jambolan that absorbs in the spectral range between 250 to 350 nm.46 Peak 5 (Figure 3b), with absorption at 275 nm, indicates the presence of syringic acid in the sample, a compound present in jambolan extract, is likely a result of the anthocyanin degradation process, as reported in peak 1.47 Peak 6 (Figure 3e) suggests the presence of gallic acid48 which is naturally present in jambolan49 and may be part of the degradation product of anthocyanins when heated.50 The UV spectrum for peak 8 (Figure 3e) resembles the characteristic profiles of specific subclass of flavonoids, and peak 4 (Figure 3d) indicates the presence of catechin and epicatechin at a wavelength of 277 nm.48 Peak 11 (Figure 3e) may indicate flavanol, potentially tyrosol.51 Peak 12 (Figure 3e) could be attributed to protocatechuic or vanillic acid.52 In jambolan, these compounds may also result from the degradation of anthocyanins. Finally, peaks 13 to 15 (Figure 3g) showed bands around 220 nm, which may indicate the presence of low molecular weight organic acids.53,54 The analysis of the alcoholic jambolan pulp extract using UPLC-MS in positive mode [M + H]+ revealed the presence of epicatechin/catechin (m/z = 290), caffeoylquinic acid (m/z = 354), chlorogenic acid (m/z = 368), anthocyanins as cyanidin (m/z = 449), malvidin (m/z = 493), peonidin (m/z = 463), and the presence of proanthocyanidin (m/z = 578) was also detected. The control sample and the samples containing Cr3+, Mn2+ and Co2+ at a concentration of 2.49 × 10⁻⁵ mol of cation in 100 g of biodiesel, with or without natural ethanol-free extracts at a concentration of 42.8 mg GAE of each extract, were subjected to the oxidative stability test to determine the values of the induction periods and rate constants of the biodiesel oxidation reaction at 110 ºC. In Table 2 are presented the induction periods (h), rate constants (h-1) of the biodiesel oxidation reaction and their respective determination coefficients (R2) obtained by fitting the data of the natural logarithm of electrical conductivity vs. time for the control sample and samples with cobalt (Co2+), manganese (Mn2+) and chromium (Cr3+) ions, with or without the extracts of yerba mate, coffee leaves and jambolan pulp. The values of R2 obtained in the model fitting range between 0.9430 ≤ R2 ≤ 0.9942 for all assays, with 75% of the results exhibiting values above 0.98. This indicates, according to Clemente et al.,26 that the choice of the first order reaction model was appropriate for determining the rate constant.
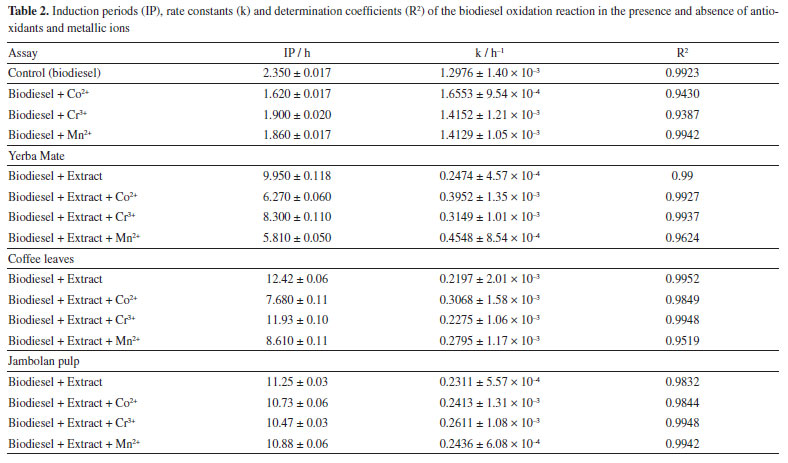
From Table 2, the biodiesel obtained showed an IP of 2.35 h and k of 1.2976 h-1 indicating the need to add an antioxidant to meet the EN1421431 standard which requires a minimum IP of 8 h. According to Akbarirad et al.,55 natural antioxidants can be present in plants, fruits, vegetables, seeds, leaves, root flours and peels. They are efficient when compared to synthetic antioxidants. Components such as flavonoids, phenolic acids, anthocyanins, carotenoids, organic acids, quinones, pigments, among others, which have one or more aromatic rings with hydroxyl groups, significantly contribute to biodiesel stability. When added to biodiesel, these antioxidants can reduce the rate constant, increase the IP, and extend storage time.26,38 As shown in Table 2, the addition of antioxidant extracts of yerba mate, coffee leaves and jambolan pulp increased the IP of biodiesel from 2.35 to 9.95, 12.42, an 11.25 h, respectively, values above the established by the EN1421431 standard. Furthermore, the k values decreased from 1.2976 to 0.2474, 0.2197 and 0.2311 h-1, respectively. With the application of the Tukey's test, the mean values for both IP and k, in the presence of the extracts, presented significant differences, with 2.3 × 10⁻⁴ ≤ pvalue ≤ 1.26 × 10⁻³ for IP, and 2.57 × 10⁻⁴ ≤ pvalue ≤ 7.37 × 10⁻³ for k, respectively. In the presence of cobalt (Co2+), chromium (Cr3+) and manganese (Mn2+) metallic ions, a reduction in the IP was observed, with cobalt being the most influential in reducing the IP and increasing the rate constant (k) of the control biodiesel oxidation reaction. The Tukey test applied to the means showed no significant difference between the IP and k values for the biodiesel samples in the presence of Cr3+ and Mn2+ ions, with a pvalue of 0.099 for IP and 0.1517 for k. In the oxidation process, unsaturated esters in biodiesel do not directly react with the atmosphere due to a mismatch in their fundamental states; atmospheric oxygen exists in a triplet state while the double bonds in the esters are in a singlet state. This difference in multiplicity states makes the reaction thermodynamically unfavorable. Therefore, the interaction between atmospheric oxygen and the fatty acid esters present in biodiesel is forbidden due to these differing states, resulting in a very slow rate of the oxidation reaction.56 For the oxidation reaction to proceed, either the double bond in the esters must be excited to a triplet state, or the multiplicity state of oxygen must change to a singlet state.57 To overcome the spin barrier, catalysts are necessary to initiate the oxidation process by removing an electron from the olefin or altering the electron spin of oxygen. Since only traces of catalysts are used to initiate the oxidation reaction, many seemingly spontaneous situations are, in fact, catalyzed by contaminants present in the environment.58 Transition metal ions act as catalysts in the oxidation process, and some of these ions may be present in biodiesel, in varying concentrations, accelerating the oxidative degradation rate. Biodiesel contamination by metallic ions can occur through direct contact with the surfaces of storage or transportation tanks, or as a result of sediments from oxidative processes in the equipment used for its production, including reactors and heat exchangers. Transition metal ions as cobalt, iron, copper, manganese, chromium, and vanadium, in small quantities, can catalyze oxidation reactions in biodiesel. However, only those metals capable of transferring a single electron act as active catalysts in these processes.14,59,60 According to Schaich,58 the mechanisms and initiation rates of metal-ion-catalyzed reactions are influenced by a complex interplay of factors. These include the nature of the metal and types of complexes it forms (inner or outer sphere), the presence of chelating or complexing agent, the redox potential of the metal and its complexes, solvents charactheristics, and the oxygen availability or pre-formed hydroperoxides. Initiation reactions directly catalyzed by metals in lower valence states often involves the formation of activated complexes with O2 and intermediates with hydroperoxides, primarily through inner sphere complexes. This process is facilitated in nonpolar solvents and is influenced by the oxygen partial pressure in the reaction medium. The electronic transfers of Co2+ (d7), in a nonpolar solvent, are characterized by inner-sphere mechanisms,58 which tend to be slower compared to the outer-sphere mechanisms associated with iron ions. The high electronic density of the ion justifies a weakening of the double bond through metal-olefin complexes through back-donation.61 Unlike copper, cobalt does not reduce to Co+, resulting in the formation of free radicals. This process is driven by the formation of an activated complex between Co2+ and oxygen and is further supported by the weakening of unsaturation. Moreover, the d7 configuration of cobalt, when complexed with an olefin (a strong-field ligand), can lead to a square planar geometry. According to Angilelli et al.,61 this unique geometric arrangement could significantly influence the catalytic mechanism of the cobalt ion, affecting its behavior in oxidation reactions. In the case of Mn2+, its specific symmetry state and the filling of d orbitals lend additional stability to its complexes, making them less labile and lower tendency for complexation with olefins. Its electronic configuration (d5) discourages the formation of complexes with olefins because of its relatively stable character. Unlike ions with higher electronic densities, Mn2+ in its current oxidation state does not favor complexation with unsaturated molecules, as there is no significant electronic density to facilitate stabilization through back-donation. Consequently, the initiation of radical reactions catalyzed by Mn2+ occurs indirectly, primarily through the formation of intermediate complexes with O2, rather than direct interaction with unsaturations. Cr3+ (d3) was the most inert metal ion among those studied. The stabilization of its three electrons reduces its redox potential, leading to significantly slower electron transfers. Moreover, Cr(III) does not possess the necessary electronic density or a sufficiently low valence state to facilitate complexation with olefin double bonds, and as a result, does not readily participate in π bond cleavage. To avoid the oxidative degradation of biodiesel, especially in the presence of transition metal ions, and to extend its storage time while preserving its properties, it is essential to add antioxidants shortly after production. Antioxidants can be categorized based on their mechanism of action: primary antioxidants, which neutralize free radicals by donating hydrogen atoms, and secondary antioxidants, which do not directly convert free radicals into stable molecules but instead have a preventive effect. They inhibit the catalytic action of transition metal ions through chelating or sequestering actions, filling all coordination sites of the metal and forming insoluble metal complexes. The chelating action on these metal ions or the employment of metal deactivators diminishes pro-oxidant activity by increasing the activation energy required for the initiation of the oxidation reaction. Consequently, some antioxidants exhibit more than one mechanism of action and are termed multifunctional antioxidants.62 Some alcoholic extracts of vegetables are rich in phenolic componds, including a suite of secondary metabolites such as phenolic acids, flavonoids, and polyphenolic derivatives. These compounds constitute the most important series of primary antioxidant compounds naturally present in these extracts. Moreover, depending on the extract's nature, compounds such as citric malic, succinic, and tartaric acids may also be present, acting as chelating agents for metallic ions. Additionaly, anthocyanins and carotenoids such as β-carotene, lycopene, zeaxanthin, and lutein may be found in these extracts, which have antioxidant capacity. They play a role in the oxidative process by quenching singlet oxygen (1O2) and neutralizing free radicals, thereby preventing the propagation of the biodiesel oxidation reaction.62 Upon adding yerba mate antioxidant extract to biodiesel, it was observed that the induction period increased to 9.95 h, and the rate constant decreased to 0.2474 h-1. However, the presence of the cobalt and manganese ions significantly influenced the oxidation reaction. Cobalt ions decreased the IP by 36.98%, resulting in an IP of 6.27 h, and increased the rate constant by 59.68% to 0.3952 h-1. Manganese ions decreased the IP by 41.61%, leading to an IP of 5.81 h, and increased the k value by 83.79% to 0.4548 h-1 (Table 2). However, in the presence of yerba mate extract, no significant difference in IP was observed at the 5% level among these ions. When added to biodiesel, the ethanol coffee leaves extract, the most effective among the tested extracts, resulted in an IP of 12.42 h and reduced the reaction's rate constant to 0.2197 h-1. However, the presence of manganese and cobalt ions significantly impacted the efficacy of the coffee leaves extract in the biodiesel mixture. Specifically, manganese ions decreased the IP to 8.61 h, a 30.67% reduction, and increased the k value to 0.2795 h-1, reflecting a 27.22% increase. Similarly, cobalt ions reduced the IP to 7.68 h, a 38.16% reduction, and raised the k value to 0.3068 h-1, indicating a 39.64% increase. In the presence of coffee leaves extract and Co2+ and Mn2+, the IP and k values showed significant differences, ranging between 2.31 × 10⁻⁴ ≤ pvalue ≤ 1.28 × 10⁻³. In Table 2, the presence of manganese (Mn2+) and cobalt (Co2+) ions in biodiesel, even when alcoholic extracts of yerba mate and coffee leaves are included, led to a noticeable reduction in the IP and an increase in k compared to the control sample. According to Angilelli et al.,61 the oxidation reactions of biodiesel in the presence of these metal ions facilitate the formation of free radicals, with the ions acting as catalysts for the reaction. This mechanism justifies the observed changes in IP and k. Analyzing the induction period and the rate constant of biodiesel oxidation reaction with addition of jambolan pulp natural extract (Table 2), an IP of 11.25 h and a k value of 0.2311 h-1 were observed. Among the tested metals, chromium exhibited the greatest interference with the oxidation reaction, reducing the induction period to 10.47 h - a reduction of only 6.93% - and increasing the rate constant to 0.2611 h-1, an increase of 12.98%. The oxidation reaction in the presence of manganese ion showed a reduction of 3.28% in the IP and an increase in the rate constant of 5.41%. Similarly, with the cobalt metal ions, there was a reduction in the IP of 4.62% and, consequently, an increase of 4.41% in the k value. For biodiesel in the presence of jambolan extract and metal ions, no significant difference was observed at the 5% level, with 0.49 ≤ pvalue ≤ 0.99 for IP. For the rate constant (k), no significant difference was observed between the biodiesel samples containing Co2+ and Mn2+, with pvalue equal to 0.068, which is very close to the 5% significance level. Notably, the percentage changes in IP and k values for manganese and cobalt were smaller than those observed with the addition of yerba mate and coffee leaves extracts. This difference may be attributed to the unique presence of anthocyanins in the jambolan pulp extract. Anthocyanins have the capability to deactivate the singlet oxygen generated at the onset of the biodiesel oxidation reaction in the presence of Co2+, Cr3+ and Mn2+ ions.59,62 Faria et al.63 highlighted the identification of bioactive compounds in jambolan fruit, including significant amounts of anthocyanins (211 mg per 100 g of sample) and carotenoids (89.20 μg per 100 g of sample), and evaluated its antioxidant capacity. Among the extracts examined, jambolan most effectively mitigated the impact of the metal ions. However, this study revealed that the alcoholic jambolan pulp extract was unique in presenting anthocyanins. Given their chemical structure, marked by conjugated double bonds, anthocyanins are sensitive to environmental factors such as light, heat, oxygen, and pH, which can lead to their degradation under such conditions.64
CONCLUSIONS The addition of alcoholic extracts with antioxidant properties led to an increase in the biodiesel induction period compared to the control sample. Notably, the coffee leaves extract had the most significant positive effect, extending the IP to 12.42 h. However, the presence of metallic ions such as chromium (Cr3+), manganese (Mn2+), and cobalt (Co2+), whether in combination with natural antioxidant extracts or not, decreased the IP in all tested scenarios. Specifically, the presence of Mn2+ ions had a pronounced impact on the biodiesel mixed with yerba mate extract, reducing its IP by 41.61%. The addition of extracts with antioxidant properties resulted in a decrease in the rate constant (k) of biodiesel oxidation compared to the control sample, which had a k value of 1.2976 h-1. Notably, the presence of natural extracts significantly reduced biodiesel oxidation, with the rate constant decreasing by 5.9 times in the presence of coffee leaves extract, resulting in a k value of 0.2197 h-1. Across all samples containing extracts with antioxidant properties, there was a consistent reduction in the rate constant, though to varying degrees compared to the control sample. When comparing the influence of metals and extracts with antioxidant properties, yerba mate extract showed the greatest interference from Mn2+, accelerating the oxidation reaction by 83.79%. Conversely, Cr3+ had the least influence on the oxidation process in the presence of coffee leaves extract, increasing the oxidation reaction rate by only 3.55%. Even though the biodiesel in the presence of coffee leaves extract showed a higher IP, the jambolan pulp extract exhibited the best antioxidant properties in the presence of metallic ions,
ACKNOWLEDGMENTS Laboratory of Chemometrics in Natural Sciences of the State University of Londrina (UEL), National Council for Scientific and Technological Development (CNPq, Process No. 303588/2021-7), Coordination for the Improvement of Higher Education Personnel (CAPES), Araucaria Foundation to Support Scientific and Technological Development of the State of Paraná.
REFERENCES 1. Peng, Z.; Zhang, B.; Wang, D.; Niu, X.; Sun, J.; Xu, H.; Cao, J.; Shen, Z.; Sci. Total Environ. 2024, 910, 168588. [Crossref] 2. Qi, X.; Li, Z.; Zhao, C.; Zhang, Q.; Zhou, Y.; Ocean and Coastal Management 2024, 247, 106936. [Crossref] 3. Sharmila, V. G.; Shanmugavel, S. P.; Banu, J. R.; Biomass Bioenergy 2024, 180, 106997. [Crossref] 4. Prasad, S.; Yadav, K. K.; Kumar, S.; Pandita, P.; Bhutto, J. K.; Alreshidi, M. A.; Ravindran, B.; Yaseen, Z. M.; Osman, S. M.; Cabral-Pinto, M. M. S.; J. Environ. Chem. Eng. 2024, 12, 111996. [Crossref] 5. Borsato, D.; Galvan, D.; Pereira, J. L.; Orives, J. R.; Angilelli, K. G.; Coppo, R. L.; J. Braz. Chem. Soc. 2014, 25, 1984. [Crossref] 6. Dogan, E.; Luni, T.; Majeed, M. T.; Tzeremes, P.; J. Cleaner Prod. 2023, 416, 137927. [Crossref] 7. Nirmala, M. J.; Sekar, P. C.; Johnson, A.; Kizhuveetil, U.; Shora, S.; Nagarajan, R.; Fuel 2023, 351, 128934. [Crossref] 8. Spacino, K. R.; Borsato, D.; Buosi, G. M.; Chendynski, L. T.; Fuel Process. Technol. 2015, 137, 366. [Crossref] 9. de Sousa, R. A.; Ribeiro, C.; Quim. Nova 2012, 35, 51. [Crossref] 10. Ataya, F.; Dubé, M. A.; Ternan, M.; Energy Fuels 2007, 21, 2450. [Crossref] 11. Rêgo, D. M. G.; da Silva, L. C.; Oliveira, M. N. M.; de Melo, R. P. F.; Carmo, S. K. S.; Research, Society and Development 2020, 9, e321997263. [Crossref] 12. Coelho, F. L. L.; Santos, I. O.; da Paixão, D. C.; Lhamas, D. E. L.; Rodrigues, G.; Suffredini, D. F. P.; de Medeiros, A. C. G.; Brazilian Journal of Development 2020, 6, 28844. [Crossref] 13. Maia, E. C. R.; Borsato, D.; Moreira, I.; Spacino, K. R.; Rodrigues, P. R. P.; Gallina, A. L.; Fuel Process. Technol. 2011, 92, 1750. [Crossref] 14. Chendynski, L. T.; Mantovani, A. C. G.; Savada, F. Y.; Messias, G. B.; Santana, V. T.; Salviato, A.; Di Mauro, E.; Borsato, D.; Fuel 2019, 242, 316. [Crossref] 15. Barbolla, I.; Sotomayor, N.; Lete, E.; Arkivoc 2020, 7, 158. [Crossref] 16. Mantovani, A. C. G.; Chendynski, L. T.; Galvan, D.; Macedo Júnior, F. C.; Borsato, D.; Di Mauro, E.; Fuel 2020, 274, 117833. [Crossref] 17. Freitas, J. P. A.; França, R. M. F.; Silva, M. S.; Toms, R. J.; da Silva, G. F.; Braz. J. Chem. Eng. 2019, 36, 905. [Crossref] 18. Sundus, F.; Fazal, M. A.; Masjuki, H. H.; Renewable Sustainable Energy Rev. 2017, 70, 399. [Crossref] 19. Kumar, N.; Fuel 2017, 190, 328. [Crossref] 20. Rahman, S. M. A.; Fattah, I. M. R.; Maitra, S.; Mahlia, T. M. I.; Energy Convers. Manage. 2021, 229, 113742. [Crossref] 21. Medeiros, M. L.; Cordeiro, A. M. M. T.; Queiroz, N.; Soledade, L. E. B.; Souza, A. L.; Souza, A. G.; Energy Fuels 2014, 28, 1074. [Crossref] 22. Coppo, R. L.; Pereira, J. L.; Silva, H. C.; Angilelli, K. G.; Rodrigues, P. R. P.; Galvan, D.; Borsato, D.; J. Biobased Mater. Bioenergy 2014, 8, 545. [Crossref] 23. Gregório, A. P. H.; Romagnoli, E. S.; Borsato, D.; Galvan, D.; Spacino, K. R.; Sustainable Energy Technologies and Assessments 2018, 28, 60. [Crossref] 24. Romagnoli, E. S.; Borsato, D.; Silva, L. R. C.; Tashima, D. L. M.; Canesin, E. A.; Biofuels 2020, 11, 839. [Crossref] 25. Chendynski, L. T.; Cordeiro, T.; Messias, G. B.; Mantovani, A. C. G.; Spacino, K. R.; Zeraik, M. L.; Borsato, D.; Fuel 2020, 261, 116379. [Crossref] 26. Clemente, M. A. J.; Branco, I. G.; Romagnoli, E. S.; Gonçales Filho, J.; Mantovani, A. C. G.; Chendynski, L. T.; Borsato, D.; Fuel 2023, 353, 129276. [Crossref] 27. ASTM D4052: Standard Test Method for Density, Relative Density, and API Gravity of Liquids by Digital Density Meter, West Conshohocken, 2018; ASTM D93: Standard Test Methods for Flash Point by Pensky-Martens Closed Cup Tester, West Conshohocken, 2020; ASTM D445: Standard Test Method for Kinematic Viscosity of Transparent and Opaque Liquids (and Calculation of Dynamic Viscosity), West Conshohocken, 2021; ASTM D664: Standard Test Method for Acid Number of Petroleum Products by Potentiometric Titration, West Conshohocken, 2018; ASTM D6304-20: Standard Test Method for Determination of Water in Petroleum Products, Lubricating Oils, and Additives by Coulometric Karl Fischer Titration, West Conshohocken, 2020; ASTM D2500-17a: Standard Test Method for Cloud Point of Petroleum Products and Liquid Fuels, West Conshohocken, 2017; EN 14111: Fat and Oil Derivatives. Fatty Acid Methyl Esters (FAME). Determination of Iodine Value, European Committee for Standardization: Brussels, 2003. 28. Kumazawa, S.; Hamasaka, T.; Nakayama, T.; Food Chem. 2004, 84, 329. [Crossref] 29. Romagnoli, E. S.; Borsato, D.; Silva, L. R. C.; Chendynski, L. T.; Angilelli, K. G.; Canesin, E. A.; Ind. Crops Prod. 2018, 125, 59. [Crossref] 30. Pauli, E. D.; Scheel, G. L.; Delaroza, F.; Rakocevic, M.; Bruns, R. E.; Scarminio, I. S.; Microchem. J. 2019, 151, 104218. [Crossref] 31. EN 14214: Liquid Petroleum Products. Fatty Acid Methyl Esters (FAME) for Use in Diesel Engines and Heating Applications. Requirements and Test Methods, European Committee for Standardization: Brussels, 2020. 32. EN 14112: Fat and Oil Derivatives - Fatty Acid Methyl Esters (FAME), Determination of Oxidation Stability (Accelerated Oxidation Test), European Committee for Standardization: Brussels, 2020. 33. Statistica for Windows Software, version 13.4.0; Statsoft Inc., Tulsa, OK, USA, 2018. 34. Agência Nacional do Petróleo, Gás Natural e Biocombustíveis (ANP); Resolução ANP No. 920, de 4 de abril de 2023; Estabelece a Especificação do Biodiesel e as Obrigações quanto ao Controle da Qualidade a Serem Atendidas pelos Agentes Econômicos que Comercializem o Produto em Território Nacional; Diário Oficial da União (DOU), Brasília, de 05/04/2023. [Link] accessed in January 2025 35. Frizon, C. N. T.; Oliveira, G. A.; Perussello, C. A.; Peralta-Zamora, P. G.; Camlofski, A. M. O.; Rossa, U. B.; Hoffmann-Ribani, R.; LWT--Food Sci. Technol. 2015, 60, 795. [Crossref] 36. Brandão, T. S. O.; Sena, A. R.; Teshima, E.; David, J. M.; Assis, S. A.; Cienc. Tecnol. Aliment. 2011, 31, 849. [Crossref] 37. Lichtenthaler, H. K.; Buschmann, C.; Current Protocols in Food Analytical Chemistry 2001, 1, 4. [Crossref] 38. Haminiuk, C. W. I.; Maciel, G. M.; Plata-Oviedo, M. S. V.; Peralta, R. M.; Int. J. Food Sci. Technol. 2012, 47, 2023. [Crossref] 39. Taniguchi, M.; LaRocca, C. A.; Bernat, J. D.; Lindsey, J. S.; J. Nat. Prod. 2023, 86, 1087. [Crossref] 40. Singh, D. P.; Govindarajan, R.; Khare, A.; Rawat, A. K. S.; J. Chromatogr. Sci. 2007, 45, 701. [Crossref] 41. Campa, C.; Mondolot, L.; Rakotondravao, A.; Bidel, L. P. R.; Gargadennec, A.; Couturon, E.; La Fisca, P.; Rakotomalala, J. J.; Jay-Allemand, C.; Davis, A. P.; Ann. Bot. 2012, 110, 595. [Crossref] 42. Chen, X.; Crit. Rev. Food Sci. Nutr. 2019, 59, 1008. [Crossref] 43. Yisak, H.; Redi-Abshiro, M.; Chandravanshi, B. S.; Chem. Cent. J. 2018, 12, 59. [Crossref] 44. Tritsch, N.; Steger, M. C.; Segatz, V.; Blumenthal, P.; Rigling, M.; Schwarz, S.; Zhang, Y.; Franke, H.; Lachenmeier, D. W.; Foods 2022, 11, 263. [Crossref] 45. Saha, S.; Singh, J.; Paul, A.; Sarkar, R.; Khan, Z.; Banerjee, K.; J. AOAC Int. 2020, 103, 23. [Crossref] 46. Gris, E. F.; Mattivi, F.; Ferreira, E. A.; Vrhovsek, U.; Pedrosa, R. C.; Bordignon-Luiz, M. T.; Food Chem. 2011, 126, 213. [Crossref] 47. Yang, P.; Yuan, C.; Wang, H.; Han, F.; Liu, Y.; Wang, L.; Liu, Y.; Molecules 2018, 23, 354. [Crossref] 48. Caldas, T. W.; Mazza, K. E. L.; Teles, A. S. C.; Mattos, G. N.; Brígida, A. I. S.; Conte-Junior, C. A.; Borguini, R. G.; Godoy, R. L. O.; Cabral, L. M. C.; Tonon, R. V.; Ind. Crops Prod. 2018, 111, 86. [Crossref] 49. do Nascimento-Silva, N. R. R.; Bastos, R. P.; da Silva, F. A.; J. Food Compos. Anal. 2022, 109, 104491. [Crossref] 50. Brown, J. E.; Kelly, M. F.; Eur. J. Lipid Sci. Technol. 2007, 109, 66. [Crossref] 51. dos Santos, A. E.; Aguiar, G. P. S.; Magro, C. D.; Lacowicz, R. A.; Fedrigo, I. M. T.; Bordignon-Luiz, M. T.; Oliveira, J. V.; Lanza, M.; Braz. J. Food Technol. 2022, 25, e2021055. [Crossref] 52. Robbins, R. J.; J. Agric. Food Chem. 2003, 51, 2866. [Crossref] 53. Pereira, V.; Câmara, J. S.; Cacho, J.; Marques, J. C.; J. Sep. Sci. 2010, 33, 1204. [Crossref] 54. Han, Y.; Du, J.; Li, J.; Li, M.; Molecules 2019, 24, 2150. [Crossref] 55. Akbarirad, H.; Ardabili, A. G.; Kazemeini, S. M.; Khaneghah, A. M.; Int. Food Res. J. 2016, 23, 928. [Link] accessed in January 2025 56. Miller, D. M.; Buettner, G. R.; Aust, S. D.; Free Radicals Biol. Med. 1990, 8, 95. [Crossref] 57. Johnson, D. R.; Decker, E. A.; Annu. Rev. Food Sci. Technol. 2015, 6, 171. [Crossref] 58. Schaich, K. M.; Bailey's Industrial Oil and Fat Products, 6th ed.; Shahidi, F., ed.; Wiley: New Jersey, 2005, ch. 7. 59. Sui, M.; Chen, Y.; Li, F.; Wang, H.; Fuel 2021, 303, 121288. [Crossref] 60. Chendynski, L. T.; Romagnoli, E. S.; Mantovani, A. C. G.; Kimura, M.; Marques, L. C.; Borsato, D.; J. Braz. Chem. Soc. 2019, 30, 90. [Crossref] 61. Angilelli, K. B.; Mantovani, A. C. G.; Chendinski, L. T.; Mathematical Modeling of Biofuel Synthesis and Storage; EDUEL: Londrina, PR, 2022. 62. Wanasundara, P. K. J. P. D.; Shahidi, F.; Bailey's Industrial Oil and Fat Products, 6th ed.; Shahidi, F., ed.; Wiley: New Jersey, 2005, ch. 11. 63. Faria, A. F.; Marques, M. C.; Mercadante, A. Z.; Food Chem. 2011, 126, 1571. [Crossref] 64. Furtado, P.; Figueiredo, P.; das Neves, H. C.; Pina, F.; J. Photochem. Photobiol., A 1993, 75, 113. [Crossref]
Editor handled this article: Jorge M. David |

On-line version ISSN 1678-7064 Printed version ISSN 0100-4042
Qu�mica Nova
Publica��es da Sociedade Brasileira de Qu�mica
Caixa Postal: 26037
05513-970 S�o Paulo - SP
Tel/Fax: +55.11.3032.2299/+55.11.3814.3602
Free access