
 |
 |
 |
 |
 |
Artigo
| CamInd α-Rn: a physical simulator for in vivo use |
|
Cassya R. P. GuimarãesI; José A. dos Santos JúniorI,* I. Departamento de Energia Nuclear, Universidade Federal de Pernambuco, 50740-545 Recife - PE, Brasil Received: 10/17/2024 *e-mail: jose.asantosjr2@ufpe.br Radon, a natural alpha-emitting radioactive gas, predominantly comprises the isotope 222Rn from the 238U series, accounting for 54% of the natural dose in homes. This study developed a radon simulator for enhanced indoor monitoring, using a high-uranium-content source, achieving average radon concentrations of 3,200 ± 324 and 4,654 ± 467 Bq m-3 with passive and active methods, respectively. The simulator facilitated expanded research, in vivo monitoring, and meter certification, offering a cost-effective tool to manage the health impacts of radon and promote radiation safety standards. INTRODUCTION Environmental radioactivity comes from natural and anthropogenic sources.1 Natural sources involve cosmic radiation, cosmogenic and terrestrial radionuclides, contributing to approximately 80% of the environmental radiation.2 Radon contributes significantly, particularly the isotope 222Rn, which, along with its progeny, contributes an average annual effective dose of 1.20 mSv, accounting for over 50% of the exposure from natural sources.3,4 Due to its physical characteristics, it widely diffuses in indoor environments where humans spend most of their time.5,6 Environmental, seasonal, climatic, geological, and chemical factors influence transport mechanisms and radon concentrations. The flow of 222Rn atoms and their progeny in the soil depends on the distribution of uranium and radium in the geological bedrock, soil properties such as permeability and porosity, meteorological parameters like temperature, humidity, and atmospheric pressure, and the local geology.7,8 Rn emanates from rocks, soils, groundwater, and building materials, whereas for dense materials, exhalation occurs through cracks and can be accumulated inside human living environments.2 After being exhaled, it percolates along ventilation currents and undergoes decay to short half-life progeny, such as 218Po, 214Pb, 214Bi, and 214Po.6 The descendants of 222Rn tend to adhere to aerosol particles and solid surfaces or remain as free ions or small molecular clusters. The dose corresponding to radon is attributed to its progeny. When inhaled, its descendants are deposited in the lung, especially in the upper respiratory tract, irradiating the lung tissue as they decay.9 The International Agency for Research on Cancer classifies radon as a class I carcinogen,9 mainly in earthen environments, where the soil becomes the main contributor.10 Several studies11,12 have developed passive systems for sampling contaminants, mainly gases for indoor and outdoor environments. In the applied context, physical simulators are important in investigating the 222Rn, ensuring control and quality in radiological protection with precise measurements and radon analysis.13 The simulators have simple geometries, are constructed as boxes, or resemble the research environment. The research was based on constructing a chamber for radon analysis in indoor environments. This chamber will serve as a basis for applications in dosimetric studies, radioecological protection, computational simulations, certification of passive and active devices, and in vivo studies, enhancing the understanding of the stochastic effects caused by the exposure of bioindicator species to the radioactive gas.
EXPERIMENTAL Construction of the radon chamber The chamber represents a human living environment. It was designed using AutoCAD 2020 (student version, Autodesk, USA). The chamber is titled indoor radon chamber (abbreviated as CamInd α-Rn). The physical construction was carried out using acrylic material, which is transparent, colorless, and rigid, with a thickness of 0.4 cm. The simulator consists of thirty-two pieces assembled using acrylic glue, with external dimensions of 60 cm in length, 43.2 cm in width, and 61 cm in height, resulting in a useful volume of approximately 158 cm3. On the floor of the simulator, a sample with high levels of naturally occurring radioactive material (NORM) was applied, where Rn was produced, emanated, and accumulated in the CamInd α-Rn. Characterization of the NORM font for use in the simulator The NORM sample used in the simulator was collected from a rocky outcrop in the city of Pedra, state of Pernambuco, Brazil, where there are occurrences of natural uranium.14,15 The sample treatment involved reducing the particle size to 1.0 mm, using jaw crushers and roller mills with different openings. Subsequently, the material was homogenized and quartered, and a 300 g aliquot was placed in a high-strength polyethylene container, hermetically sealed. A period of 21 days was awaited to favor the condition of secular radioactive equilibrium among the radionuclides with short physical half-lives. The radiometric analysis was conducted using a high-resolution gamma spectrometry system, with an HPGe-Be type detector from Canberra™, belonging to the Laboratório de Radioquímica e Análise Nuclear (LABRAN) of the Departamento de Energia Nuclear at the Universidade Federal de Pernambuco, Brazil. The detector has an active volume of 41.1 cm3, an energy resolution of 1.8 keV for 1,332 keV of 60Co, and an intrinsic relative efficiency of 25%. It was mounted in a cryostat with a maximum capacity of 30 L of liquid nitrogen. The system was coupled to a multichannel analyzer (MCA) with 4,096 channels, Eagle Plus model (Canberra™, USA). The operating voltage of the preamplifier was set at 3 kV. The Genie-2k™ software, version 1.0 (Canberra™, USA), was used to acquire and process the data. To avoid interference from laboratory background radiation, the detector was enclosed by lead shielding, with a thickness of 6.5 cm and a weight of 600 kg, with an additional thin internal surface comprised of layers of Cd and Cu to minimize the effect of scattered radiation. The specific concentrations, A, in Bq kg-1, were determined by Equation 1, where NEI corresponds to the total net area of the gamma transition of interest (counts); ε represents the counting efficiency per energy; t is the counting time (s); Iγ is the gamma abundance of the radionuclide; m is the mass of the sample (kg). 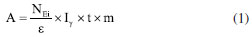 The 238U was determined by the gamma transition of 63.29 keV from 234Th; the 40K by the gamma of 1,460.86 keV; the 226Ra by the energies of 351.92 keV from 214Pb and 609.31 keV from 214Bi; and the 232Th by the transitions of 583.19 keV from 208Tl and 911.21 keV from 228Ac. The activities of 226Ra and 232Th were weighted, A-, by Equation 2, considering the characteristic transitions of each radionuclide and their respective emission probabilities.  In Equation 2, A1 and A2 correspond to the specific activities initially calculated by Equation 1; γ1 and γ2 are the emission probabilities for each gamma transition. The analysis time for the sample was standardized at 84,600 s, and it was positioned 8 cm from the HPGe detector. To minimize uncertainties, the background of the container and the laboratory were measured considering the same conditions as the sample measurement. Gamma spectrometer calibration in energy and efficiency In the energy calibration, an experimental arrangement was used to apply sealed and certified point source standards of 133Ba, 137Cs, and 60Co. These sources emit gamma radiation from 81.0 to 1,332.5 keV, matching the energy range of the radionuclides of interest in the environmental matrix. The sources were positioned on the surface of the detector without barriers and with adjusted dead time. They were measured individually for 300 s, considering the activities and counting statistics. After the acquisitions, the MCA channels were adjusted using the Genie-2k® software from Canberra®, based on the technical document TECDOC-619 from the International Atomic Energy Agency.16 Primary open sources of 133Ba, 152Eu, and 241Am with certified activities were used for efficiency calibration. Secondary standards were prepared in matrices similar to the NORM sample, then stored individually in high-strength polyethene containers and doped with open sources. Thus, secondary standards in a solid matrix were constructed, sealed and analyzed under similar conditions. The energy efficiencies, ε, were calculated after the acquisitions and analyses of the gamma spectra using Equation 1.16 CamInd α-Rn monitoring and certification systems To measure the radon concentration inside the CamInd α-Rn, a mass of 4.48 kg of NORM material was placed on the chamber floor, filling the entire base compartment. Passive detectors, α Espec-222, and active detectors, ionization chambers, were used to monitor this gas. The passive measurement systems used to monitor and quantify the levels of 222Rn in the CamInd α-Rn were the alpha spectrometers, α Espec-222, consisting of an air diffusion chamber and CR-39. The passive spectrometer was developed in the work of Santos et al.,17 which also describes the calibration performed at the Laboratório de Serviço de Monitoração Ambiental (SEAMB) of CRCN-NE/CNEN. Thirteen spectrometers were installed at different heights to measure the radon concentration in the CamInd α-Rn, with exposure periods of 36, 40, and 60 days, determined based on the radioactivity level of the NORM sample to prevent device saturation. Following the exposures and using the methodology described by Santos et al.,17 the devices were developed and analyzed using an optical microscope with an image capture system. An AlphaGUARD professional radon monitor, an ionization chamber type from Saphymo GmbHTM, model AlphaGUARDTM, was used for active monitoring. This equipment has a sensitive volume of 0.62 L, operates with a rechargeable battery or directly from the electrical network, and works in the 2 to 2,000,000 Bq m-3 range. An air collector pump (AlphaPUMP) was coupled to the AlphaGUARD and adjusted to maintain an airflow of 1.0 L min-1. The detector was set to measure in continuous cycle mode, with data acquisition every 10 min. A silicone hose system was coupled to the AlphaGUARD to facilitate gas migration through the system, with subsequent return to the simulator, completing the measurement cycle. A glass filter was attached at the entrance of the active detection system to minimize or eliminate air moisture. The background measurement of the simulator was also performed, following the same methodology described earlier, but without the presence of the radioactive source in the CamInd α-Rn. The physical parameters of the laboratory, such as temperature and humidity, were also monitored. The obtained values for the nighttime period were 27.5 ± 3 ºC and 82.5%, respectively. During the morning and afternoon periods, the variables had average values of 29.2 ± 4 ºC and 88%, respectively.
RESULTS AND DISCUSSION Construction of CamInd α-Rn The CamInd α-Rn is shown in Figure 1, featuring a hinged top lid/roof (1), equipped with forty-nine diffusers (2), which are circular holes with a diameter of 3 cm, designed to enhance the natural diffusion of air, oxygen renewal, and minimize the escape of Rn. It has two fixed subfloors (3), which support the maintenance of movable floors, facilitating cleaning. The floor (4) has been designated as the internal area of the simulator, monitored by passive devices and an active detector (5), with temperature and humidity control.
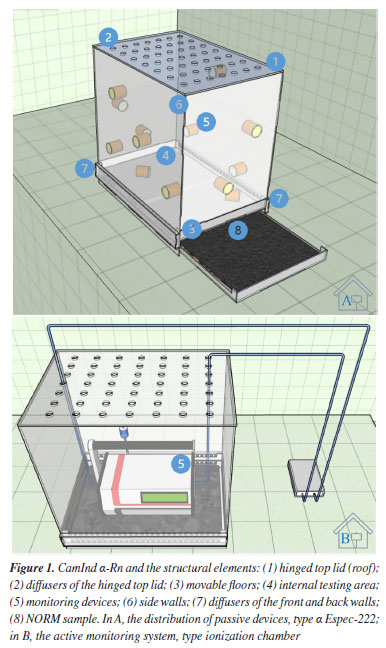
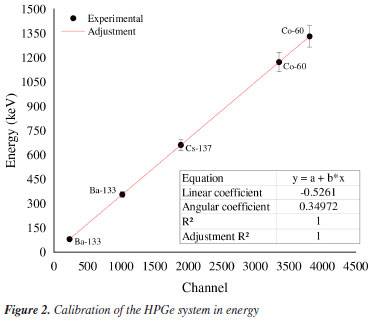
It also has two fixed bases that provide stability and mobility for the floors; four side walls (6), with fifty-six diffusers inserted at the lower edge on the front and back walls (7), arranged in two lateral and parallel rows, with twenty-eight each, made up of a square geometry of 1.0 cm per side, forming what is called air deflectors, each 60 cm long and 1.4 cm wide, designed to direct the flow of radioactive gas produced by the NORM sample (8) into the chamber. Characterization of the NORM sample For the characterization of the radionuclides present in the NORM sample inserted in the CamInd α-Rn, energy calibration of the gamma spectrometer, which model is shown in Figure 2, was performed. The model obtained from Equation 3 was used to characterize the radionuclides. The experimental design shows excellent correlation for mapping the photon energies (E) in the channels configured for the MCA (C). 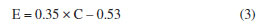
A mathematical model was empirically determined to calculate the efficiencies per energy to quantify the radionuclides present in the NORM sample, as demonstrated in the function shown in Figure 3. The Lorentz function best represented the behavior of the results obtained.
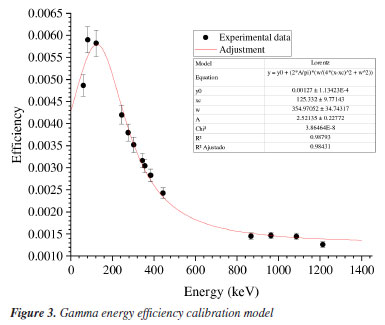
The experiment indicates that the efficiency decreases with the increase in photon energy. However, the mechanism allows for corrections and quantification of the radionuclides present in the sample with low uncertainty (Equation 4).  In this equation, ε represents the energy efficiency; E is the energy associated with the photon; y0, A, w, and xc are the fitting parameters of the equation, with values described in Figure 3. Based on the calibration parameters of the gamma spectrometer and considering the experimental arrangement established in the methodology, the specific activities of 238U, 226Ra, 232Th, and 40K, which are the main constituents of NORM, were obtained, with detailed results shown in Figure 4.
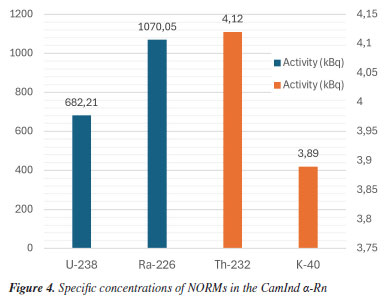
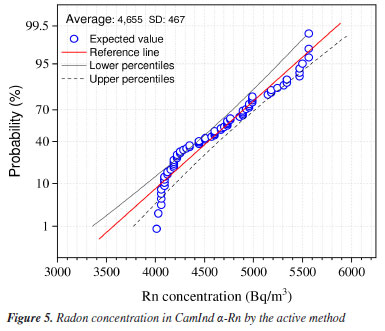
Radiometric scanning is essential for characterizing the sample used in the simulator, which is useful for studies involving exposure to natural radionuclides. The results allow the sample to be described as coming from a location with high levels of natural radioactivity, using the global averages presented by UNSCEAR2 as a comparative basis. Monitoring of 222Rn in CamInd α-Rn Figure 5 presents the measurements of Rn concentrations using the active AlphaGUARD detector. The data is correlated with the probability of a normal function occurrence, with a 95% confidence level. The average deviation for the radon concentration was 4,654 ± 467 Bq m-3. Before adding the NORM sample, the simulated background of the environment was estimated at 68 ± 25 Bq m-3. For the dataset presented in the experiment of Figure 5, the coefficient of variation was calculated at 10%, allowing for the observation of a low probability of dispersion and a high representation of the average value for the dataset of the experiment. The test of means confirms that the dataset adheres to a normal distribution, with median and mode values of 4,604 and 4,188 Bq m-3, respectively.
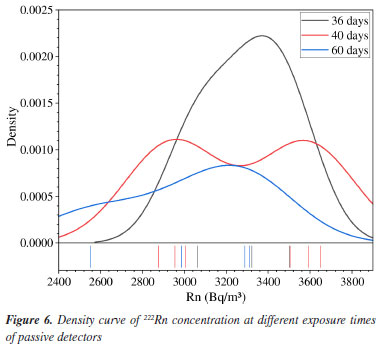
Passive monitoring with α Espec-222 allowed for determining an average concentration inside the simulator of 3,200 ± 324 Bq m-3, for n = 13, with a range from approximately 2,553 to 3,650 Bq m-3 and a coefficient of variation of 10%, corroborating the dispersion obtained in the experiment with the active detector. Table 1 presents the results from each device inside the CamInd α-Rn. From the measured values, the averages of concentrations at three different heights within the chamber were calculated: from 0 to 14.0 cm, 3,385 ± 280; from 17.0 to 31.5 cm, 3,199 ± 215; and from 34.5 to 52.0 cm, 2,831 ± 242 Bq m-3. This relationship aids in understanding the dispersion of radon within the physical simulator. At the monitoring point with a height between 34.5 and 52.0 cm, the gas concentrations were slightly lower, a fact justified by the greater distance from the base of the simulator, where the NORM material is contained, due to the density of Rn, as well as the presence of air diffusers on the ceiling of the CamInd α-Rn. Between the heights of 0 to 14.0 cm and 17.0 to 31.5 cm, as expected, the highest concentrations of 222Rn were evidenced due to the proximity of the devices to the NORM material. The study of the indoor distribution of 222Rn for concentration measurements with passive detectors over exposure times of 36, 40, and 60 days is presented in the density curve graph of Figure 6. The average concentration estimate for the 36 days was 3,325 ± 265 Bq m-3, with a variation coefficient of 8%. For the 40 days, the average was 3,248 ± 151 Bq m-3, with a variation coefficient of 10%. In 60 days of exposure, the average was 3,034 ± 353 Bq m-3 and the variation coefficient of 12%, whose predictability can be observed in the relationship presented in Figure 6.
Considering the influence of time in determining the Rn concentration by the passive method, the weighted average and deviation based on the results obtained for the different measurement times were estimated. The weighted average and deviation were approximately 3,174 ± 270 Bq m-3, with a variation coefficient close to 8.5%, whose representativeness aligns with the variation coefficient obtained for the 36-day period, which is already a significant time in monitoring environments with high levels of natural radioactivity, as in the case of the study. The data obtained by the passive and active detectors were correlated to compare the empirical results. Figure 7 presents details of this correlation.
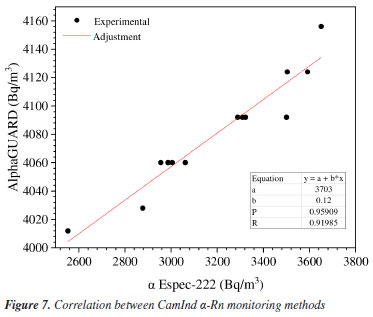
The correlation factor was approximately 0.92, meeting the criteria proposed by the methods, which included Equation 5, which was determined to correlate the concentrations of 222Rn by the methods applied. Considering a significant level of 95%, the model can be used to predict radon concentrations in the simulator and subsequently in in situ evaluation methods.  The experimental model derived from Equation 5 offers monitoring time advantages, requiring a shorter period to estimate radon levels in the simulated environment. It is also applicable in field experiments, where time is an important tool to minimize costs and achieve a higher volume of results. By adopting the weighted model, there is less data dispersion and greater confidence in the treated results, which has been chosen to express the representation of passive monitoring inside the physical simulator. The weighted average concentration of 222Rn, correlating the average values of passive and active detectors, was 3,943 ± 769 Bq m-3, with an estimated variation coefficient of approximately 19%. This result is acceptable, especially when dealing with different monitoring methods. Similar variation coefficients were observed for the models used in the study, which shows the reproducibility of the methods, although they present different trend measures. These differences arise from the different monitoring periods for the methods, sensitivity, and differentiated experimental arrangement. The results obtained in a controlled environment do not represent a real field situation, influenced by many parameters, some beyond the operator's control. However, it enabled the investigation of factors to be considered in a field evaluation, which can influence the dosimetry of the environment. A study conducted by Alberigi18 uses a passive monitoring method to show the influence of the ventilation on the radon concentration inside caves. Concentrations ranged from 2,892 to 9,457 Bq m-3 at the entrance and deeper regions. This condition was observed in the current study among the α Espec-222 devices installed at different altitudes in the CamInd α-Rn simulator, where variables interfere with the diffusion of air and radon within the simulated environment. Xie et al.19 conducted similar monitoring to investigate the concentration of radon emitted from concrete blocks inside a room with the door open and closed. The findings were from 79 to 110 Bq m-3 for tests with the door closed and between 25.5 and 48 Bq m-3 with the door open, demonstrating the contribution of ventilation to the radon levels in the environment. The study by Ramos et al.20 in inhabited uranium areas in the municipalities of Abreu e Lima, Paulista, and Olinda, in the state of Pernambuco, presented an average concentration of radon 222Rn, through passive monitoring, of 4,798 ± 461 and 5,012 ± 589 Bq m-3. The monitoring periods were 3 to 6 months, respectively, highlighting an anomalous regional condition. Oliveira21 measured the radon concentration in rocks near dwellings, ranging from 53.7 ± 1.6 to 1,141 ± 26 Bq m-3. This demonstrates that the use of this material as a decorative element or in construction materials increases exposure to radon and its progeny. The comparative analyses corroborate the results of this study, confirming that the values found for the concentration of 222Rn inside the simulator are influenced by the NORM sample, where the rocky material has high levels of radionuclides from the 238U series due to the high concentrations of radon inside the chamber. Additionally, in comparative terms, there is agreement with the differences in Rn concentrations in indoor environments, which are influenced, according to previously described comparative studies, by temporal and physical variables, a fact observed in laboratory experiments.
CONCLUSIONS The construction of the CamInd α-Rn allowed the creation of a controlled environment for conducting tests with Rn indoors. The simulator with NORM enabled the study of the concentration and analysis of the behavior of 222Rn in a controlled indoor environment and the combination of passive and active methodologies to assess risks efficiently and cheaply. The placement of passive devices in the simulator contributed to assess indoor concentration related to air diffusion inside the CamInd α-Rn. The physical simulator proved to be efficient in representing a human cohabitation environment, promoting knowledge and experimental planning for evaluating areas impacted by NORM. The experimental arrangements in the simulator corroborate with field studies and can be used for experiment management and standardization of measurement conditions. The product constructed in this research will serve for future applications in the metrology of Rn and in vivo applications using bioindicators, dosimetric studies, certification of passive and active devices, and applications in radiological protection.
ACKNOWLEDGMENTS The authors thank Universidade Federal de Pernambuco, Centro de Tecnologia e Geociências, Departamento de Energia Nuclear for the infrastructure provided, Conselho Nacional de Desenvolvimento Científico e Tecnológico (CNPq) for the research productivity grant (process 304557/2023-4) and the postdoctoral fellowship (process 175873/2023-2), Fundação de Amparo à Ciência e Tecnologia do Estado de Pernambuco (FACEPE) for the postdoctoral fellowship, research project grants (processes APQ-0245-3.01/21, BFP-0101-3.01/22, and APQ-1049-3.09/22) and a scientific initiation scholarship (process BIC-0074-4.06/23), Coordenação de Aperfeiçoamento de Pessoal de Nível Superior (CAPES), UFPE - Pró-Reitoria de Pós-Graduação (PROPG) for the financial assistance provided by PROPG notice 09/2023 (process 23076.045850/2023-22), as well as to UFPE - Pró-Reitoria de Pesquisa e Inovação (PROPESQI) for the support granted through public notice 05/2023 (public notice to support qualified production, process 23076.055174/2023-86).
REFERENCES 1. Xavier, A.; Lima, A.; Vigna, C.; Verbi, F.; Bortoleto, G.; Goraieb, K.; Collins, C.; Bueno, M.; Quim. Nova 2007, 30, 83. [Crossref] 2. United Nations Scientific Committee on the Effects of Atomic Radiation (UNSCEAR); Sources and Effects of Ionizing Radiation, UNSCEAR 2008 Report to the General Assembly, with Scientific Annexes, Volume I; United Nations: New York, 2008. [Link] accessed in April 2025 3. United Nations Scientific Committee on the Effects of Atomic Radiation (UNSCEAR); Sources and Effects of Ionizing Radiation, UNSCEAR 2000 Report to the General Assembly, with Scientific Annexes; United Nations: New York, 2000. [Link] accessed in April 2025 4. United States Environmental Protection Agency (US EPA); A Citizen's Guide to Radon; US EPA Indoor Environments Division: Washington, 2016. [Link] accessed in April 2025 5. Gopalakrishnan, P.; Jeyanthi, J.; Mater. Today 2022, 56, 1495. [Crossref] 6. Lecomte, J. F.; Solomon, S.; Takala, J.; Jung, T.; Strand, P.; Murith, C.; Kiselev, S.; Zhuo, W.; Shannoun, F.; Jannsens, A.; Ann. ICRP 2014, 43, 45. [Crossref] 7. Nunes, L. J. R.; Curado, A.; Lopes, S. I.; Appl. Sci. 2023, 13, 7460. [Crossref] 8. Pulinets, S.; Mironova, I.; Miklyaev, P.; Petrova, T.; Shitov, A.; Karagodin, A.; Atmosphere 2024, 15, 167. [Crossref] 9. World Health Organization (WHO); Handbook on Indoor Radon, a Public Health Perspective; Zeeb, H.; Shannoun, F., eds.; WHO: Geneve, 2009. [Link] accessed in April 2025 10. United States Environmental Protection Agency (US EPA), Radionuclide Basics: Radon, https://www.epa.gov/radiation/radionuclide-basics-radon, accessed in April 2025. 11. Brait, C. H. H.; Antoniosi Filho, N. R.; Quim. Nova 2010, 33, 7. [Crossref] 12. Souza, P. A. F.; Francisco, K. C. A.; Cardoso, A. A.; Quim. Nova 2017, 40, 1233. [Crossref] 13. Puukila, S.; Haigh, P.; Johnston, A.; Boreham, D. R.; Hooker, A. M.; Dixon, D. L.; J. Environ. Radioact. 2020, 220, 106295. [Crossref] 14. Damascena, K. F. R.; Amaral, R. S.; Santos Júnior, J. A.; Genezini, F. A.; da Silva, A. A.; Menezes, R. S. C.; J. Radioanal. Nucl. Chem. 2015, 304, 1053. [Crossref] 15. Santos Júnior, J. A.; Amaral, R. S.; Silva, C. M.; Menezes, R. S. C.; Radiat. Meas. 2010, 45, 861. [Crossref] 16. International Atomic Energy Agency (IAEA); Ray and Gamma-Ray Standards for Detector Calibration; IAEA: Viena, 1991. [Link] accessed in April 2025 17. Santos, J. M.; Santos Júnior, J. A.; Amaral, R. S.; Bezerra, J.; Fernandes, T.; Rojas, L.; Fernández, Z.; Araújo, E.; Azevedo, A.; Correia, F.; Milan, M.; Appl. Radiat. Isot. 2021, 178, 109948. [Crossref] 18. Alberigi, S.: Sobre a Influência de Fatores Ambientais nos Níveis de Radônio em Cavernas dos Parques Estaduais do Vale do Ribeira, no Estado de São Paulo e Avaliação do Equilíbrio do Fator Radioativo; Tese de Doutorado, Universidade de São Paulo, São Paulo, Brasil, 2011. [Crossref] 19. Xie, D.; Wang, C.; Yu, C. W.; Wang, H.; Indoor Built Environ. 2020, 30, 114. [Crossref] 20. Ramos, M. L.; Magalhães, M. R.; Silva, K. E.; Farias, E. E.; França, E. J.; Revista Brasileira Multidisciplinar 2023, 26, 1. [Crossref] 21. de Oliveira, M. S.: Avaliação dos Níveis de Concentração de Radônio em Águas de Poços, Rochas e Solos em Carambeí - PR; Dissertação de Mestrado, Universidade Tecnológica Federal do Paraná, Curitiba, Brasil, 2021. [Link] accessed in April 2025
Editor handled this article: Nelson H. Morgon |

On-line version ISSN 1678-7064 Printed version ISSN 0100-4042
Qu�mica Nova
Publica��es da Sociedade Brasileira de Qu�mica
Caixa Postal: 26037
05513-970 S�o Paulo - SP
Tel/Fax: +55.11.3032.2299/+55.11.3814.3602
Free access