
 |
 |
 |
 |
 |
Artigo
| Kinetic study of 1020 carbon steel corrosion in hydrochloric and nitric acid media |
|
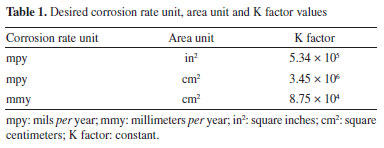
Fernando C. OliveiraI; Almir Silva NetoI I. Departamento de Metalurgia e Química, Centro Federal de Educação Tecnológica de Minas Gerais, 35180008 Timóteo - MG, Brasil Received: 11/13/2024 *e-mail: renata_seara@yahoo.com.br This study investigates the corrosion mechanism of 1020 carbon steel in strong acid solutions, relevant for industrial applications, using simple and effective laboratory methods. Direct (weight loss) and indirect (pH, ionic conductivity, open circuit potential and polarization curves) negotiations were performed to evaluate the corrosion rate in different concentrations of hydrochloric acid (HCl) and nitric acid (HNO3). In the HCl system, zero-order kinetics were confirmed (k = 10-5 min g-1), indicating a bottleneck in the corrosion mechanism, confirmed by electrochemical tests and metallographic analyses that showed uniform corrosion. In the HNO3 system, corrosion had first-order kinetics in the first 60 min (k = 10-2-10-3 min g-1), followed by passivation of the steel surface due to the presence of nitrate ions. These findings are particularly relevant for the acid pickling industry, where HCl is more stable, while HNO3 accelerates corrosion, requiring additional regulations. The results obtained are useful for the development of corrosion control and prevention strategies, contributing to increase the durability of materials and optimize the efficiency of industrial processes. INTRODUCTION Corrosion is a process in which the loss of essential properties of material (deterioration) occurs as a result of its chemical or electrochemical interaction with the environment.1-4 This process may compromise the mechanical and physical properties of equipment with serious economic5-8 and environmental impacts in all infrastructure sectors,9,10 such as roads, oil and gas pipelines,5-8 construction and water and sewage systems,11-13 causing severe damage and threats to public safety and health.14-17 In spite of remarkable advancement in the field of corrosion science and technology, the phenomenon of corrosion remains a major obstacle for industries all over the world.18,19 Though corrosion can be controlled by adapting suitable methods and highly corrosion-resistant materials, it accounts for additional expenditure. Thus, industries prefer the use of cheap metallic materials along with a suitable protection method, and the method selected for this purpose is based on its cost and performance in the field.19 Carbon steel (CS), due to its mechanical properties and low cost, is widely used in desalination plants, construction materials, pharmaceutical industry, thermal power plants, plating industries, oil refineries, automobiles, etc. The vast majority of steels used in pickling belong to the class of low carbon steels. In addition to carbon, these steels contain other alloying elements, such as Cu, Ni, Cr, Si and Ti, which can influence the pickling process. The magnitude of this influence varies according to the concentration of each of these elements in the steel. In general, the levels of these elements are low and, with some approaches, they exert little or no significant influence on the pickling time, depending on the element in question.19-21 In addition, CS has good mechanical and metallurgical properties which are essential for its fabrication for different applications.21 However, this material has low corrosion resistance, reducing the performance and useful life of engineering products. Therefore, it is necessary to apply methodologies that act against the corrosion process, for instance pre-treatments and corrosion inhibitors application.19-21 Excessive corrosion attack is known to occur on carbon steel surfaces deployed in service in aqueous acidic environments. Carbon steel is susceptible to different forms of corrosion inducted by chloride and so on.22,23 Hydrochloric and nitric acids are the most difficult to handle among common acids from the standpoints of corrosion and construction materials.24,25 Extreme care is required in the selection of materials to handle acids, even in relatively dilute concentrations or in process solutions containing appreciable amount of these acids. These acids are very corrosive to most of the common metals and alloys.24 Mild steel also finds an application for packaging in fluid industries, but its usage in acidic environments is restricted because of its susceptibility towards corrosion. Acid pickling is a technique frequently used to remove impurities and oxides from metal surfaces, and is essential in steel manufacturing processes and in industrial equipment maintenance operations. However, the application of strong fatty acids, such as HCl and HNO3, can cause accelerated manipulation of carbon steel, limiting its durability and operational efficiency. The pickling process consists of passing the strip through tanks containing acid, usually hydrochloric, although sulfuric, hydrofluoric and nitric are also used, with a temperature of around 80 ºC in the acid bath.25,26 HCl and HNO3 have an advantage over the other mineral acids in the acidification operation because it forms metal chlorides and nitrates, which are very soluble in the aqueous phase.26 However, the presences of chloride, sulfate and nitrate ions in aqueous media are particularly aggressive and accelerate corrosion.27 Knowing the reaction kinetics of these processes allows a more effective choice of method to combat corrosion. Reaction kinetics is the study of rates of the chemical processes and includes investigations of how different experimental conditions can influence the speed of a chemical reaction and yields information about the mechanism of the reaction and transition states, as well as the construction of mathematical models that can describe the characteristics of a chemical reaction.28 The rate of weight loss for a metal or alloy in the corrosion process can be described by Equation 1: 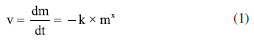 where: v is reaction rate, m is mass, t is time, x is partial order of reaction and k is the temperature-depending reaction rate constant, k (T).28 The rate of corrosion is the speed at which any given metal deteriorates in a specific environment. The rate, or speed, depends on environmental conditions as well as the type and condition of the metal. Corrosion rates determine the lifespan of metal-based structures. This reality dictates the choice of metals used for different purposes, and in different environments. It also determines the maintenance requirements for structures: a metal structure in a wet environment may require more frequent maintenance than a similar structure in a drier location.29-32 The simplest and longest-established method of estimating corrosion losses in plants and equipment is the weight loss analysis.29-32 A weighed sample of the metal or alloy under consideration is introduced into the process, and then removed after a reasonable time interval. The sample is then cleaned from all corrosion products and reweighed. The weight loss is converted to a corrosion rate (CR), according to Equation 2: 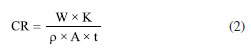 where: CR is corrosion rate, W is weight loss (g), ρ is sample density (g cm-3), A is exposed area of sample, t is time of exposure (h), and K is a constant which varies to calculate the corrosion rate in various units, see Table 1.
The technique requires no complex equipment or procedures, merely an appropriately shaped sample and a reliable means of removing corrosion product without disruption of the metal substrate. Weight loss measurement is still the most widely used means of determining corrosion loss, despite being the oldest method currently in use. Weight loss determination has a number of attractive features that account for its sustained popularity:
The method is commonly used as a calibration standard for other methods of corrosion monitoring, such as linear polarization and electrical resistance. In instances where slow response and averaging data are acceptable, weight loss monitoring is the preferred technique. This study analyzed the corrosion behavior of 1020 carbon steel in hydrochloric and nitric acid solutions at varying concentrations with the aim of better understanding the influence of these acids on the pickling process in the industrial sector. Using methods such as weight loss, pH, conductivity, open circuit potential (OCP) and polarization curve measurements to understand how the type and concentration of acid affect the corrosion mechanism of 1020 carbon steel.
EXPERIMENTAL Carbon steel sample preparation A sample of carbon steel 1020 (Usiminas) with a composition of 0.184% C, 0.037% Mn, 0.026% P, 0.021% S and rest being Fe was used for the studies. The samples were well and successively polished with SiC papers of P120, P180 and P220 grits, to achieve a smooth mild steel surface, and then washed thoroughly in distilled water. The polished surface was cleaned carefully with distilled water and acetone to expose the microstructure, remove polishing residuals and possible grease. After preparation and cleaning, the specimens were allowed to dry in air before further use. Corrosive medium (acid solutions) Different concentrations of aqueous HCl and HNO3 solutions were used as corrosion media to investigate the corrosion behavior of carbon steel substrates. The samples were exposed to 0.1, 0.25, 0.50, 1.00 and 2.00 mol L-1 solutions of HCl or HNO3, throughout different immersion times, at room temperature (20 ± 2 ºC). All reagents used in the study were analytical grade chemicals. Weight loss assays The corrosion of mild steel in acids solutions was investigated at room temperature using weight loss measurements, which were taken using the procedures and precautions described elsewhere.33,34 The test samples were suspended in the apparatus for complete immersion in the acid solutions. The exposure was observed for 180 min while the weight loss measurements were taken at every 5 min intervals using the electronic digital weighing balance Shimadzu, which has a sensitivity of 0.01 mg and a standard deviation of ± 0.02 mg. The weight of each sample was measured before immersion, and then measured after 5 min of immersion in the medium to obtain weight loss. The weight loss measurements were recorded at 5-min intervals until the complete immersion period, and the results obtained are presented in the form of cumulative weight loss. pH measurements The pH meter (Instrutherm, PH2600 model) equipped with a glass electrode combined with an external Ag/AgCl (3.0 mol L-1 KCl) reference electrode and calibrated with standardized buffer solutions (pH = 4.0, 7.0 and 9.0) was used to study the acidity of the corrosion medium throughout the weight loss assays. The combined glass electrode was thoroughly washed with distilled water before subsequently immersed in the respective acidic solutions. The readings were taken at the stable points of pH and these values were recorded at an interval of 5 min. Conductivity measurements The conductivity meter (Tecnopon, MCA150 model) calibrated with a standard solution (146.9 μS cm-1) was used to study the conductance of the corrosion medium. The conductivity cell was immersed in the distilled water and shaken before being subsequently immersed in the acid solution. The readings were taken at the stable points of the conductivity and these values were recorded at an interval of 5 min. Electrochemical measurements Electrochemical measurements were performed using a potentiostat/galvanostat equipment (Metrohm, model PGSTAT 128N) managed by Nova software, version 2.1.5. A three-electrode electrochemical cell was used, consisting of a carbon steel test specimen as the working electrode, a Pt plate as the counter electrode, and an Ag/AgCl (3.0 mol L-1 KCl) reference electrode. As a corrosive medium, HCl and HNO3 solutions with concentrations of 0.1, 0.25, 0.5, 1.0 and 2.0 mol L-1 were used. The potentiodynamic polarization curves were obtained by applying the linear sweep voltammetry (LSV) technique with a potential window of -0.8 to 0.0 V and a potential scan rate of 1.0 mV s-1. All polarization curve measurements were performed after measuring the open circuit potential (OCP) for 0.8 h to ensure its complete stabilization. Microstructural studies The microstructures of mild steel surfaces before and after immersion (at 5 and 30 min) were analyzed using an optical microscope (Kontrol, IM713 model). All micrographs of the specimen were taken at a magnification of 100× and 200×, respectively.
RESULTS AND DISCUSSION Kinetic study of corrosion in HCl medium Weight loss measurements have been identified as ideally good, as have other techniques for evaluating corrosion of metals in an immersion test. In this investigation, the weight loss method was used to assess the corrosion of mild steel samples in different acidic media. The cumulative weight loss of steel samples in HCl medium is provided in Figure 1.
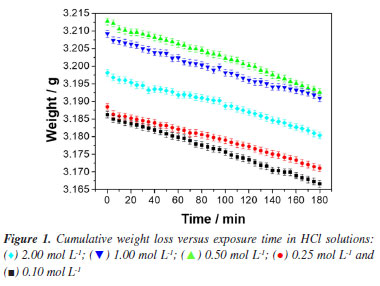
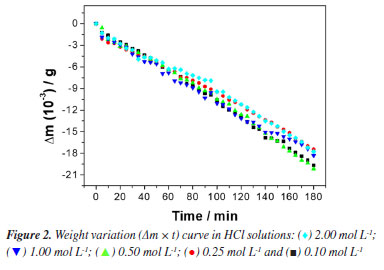
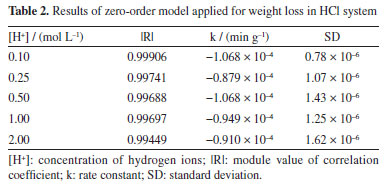
A general observation of the results in Figure 1 shows evident practically linear weight loss with exposure time and a similar progression pathway of cumulative weight losses for all the samples. This linear weight loss behavior observed for 1020 steel in hydrochloric acid solutions is reported in several studies.33-39 However, those studies generally evaluate the efficiency of new corrosion inhibitors and, therefore, the analysis of the results from the observed kinetic point of view is often omitted or not done. According to the weight loss results (Figure 1), it is proposed a zero-order kinetics mechanism to the 1020 carbon steel corrosion in HCl medium. Thus, by making x = 0 and integrating Equation 1, , the Equation 3 is obtained.  Therefore, by plotting Δm as a function of t a straight line must be obtained, whose slope is equal to the reaction rate constant, k, of the corrosive process. The difference between the initial and final weights was used to measure the weight loss during each interval period. Figure 2 shows the experimental results of weight loss adjusted to the proposed zero-order kinetic model (for a more detailed analysis, see the Supplementary Material). The module values of the correlation coefficients (|R|), rate constants (k) and their respective standard deviations (SD) are shown in Table 2. As can be seen, the experimental data could be perfectly described by the zero-order kinetic model, with correlation coefficients not less than 0.994.
Zero-order reactions generally occur when there is some kind of "bottleneck" in the mechanism, as in heterogeneous reactions, when the surface is saturated, and the subsequent reaction is slow.33-39 The following corrosion mechanism for iron and steel in HCl solution is proposed.39 The anodic metal dissolution occurs through the following reaction pathway, from 4 to 7. 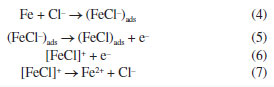 Cathodic hydrogen evolution reaction may be given by the reaction pathway from 8 to 10. 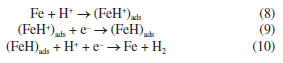 Both step 4 and step 8 involve the adsorption of ions on the metal surface, and due to the high concentrations of these ions, the metal surface quickly saturates, making the process independent of the mass or concentrations of the reactive species. Ionic conductivity and pH measurements were also performed to monitor the corrosive medium changes, Figure 3 (for a more detailed analysis, see the Supplementary Material). Figure 3a shows a linear decrease in ionic conductivity with time of attack of the corrosive medium on the steel surface, for all concentrations. These results are compatible with the proposed zero-order mechanism, since the consumption of H+ ions is observed in the cathodic reaction and the formation of Fe2+ ions in the anodic reaction. The ion diffusion coefficient of H+ ions in aqueous medium40 is 9.311 × 10⁻⁹ m2 s-1 whereas the ion diffusion coefficient of Fe2+ ions41 is 0.719 × 10⁻⁹ m2 s-1. This difference makes Fe2+ ions a less efficient charge carrier than H+ ions and, consequently, it was observed a decrease in the solution conductivity, as H+ ions are constantly consumed while Fe2+ ions are formed. As the replacement of H+ ions by Fe2+ ions are limited by the surface of the steel, we observed a linear behavior in the decrease of ionic conductivity. We chose not to submit the experimental data to the zero-order model due to the possibility of the analyzed ions participating in secondary reactions, e.g., Fe2+ → Fe3+ + e-, which could lead to inaccurate conclusions.
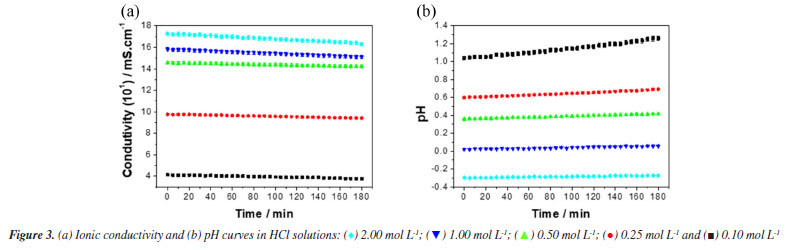
According to Figure 3b, the pH of the solution increased for all studied concentrations during the time that the steel sample was under attack by the medium. These results are compatible with steps 8 and 10 of the proposed kinetic mechanism. Step 8 provides the initial consumption of H+ ions due to their adsorption on the steel surface, (FeH+)ads. In step 10, (FeH)ads reacts with a free H+ ion generating molecular hydrogen. This proposed mechanism is compatible with the fact that the corrosion speed will be governed by the steel exposure area,42 which in this study was quickly saturated. Therefore, the corrosion to be observed must be uniform. Uniform corrosion is characterized by corrosive attack proceeding evenly over the entire surface area.40,41 This last aspect of 1020 carbon steel corrosion in HCl medium could be verified from the microstructural analysis of the samples. According to Figure 4a, a typical feature of these polarization curves was that the hydrogen evolution reaction (cathodic curve) was remarkably accelerated by increasing the HCl concentration. Figure 4b demonstrates that, for different concentrations of HCl, after 15 min, the potential values evolved towards stabilization.
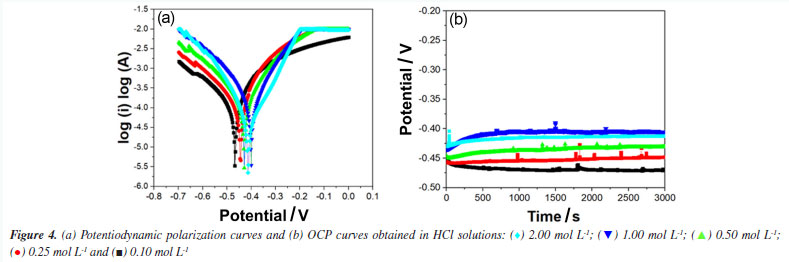
Table 3 illustrates the electrochemical results obtained from the potentiodynamic polarization curves recorded for carbon steel in hydrochloric acid. It is noted that at the highest concentration, HCl 2.00 mol L-1, there was a substantial increase in polarization resistance. This phenomenon is attributed to high concentrations of cathodic hydrogen, as illustrated in step 8, where the metal surface quickly becomes saturated due to the adsorption of these ions on the metal surface.
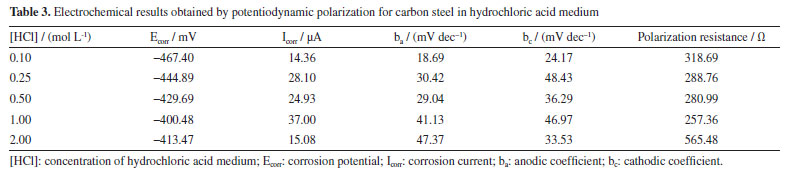
The corrosion current (Icorr) directly indicates the corrosion rate of 1020 carbon steel in the acidic medium. As the concentration of H+ increases in hydrochloric acid between 0.10 and 1.00 mol L-1, Icorr increases, reaching its highest value (37 µA) at 1.00 mol L-1, indicating that corrosion accelerates with the increase in H+ concentration. This behavior is expected, as higher concentrations of H+ provide more ions for the reduction reaction, facilitating metal dissolution.40,41 At 2.00 mol L-1, the Icorr decreases significantly to 15.08 µA, which may suggest that the corrosion process reaches a limiting or saturation point, possibly due to the formation of a protective layer or partial passivation, even in a strong acid medium like HCl. The corrosion potential (Ecorr) becomes less negative as the concentration of H+ increases up to 1.00 mol L-1, shifting from -467.40 mV at 0.10 mol L-1 to -400.48 mV at 1.00 mol L-1. This shift suggests a lower tendency for corrosion with the increase in H+, probably due to the enhanced H+ reduction reaction, which "balances" the anodic reaction of the steel. At 2.00 mol L-1, the Ecorr shifts slightly more negative again (-413.47 mV), which may indicate changes at the metal-solution interface, possibly due to the accumulation of Cl- ions on the surface, affecting the dissolution dynamics.42-44 Kinetic study of corrosion in HNO3 medium In stainless steel, passivation is performed to improve corrosion resistance. Traditionally, nitric acid is used in the passivation stage.44,45 However, studies reporting on the fundamentals of the corrosion of mild steel in environments with nitric acid are still scarce. The corrosion kinetics of mild steel samples in HNO3 solutions, as observed from Figure 5, was composed of two stages. The first stage was the corrosion initiation phase which is characterized by an exponential decrease in mass of sample, which started from the beginning of exposure time until the about 50-60 min of exposure.
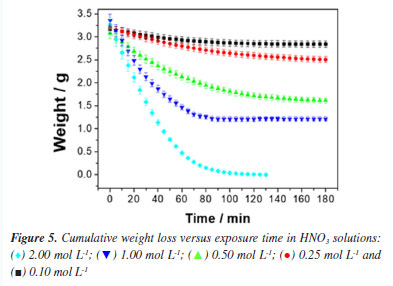
This exponential decrease in weight sample can be attributed to the mechanism of mild steel dissolution in a typical mineral acid, following a direct reduction of the hydrogen ions on the metal surface, which dissolution rate of this metal at the anodic site depends on the cathodic reaction, which can be summarized as shown in Equations 8-10. Therefore, a first-order kinetic model was assigned to this reaction stage. The second stage was the surface passivation initiation phase by nitrate ions45 which can be summarized as shown in Equations 11-13. 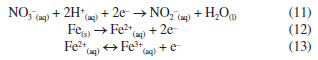 Under such conditions, the primary oxidized products were in the form of various iron oxides (Fe2O3, Fe3O4, a-FeOOH, b-FeOOH, c-FeOOH, etc.), which decreased the rate of electron transfer.44,45 Therefore, it is characterized by a decrease in weight loss of sample, which started from 60 min of exposure until 180 min of exposure observed. According to the weight loss results, first-order kinetics is proposed and, thus, by making x = 1 and integrating Equation 1,  Therefore, plotting ln(m/m0) as a function of t should provide a straight line whose slope is equal to the reaction rate k of the corrosive process. Figure 6 shows the experimental results of weight loss adjusted to the first-order kinetic models (for a more detailed analysis, see the Supplementary Material). The module values of the correlation coefficients (|R|), the rate constants (k) and their respective standard deviations (SD) are shown in Table 4.
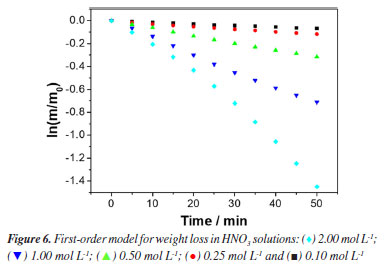
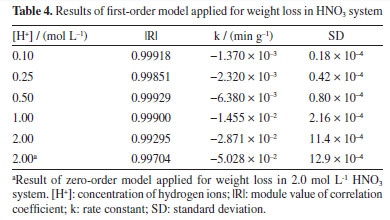
The results observed in Figure 6 and Table 4 show that for all concentrations the experimental data fit well with a first-order kinetics model. However, for the 2.00 mol L-1 concentration, a zero-order model was also proposed, which presented a slightly improved correlation coefficient. This observation can be correlated with the fact that, at high concentrations, the steel surface becomes saturated. As performed in the HCl case, the corrosive process taking place in HNO3 medium was also monitored by ionic conductivity and pH measurements. The data recorded in this case are provided in Figure 7 (for a more detailed analysis, see the Supplementary Material).
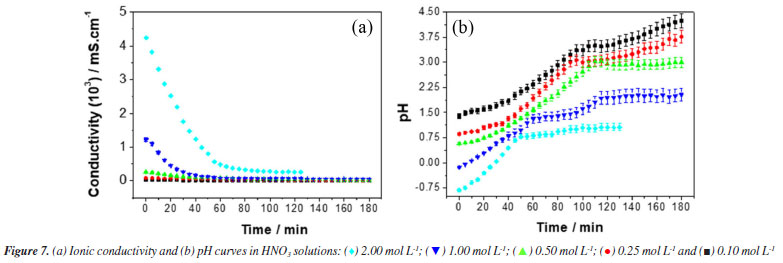
Figure 7a shows an exponential decay of ionic conductivity in the first 60 min of exposure of steel to corrosive medium (HNO3), in all studied concentrations. This decrease in ionic conductivity was attributed to the difference in the ionic diffusion coefficient between H+ and Fe2+ ions.40,41 After this initial period, the ionic conductivity remains practically unchanged, which we attribute to the passivation of the steel by nitrate ions.44,45 These results corroborate those observed in the weight loss experiments. The evolution of pH with the time of exposure of the steel to the corrosive medium containing HNO3 solutions in various concentrations is shown in Figure 7b. For the concentrations of 0.10, 0.25 and 0.50 mol L-1 an exponential increase in pH is observed up to approximately 100 min. At this point, an inflection occurs, and the pH continues to increase much more slowly. For concentrations of 1.00 and 2.00 mol L-1, two inflections are observed: one at 60 min and another at 100 min. These inflections were attributed to the formation of the passivation layer on the steel surface due to the presence of nitrate ions.44,45 According to Figure 8a, a notable characteristic of these polarization curves is that the hydrogen evolution reaction (cathodic curve) was significantly accelerated with increasing HNO3 concentration. Figure 8b illustrates that, after 15 min, the potential values for various HCl concentrations evolved towards stabilization.
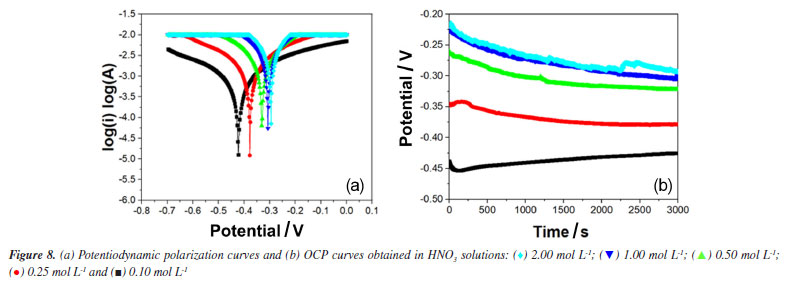
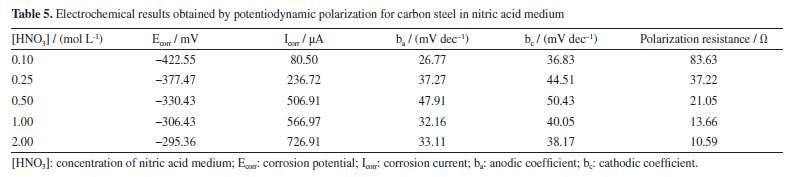
Table 5 illustrates the electrochemical results obtained by potentiodynamic polarization for carbon steel in nitric acid. It is observed that with the increase in nitric acid concentration, there is a reduction in polarization resistance, which is quite comparable to the results obtained by the previously discussed techniques. The corrosion current (Icorr) increases with the concentration of HNO3, especially in the first minutes of exposure, indicating rapid and active corrosion. For concentrations between 0.10 and 0.50 mol L-1, Icorr rises from 80.50 µA at 0.10 mol L-1 to 506.91 µA at 0.50 mol L-1, suggesting an accelerated initial corrosion process. For concentrations between 1.00 and 2.00 mol L-1, Icorr reaches 726.91 µA at 2.00 mol L-1. However, mass loss data indicate that the formation of a passive layer occurs after this period of intense corrosion, reducing the progression of corrosion in the longer term. The corrosion potential (Ecorr) shifts to less negative values as the concentration of HNO3 increases. This shift, from -422.55 mV at 0.10 mol L-1 to -295.36 mV at 2.00 mol L-1, initially indicates a higher corrosion tendency driven by increased H+ and NO3- ions. However, this movement toward less negative potentials can also be related to surface stabilization of the steel as the passive layer forms, indicating a reduction in the reactivity of the metal surface.44,45 Anodic coefficient (ba) shows an initial increase from 26.77 mV dec-1 at 0.10 mol L-1 to 47.91 mV dec-1 at 0.50 mol L-1, followed by a decrease at higher concentrations. This pattern reflects the onset of passive layer formation, which reduces the active dissolution rate of the metal and, thus, the current response to potential. Cathodic coefficient (bc) follows a similar behavior, suggesting that the reduction of H+ and NO3- ions is initially intense but, after passive layer formation, the cathodic reactions are limited due to reduced availability of reactive sites on the metal surface.
Metallographic analysis Figures 9 and 10 depict the typical metallographic images for the assessed steel samples, in the cross-section made to the longitudinal direction of the sample. Thereby, it becomes possible to observe the attacked surface in the transversal direction to the radial corrosion development taken place in the length of the sample. A general uniformity is notable in the structures present in the assessed samples, identifying them as the characteristic phases of 1020 steel: ferrite α (light-colored phase), perlite (smaller dark-colored phase) and carbides (bigger dark-colored phase).44,45 The attacked surface is evident, with no evidence of intergranular corrosion.
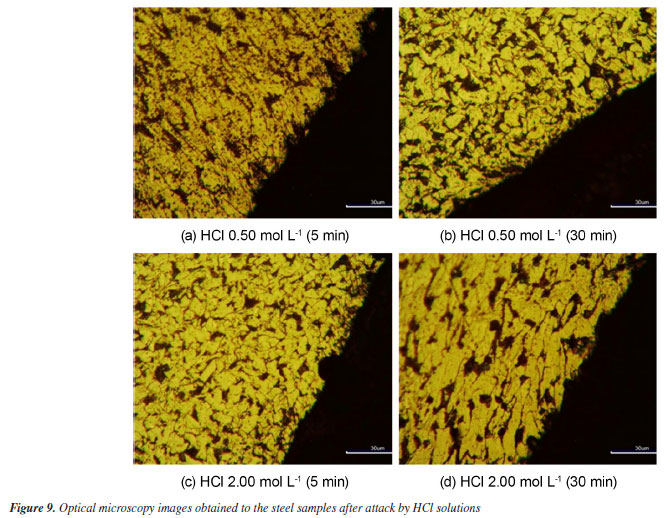
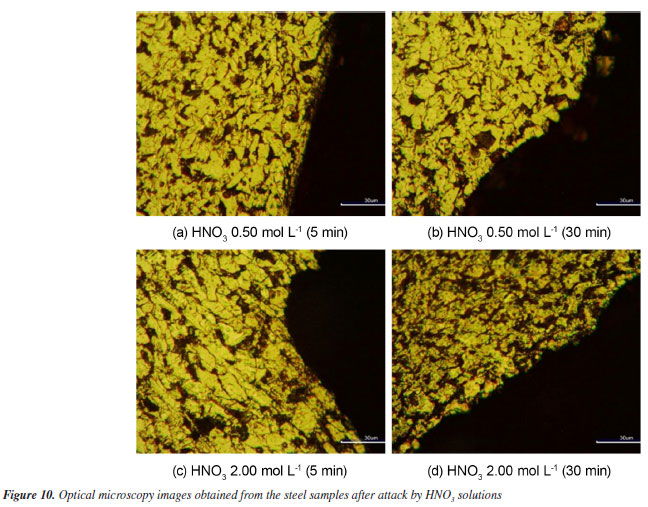
Figure 9 demonstrates that neither the exposure time nor the variations in the concentration of the acid solutions caused significant changes in the morphological characteristics of the corroded surfaces. In other words, regardless of the contact time of the material with the solutions or the acid concentration, the morphology of the corroded surface remains quite uniform. This indicates that the corrosion dynamics did not undergo major variations with the increase in the exposure time or concentrations, indicating relatively stable corrosion behavior under the experimental conditions. Additionally, the results obtained indicate that, in the acid pickling process, the exposure time plays a critical role in obtaining a metal surface with uniform morphological characteristics. It was observed that prolonged exposures do not promote significant improvements in the removal of oxides or impurities, and may even compromise the surface integrity of the material. Thus, shorter exposure times proved to be more effective, promoting controlled and homogeneous pickling, as evidenced in the micrographs presented. Figure 10, however, depicts an alteration in the attacked surface, which had its rugosity increased as exposure time went by. This behavior was best observed in the 0.50 mol L-1 concentration. Nevertheless, morphological variation in the assessed surface related to changes in concentration could not be observed in the metallographic images. Comparing Figures 9c and 10c of the two samples that were put under the same concentrations at the same time intervals for both kinds of acids in study and as indicated in Figure 10b, HNO3 seems to operate as a solvent to the cementite contained in the perlite. Therefore, the phenomenon of solubility may be the reason why the corrosion rate for HCl differs from the observed in HNO3, which has its reaction order increased. The increase in the contact surface of the steel, due to solubility of cementite phase by the HNO3 medium, could prevent the occurrence of saturation of steel surface, differently from the observed in HCl solution.
CONCLUSIONS In this study, the corrosion kinetics of carbon steel 1020 was investigated in corrosive media of HCl and HNO3 at concentrations of 0.10, 0.25, 0.50, 1.00 and 2.00 mol L-1 by means of mass loss, pH and ionic conductivity tests. The results obtained demonstrated that higher acid concentrations led to a significant increase in the corrosion rate, with notable differences between the two acids used. HCl presented a more stable corrosion behavior, while HNO3, when dissolving the cement present in the perlite, demonstrated a more intense traction of the corrosion rate, especially at higher concentrations. An electrochemical analysis, performed by means of potentiodynamic polarization curves and open circuit potentials, corroborated the findings of the mass loss tests, revealing a greater intensity of attack in the HNO3 solutions, reflecting an increase in the order of occurrence of corrosion. The polarization curves indicated that, over time, the potentials stabilized for all concentrations tested, while HCl had a more passivating effect on the steel surface, resulting in less variation in corrosion variations. A morphological analysis of the surfaces subjected to corrosion, performed by optical microscopy, revealed an increase in roughness with the exposure time, mainly in the HNO3 concentrations. The metallographic images showed an increase in roughness and depth of attack with the immersion time, especially in the nitric acid solutions, which dissolved the cement and exposed a larger metal area to the corrosive attack. Although the increase in roughness was evident, no significant morphological variation was observed in relation to the different acid concentrations, demonstrating that the exposure time has a greater impact on the corrosion characteristics than the acid concentrations. Finally, the construction of mathematical models to describe the chemical reactions observed in the corrosion processes proved to be promising, allowing a better understanding of the corrosion dynamics and contributing to the prediction of the corrosion rate as a function of the experimental parts, such as acid concentration and exposure time. Models based on first-order kinetics and electrochemical observations helped to elucidate the mechanisms underlying the corrosion behavior, providing a quantitative approach to the study of carbon 1020 corrosion. In summary, this work resulted in an in-depth understanding of the corrosion behavior of carbon 1020 steel in HCl and HNO3 solutions, highlighting the influence of acid concentrations, exposure time and the microstructural composition of the material on the corrosion process. These results are particularly relevant for industry, especially in the context of acid pickling, where the use of strong acids such as HCl and HNO3 is common to remove impurities and oxides from metal surfaces. The comparison between the two fatty acids demonstrates that, although HCl is more stable and less aggressive, HNO3 accelerates the corrosion process, especially at higher concentrations, which can be advantageous in certain pickling applications, but also requires additional precautions to minimize damage to the material. The information obtained can serve as a basis for the development of corrosion control and prevention strategies that can be used in industrial processes involving acid pickling, increasing the durability of materials and improving process efficiency.
SUPPLEMENTARY MATERIAL Complementary material for this work (experimental data on weight loss, pH, conductivity, and modeling of weight loss in HCl and HNO3 media) is available at http://quimicanova.sbq.org.br/, as a PDF file, with free access.
DATA AVAILABILITY STATEMENT All data are available in the text.
ACKNOWLEDGMENTS The authors are grateful to Conselho Nacional de Desenvolvimento Científico e Tecnológico (CNPq, grant No. 401977/2023-4) and Fundação de Amparo à Pesquisa do Estado de Minas Gerais (FAPEMIG, grants No. APQ0008321, APQ-03113-22 and APQ-03572-23) for the financial support.
REFERENCES 1. Sharma, S. K.; Peter, A.; Obot, I. B.; J. Anal. Sci. Technol. 2015, 6, 26. [Crossref] 2. Ikeuba, A. I.; Omang, B. J.; Bassey, V. M.; Louis, H.; Agobi, A. U.; Ntibi, J. E.; Asogwa, F. C.; Results Chem. 2022, 4, 100543. [Crossref] 3. Sundaram, R. G.; Vengatesh, G.; Sundaravadivelu, M.; Surf. Interfaces 2021, 22, 100841. [Crossref] 4. Udowo, V. M.; Yang, M.; Liu, F. A.; Ikeuba, I.; Corros. Eng., Sci. Technol. 2023, 58, 549. [Crossref] 5. Verma, C.; Haque, J.; Quraishi, M. A.; Ebenso, E. E.; J. Mol. Liq. 2019, 275, 18. [Crossref] 6. Obot, I. B.; Onyeachu, I. B.; Umoren, S. A.; Quraishi, M. A.; Sorour, A. A.; Chen, T.; Aljeaban, N.; Wang, Q.; J. Pet. Sci. Eng. 2020, 185, 106469. [Crossref] 7. Obot, I. B.; Solomon, M. M.; Umoren, S. A.; Suleiman, R.; Elanany, M.; Alanazi, N. M.; Sorour, A. A.; J. Ind. Eng. Chem. 2019, 79, 1. [Crossref] 8. Zeng, Y.; Li, K.; Corros. Sci. 2020, 165, 108404. [Crossref] 9. Cao, Q.; Pojtanabuntoeng, T.; Esmaily, M.; Thomas, S.; Brameld, M.; Amer, A.; Birbilis, M.; Metals 2022, 12, 561. [Crossref] 10. Vidal, F.; Vicente, R.; Silva, J. M.; Journal of Cultural Heritage 2019, 37, 273. [Crossref] 11. Zhu, Y.; Chen, L.; Xiao, H.; Shen, F.; Deng, S.; Zhang, S.; He, J.; Song, C.; Wang, X.; Zhang, J.; Gong, L.; Hu, C.; J. Environ. Sci. 2020, 88, 273. [Crossref] 12. Hu, J.; Dong, H.; Xu, Q.; Ling, W.; Qu, J.; Qiang, Z.; Water Res. 2018, 129, 428. [Crossref] 13. Wu, M.; Wang, T.; Wu, K.; Kan, L.; Constr. Build. Mater. 2020, 239, 117813. [Crossref] 14. Njoku, C. N.; Enendu, B. N.; Okechukwu, S. J.; Igboko, N.; Anyikwa, S. O.; Ikeuba, A. I.; Onyeachu, I. B.; Etim, I. I. N.; Njoku, D. I.; Results Chem. 2023, 18, 101183. [Crossref] 15. Ikeuba, A. I.; Ntibi, J. E.; Okafor, P. C.; Ita, B. I.; Agobi, A. U.; Asogwa, F. C.; Omang, B. J.; Eno, E. A.; Loius, H.; Adalikwu, S. A.; Abiola, B. A.; Abeng, F. E.; Abang, N. A.; Results Chem. 2023, 5, 100909. [Crossref] 16. Zhang, F.; Ju, P.; Pan, M.; Zhang, D.; Huang, Y.; Li, G.; Li, X.; Corros. Sci. 2018, 144, 74. [Crossref] 17. Barreto, L. S.; Tokumoto, M. S.; Guedes, I. C.; Melo, H. G.; Amado, F. D. R.; Capelossi, V. R.; Rev. Mater. 2017, 22, e11852. [Crossref] 18. Thakur, A.; Kumar, A.; Journal of Bio- and Tribo-Corrosion 2021, 7, 67. [Crossref] 19. Vinutha, M. R.; Venkatesha, T. V.; Port. Electrochim. Acta 2016, 34, 157. [Crossref] 20. Gu, S.; Shi, H.; Zhang, C.; Wang, W.; Liu, F.; Han, E. H.; Prog. Org. Coat. 2021, 158, 106376. [Crossref] 21. Bouanis, M.; Tourabi, M.; Nyassi, A.; Zarrouk, A.; Jama, C.; Bentiss, F.; Appl. Surf. Sci. 2016, 389, 952. [Crossref] 22. Rios, E. C.; Zimer, A. M.; Pereira, E. C.; Mascaro, L. H.; Electrochim. Acta 2014, 124, 211. [Crossref] 23. Nwokolo, I. K.; Shi, H.; Ikeuba, A. I.; Gao, N.; Li, J.; Ahmed, S.; Liu, F.; Coatings 2022, 12, 1288. [Crossref] 24. Ferkous, H.; Djellali, S.; Sahraoui, R.; Benguerba, Y.; Behloul, H.; Çukurovali, A.; J. Mol. Liq. 2020, 307, 112957. [Crossref] 25. Whillock, G. O. H.; Worthington, S. E.; Abdullahi, A. A.; Reference Module in Materials Science and Materials Engineering 2017, 2, 1250. [Crossref] 26. Afolabi, A. S.; Muhirwa, A. C.; Abdulkareem, A. S.; Muzenda, E.; Int.J. Electrochem. Sci. 2014, 9, 5895. [Link] accessed in July 2025 27. Ma, H. Y.; Yang, C.; Li, G. Y.; Guo, W. J.; Chen, S. H.; Luo, J. L.; Corrosion 2003, 59, 1112. [Crossref] 28. Levine, I. N.; Physical Chemistry, 6th ed.; McGraw-Hill: New York, 2009. 29. Pearson, P.; Cousins, A. In Absorption-Based Post-Combustion Capture of Carbon Dioxide; Feron, P. H. M., ed.; Woodhead Publishing: Cambridge, 2016, p. 439. [Crossref] 30. Speight, J. G.; Oil and Gas Corrosion Prevention 2014, 6, 109. [Crossref] 31. Chen, X. H.; Chen, C. S.; Xiao, H. N.; Cheng, F. Q.; Zhang, G.; Yi, G. J.; Surf. Coat. Technol. 2005, 191, 351. [Crossref] 32. Ashassi-Sorkhabi, H.; Ghalebsaz-Jeddi, N.; Hashemzadeh, F.; Jahani, H.; Electrochim. Acta 2006, 51, 3848. [Crossref] 33. Nadi, I.; Belattmania, Z.; Sabour, B.; Reani, A.; Sahibed-dine, A.; Jama, C.; Bentiss, F.; Int. J. Biol. Macromol. 2019, 141, 137. [Crossref] 34. Barker, R.; Pickles, B.; Hughes, T. L.; Barmatov, E.; Neville, A.; Electrochim. Acta 2020, 338, 135877. [Crossref] 35. Amin, M. A.; El-Rehim, S. S. A.; El-Sherbini, E. E. F.; Bayoumi, R. S.; Electrochim. Acta 2007, 52, 3588. [Crossref] 36. El-Etre, A. Y.; Ali, A. I.; Chin.J. Chem. Eng. 2017, 25, 373. [Crossref] 37. Singh, A. K.; Quraishi, M. A.; Corros. Sci. 2010, 52, 152. [Crossref] 38. McCall, D. W.; Douglass, D. C.; J.Phys. Chem. 1965, 69, 2001. [Crossref] 39. Amira, S.; Spångberg, D.; Probst, M.; Hermansson, K.; J.Phys. Chem. B 2004, 108, 496. [Crossref] 40. Makhlouf, A. S. H.; Herrera, V.; Muñoz, E.; Handb. Mater. Failure Anal. Case Stud. Chem., Concr. Power Ind. 2018, 6, 107. [Crossref] 41. Wu, K. Y.; Mosleh, A.; J. Nat. Gas Sci. Eng. 2019, 69, 102930. [Crossref] 42. Tait, W. S.; Handb. Environ. Degrad. Mater. 2018, 27, 583. [Crossref] 43. Parsons, S.; Poyntz-Wright, O.; Kent, A.; McManus, M. C.; Materials Today Sustainability 2019, 3-4, 100005. [Crossref] 44. Liu, Y.; Wang, J.; Sci. Total Environ. 2019, 671, 388. [Crossref] 45. Maharjan, N.; Zhou, W.; Wu, N.; Surf. Coat. Technol. 2020, 385, 125399. [Crossref]
Associate Editor handled this article: Eduardo M. Richter |

 , Equation 14 is directly deduced:
On-line version ISSN 1678-7064 Printed version ISSN 0100-4042
Qu�mica Nova
Publica��es da Sociedade Brasileira de Qu�mica
Caixa Postal: 26037
05513-970 S�o Paulo - SP
Tel/Fax: +55.11.3032.2299/+55.11.3814.3602
Free access