Artigo
| Photocatalytic water splitting using the semiconductor heterojunction between MoO3-X/CDS |
|
Felipe L. N. SousaI; Luana B. C. OliveiraI,II; Lizeth Carolina MojicaI; Leonardo J. L. MacielI; Wellington de Souza FerreiraI,II; I. Centro de Tecnologias Estratégicas do Nordeste (CETENE), 50740-540 Recife - PE, Brasil Received: 04/01/2024 *e-mail: giovanna.machado@cetene.gov.br It is essential to diversity energy sources for ensuring sustainability. While hydrogen is considered a promising energy storage medium, its potential hinges on the development of efficient photocatalysts for green production. In addressing this challenge, we evaluated the performance of a heterojunction system composed of non-stoichiometric molybdenum oxides (MoO3-x) and cadmium sulfide (CdS) quantum dots (QDs) for water splitting. MoO3-x were synthesized via gamma irradiation of the MoO3 in the presence of formic acid (FA), while CdS-MPA QDs were electrosynthesized. The heterojunction was formed through adsorption. The structural and electronic characterization revealed a progressive transformation from MoO3 to MoO3-x and MoO3-x/CdS-MPA QDs, demonstrating enhanced water-splitting performance. Upon evaluation, the study revealed a charge transfer mechanism, highlighting the significance of relative band positions between MoO3-x and CdS-MPA QDs in promoting eco-friendly hydrogen evolution and methanol processing. Thus, we suggest that the synergism between MoO3-x and CdS-MPA QDs semiconductors makes the heterojunction system a promising solution for photocatalytic production of hydrogen and oxygen. INTRODUCTION Obtaining green hydrogen (H2) through photocatalytic water splitting is a promising strategy for establishing eco-friendly power solutions.1,2 The use of sunlight as the primary energy source for photocatalysis aligns with green chemistry principles, which emphasize using environmentally benign processes and renewable resources to address energy needs.1 Complementing technologies for energy transition combine the efficient use of surfaces with low cost.3 Furthermore, it offers the opportunity to take advantage of cathodic (hydrogen evolution reaction, HER) and anodic reactions (oxygen evolution reaction, OER), where the generated oxygen can be used in alternative chemical processes or as the primary source for medicinal applications.4 Numerous semiconductor materials have been used for hydrogen generation by water splitting. Nonetheless, the efficacy is limited by factors such as physicochemical stability, kinetic considerations related to adsorption and mechanisms, and the precise positioning of conduction bands relative to the hydrogen reduction potential.5,6 For efficient charge transfer and reactions in the electrochemical redox couple, the conduction band of the photocatalysts must be positioned more negatively than the potential of the H+/H2 reduction line, regardless of the pH. This ensures that the charge transfer process is thermodynamically spontaneous. Furthermore, the anodic reaction in the photocatalytic water splitting cycle involves water oxidation and oxygen formation. The oxygen evolution reaction (OER) is frequently considered a rate-limiting step due to the slow kinetics at the semiconductor-solution interface, where four electrons (4e–) are required to recover the electron holes from the semiconductor (H2O|O2 + 4H+).7,8 Therefore, accelerating oxygen generation intrinsically enhances hydrogen production efficiency. Another challenge lies in the solar radiation absorption region. Most semiconductors with remarkable performance have a bandgap greater than 2.9 eV, which corresponds to radiation absorption with a wavelength (λ) shorter than 400 nm. This data translates to only capturing about 5% of the incident solar energy. The majority of radiation incident on the surface occurs in the visible (400 < λ < 780 nm, ~ 43%) and infrared (λ > 780 nm, ~ 52%) regions.9,10 Therefore, strategies involving the creation of heterostructures between semiconductors and metallic nanoparticles are implemented. These strategies aim to enhance both the efficiency of charge transfer and the absorption region. Furthermore, the formation of heterojunctions between semiconductors, carefully tailored for optimal band positioning, is crucial in ensuring efficient charge transfer processes. There are several approaches to extending the absorption spectrum, one of which involves the formation of non-stoichiometric transition metal oxides. Molybdenum oxide (MoO3) is ineffective as a semiconductor for hydrogen production due to its unfavorable relative band positioning, with a conduction band (CB) at 0.294 V and a valence band (VB) at 3.494 eV vs. NHE (normal hydrogen electrode). However, partially reduced molybdenum oxide exhibits coexistence of ions with different Mo5+/Mo6+ oxidation states () and oxygen vacancies (). These features improve charge transfer efficiency and broadening the spectral absorption region, enabling more effective water-splitting reactions.11,12 Various methods were applied to obtain reduced oxides, such as traditional methods of reduction in an H2 atmosphere and high temperatures,13 hydrothermal,14 the “sauna reaction” with the in situ formation of H2/CO,15 exfoliation in an aqueous medium under reflux,16 and the bottom-up synthesis of a Mo target via laser ablation.17 Among these methods, gamma irradiation stands out for its controlled reduction and versatility. This process offers a rational approach for producing partially reduced oxide from MoO3.18 The interaction between gamma radiation and MoO3, particularly in the presence of formic acid (FA), leads to the formation of radicals that can spontaneously reduce or oxidize species in situ.19 These radiation-induced radicals and the slight water content in the FA solution promote the generation of potentially reducing species, triggering a series of reactions that culminate in the production of the desired reduced oxide. Cadmium sulfide (CdS) stands out as a promising candidate for heterojunction formation due to its favorable band gap of 2.4 eV, ideal for efficient light harvesting.20,21 However, photocorrosion due to non-replacement of electrons in the valence band limits the application of CdS. Nonetheless, combining CdS quantum dots (QDs) with the MoO3-x semiconductor holds the promise of enhancing synergistically visible-light absorption capability, charge carrier separation, photocatalytic performance, and photostability to address this issue. The balance between the relative positions of bands and the control of charge donor and acceptor states allows for efficient charge transfer and efficient systems for hydrogen generation. Wu and co-authors22 explore the amalgamation of MoO3-x with CdS nanospheres to improve photocatalytic performance and photostability, exploiting the oxygen-deficient sites of MoO3-x as the charge carrier recombination center. While the authors proposed a mechanism underlying the process, investigating further strategies to enhance MoO3-x through various methods is crucial for a more comprehensive understanding. In this study, we present the photocatalytic properties for hydrogen generation using MoO3-x and CdS QDs. MoO3-x was synthesized by gamma irradiation in the presence of formic acid (FA), while CdS quantum dots stabilized by 3-mercaptopropionic acid (MPA) were obtained through electrosynthesis. Additionally, 3-mercaptopropionic acid served as a linker between (2D) MoO3-x and (0D) CdS-MPA QDs, where the hierarchy between 2D/0D semiconductors was evaluated for splitting water. The microstructure and interfaces of the resulting non-stoichiometric oxide and the formation of the semiconductor heterojunction were thoroughly characterized. Compared to pure MoO3 and MoO3-x, the MoO3-x/CdS heterojunction photocatalyst demonstrated an improved separation efficiency of photogenerated electron-hole pairs, leading to enhanced photocatalytic activity for hydrogen evolution. As a result, hydrogen generation is increased from the MoO3 to MoO3-x (H2: 8.3 μmol/O2: 300 μmol) and MoO3-x/CdS (H2: 35 μmol/O2: 1100 μmol) under solar irradiation of 100 mW cm-2 and AM 1.5 G filter.
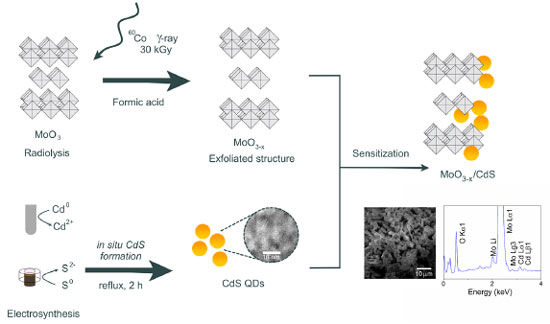
EXPERIMENTAL Materials All chemicals were of reagent grade and were used without further purification. Molybdenum trioxide (α-MoO3 ≥ 99.99%), formic acid (FA, technical grade, 85%), sodium sulphate (Na2SO4, ≥ 99.0%), Nafion® solution, elemental sulfur (S0, 100 mesh powder), graphite powder (particle size < 20 μm), 3-mercaptopropionic acid (MPA, 99%), and hydrochloric acid (37%) were purchased from Sigma-Aldrich (Saint Louis, USA). Cadmium bar (Cd, 99.9%) was purchased from Goodfellow (Coraopolis, USA). Sodium chloride (NaCl, 99%), sodium hydroxide (NaOH), ethanol (EtOH, 99.5%), lactic acid (99.0%), and isopropanol (99.5%) were purchased from Dinâmica (Indaiatuba, Brazil). Extran® MA 01, alkaline, was acquired from Merck (Rio de Janeiro, Brazil). Aqueous solutions were prepared with deionized water (17.3 Ω cm-1) (Milli-Q® EQ 7000 system, Germany). MoO3-x production The synthesis of the MoO3-x nanoparticles was carried out using gamma-ray irradiation, as described by Lima et al.23 In a typical procedure, 0.5 mmol of α-MoO3 dispersed in 5 mL of FA was placed in a sealed glass tube flask. The samples underwent irradiation within a 60Co γ-cell cobalt irradiator (Radionics Laboratory, Scotch Plains, USA) under electronic equilibrium conditions, receiving a 30 kGy dose. This procedure results in bluish-gray powder samples, characteristic of reduced molybdenum oxides. The MoO3-x were centrifuged at 6000 rpm for 15 min, followed by three washes with isopropanol. Then, the solid was dried in a woven apparatus at 60 ºC for 4 h in a nitrogen atmosphere. CdS-MPA electrosynthesis CdS-MPA QDs were synthesized using an electrochemical cavity cell (Figure 1S, presented in Supplementary Material), according to the methodology described by Costa et al.24 The cavity cell is divided into cathodic, central, and anodic compartments. The cathodic compartment, dedicated to the in situ elemental sulfur (S0) reduction to sulfide (S2-), was filled with 50 mg (4.2 mmol) of carbon powder and 1.6 mg (0.05 mmol) of sulfur and pressed under 3.2 kg cm-2, forming the macroelectrode (cathode). The cathodic compartment was separated from the central compartment using sintered glass previously sonicated with a NaCl solution (0.2 mol L-1), to decrease the liquid junction potential. The central compartment was then filled with an aqueous solution of MPA (0.3 mmol L-1) and NaCl (0.2 mol L-1). A cadmium bar was used as anode, generating Cd2+ ions through electro-oxidation. This procedure led to Cd-MPA complexes forming, followed by CdS-MPA nuclei creation in the central compartment. After electrosynthesis, the CdS-MPA quantum dots nuclei were heated under reflux for 2 h to promote particle growth. Embedding of CdS-MPA QDs on MoO3-x The process followed the procedure reported in previous works.24 CdS-MPA QDs were embedded on the MoO3-x surface by mixing 100 mg of MoO3-x with 5 mL of the CdS-MPA colloidal solution, under stirring for 30 min. Quick adsorption of the QDs on the MoO3-x surface was observed, where the supernatant becomes clear without the presence of quantum dots. The MoO3-x/CdS heterostructure was centrifuged, and the supernatant was removed. The solid (dark gray color) was washed three times with ultra-pure water. Then, another 5 mL of QDs were added to the composite, which was kept under stirring for 30 min. The final composite was isolated as previously described, washed three times with ultra-pure water and acetone, and dried under a high vacuum for 1 h. The entire synthetic process is depicted in Figure 1.
Photocatalytic hydrogen generation Photocatalytic hydrogen was generated in a jacketed quartz reactor with separate outlets for purging and gas collection (Figure 2S, presented in Supplementary Material). The irradiation was generated using a Newport simulator (model 69907, Xe lamp 150 W) (Irvine, USA) with an AM 1.5 G filter (81094) to ensure a power density of 100 mW cm-2. A photodiode with a known responsiveness facilitated the adjustment of this value. To decrease the concentration of dissolved oxygen and air in the unoccupied volume of the reactor, it was purged with argon (Ar) for 20 min. Then, 20 mg catalyst and 20 mL of aqueous methanol solution (with a concentration of 10% v/v) were placed into the reactor. An Agilent model 7820A GC System (Santa Clara, USA) with an HP-Molsieve and HP-Plot Q, both with column (30 m) and equipped with a thermal conductivity detector (TCD), was used to measure the quantity of gasses produced during photoelectrocatalysis. The photoelectrochemical productions were conducted in shifts lasting 240 min, with aliquots of 450 μL collected every 30 min using a Hamilton 1750SL gas-tight syringe (Reno, USA). Photoelectrochemical characterization For photoelectrochemical measurements, photoanodes were prepared using MoO3, MoO3-x and MoO3-x/CdS-MPA QDs deposited on conductive transparent metal oxide (FTO glass, fluorine-doped tin oxide). FTO glasses (1.0 × 2.0 cm) underwent a three-step cleaning process using Extran® 10% (v/v), deionized water, and isopropanol. The cleaning was performed in an ultrasonic bath (Ecosonics, model Q3.0/40A) for 10 min for each solvent. A polyimide tape was used to demarcate the FTO region (1 cm-2) to be deposited the MoO3, MoO3-x and MoO3-x/CdS-MPA QDs. The ethanoic-based ink, containing a catalyst and Nafion® (5% v/v), was formulated to achieve a final concentration of 10 mg mL-1. The deposition of the ink was carried out using blade coating (Bladecoater BCC-02, Autocoat, São Paulo, Brasil) at a rate of 5 mm s-1, with a plate temperature set at 80 ºC. The photoelectrochemical measurements were carried out on Autolab-PGSTAT302N potentiostat/galvanostat, software NOVA 2.1.6, (Metrohm, Utrecht, Netherlands). A conventional three-electrode setup was employed, featuring an FTO/catalyst-based working electrode, an Ag/AgCl electrode (immersed in a 3.5 mol L-1 KCl solution) serving as the reference electrode, and a Pt wire functioning as the cathode. A previously deaerated 0.5 mol L-1 Na2SO4 solution (pH 6.5) was utilized as the supporting electrolyte in all photoelectrochemical measurements. The applied external potential of 1.23 V vs. reference hydrogen electrode (RHE) was determined by the Nernst equation, considering the Ag/AgCl (3.5 mol L-1 KCl) reference electrode:  where: V(Ag/AgCl) = 0.197 V and Vapplied is the applied potential to reach 1.23 V vs. RHE. Photoelectrochemical measurements were conducted at a potential of 1.23 V (vs. RHE) under modulated solar simulated irradiation, following the same conditions applied for photocatalytic hydrogen generation. Structural and interface characterization Powder X-ray diffraction (XRD) patterns were acquired using a Bruker X-ray diffractometer model D8 Advance, using the Cu Kα1 line (λ = 1.5418 Å) in the 2θ range of 15 to 70º (step: 0.02º). The quantum dots were precipitated by a change of dielectric constant, adding acetone to colloidal suspension, in ratio 1:1 (v/v), followed by the centrifugation (30 min, 6000 rpm) and washed with ethanol. The samples were dried under vacuum, macerated in an agate mortar, and the powder was stored under a dry atmosphere. Diffuse reflectance spectra recorded in the range of 350 to 800 nm, with a 1 nm resolution, were recorded using a Cary 300 UV-Vis spectrometer. Raman spectra were obtained on Raman confocal microscopy, Alpha 300S (WITEC) using a laser of 532 nm. Luminescence spectra were recorded in Fluoromax equipment (Horiba) spectrofluorometer (with excitation and slit 3 mm) at λexc = 330 nm. The morphological characterization of the MoO3, MoO3-x and MoO3-x/CdS-MPA QDs were based on scanning electron microscope (SEM) images and energy dispersive X-ray spectrometry (EDX). A Tescan Mira3 FE-SEM (Tescan®, Brazil), with 20 kV acceleration potential and different magnifications, coupled with Ultim® Max EDS detector (Oxford) were used. The morphology and structural characterization of CdS-MPA QDs were based on high-resolution transmission electron microscope (HRTEM) images and EDX spectrum. A Tecnai G2-20-FEI microscope with 200 kV an acceleration potential, with holey carbon supported nickel grids (Electron Microscopy Sciences, USA) as the support for the quantum dots, followed by complete drying at low pressure overnight was used. The size distribution of the nanoparticles was obtained based on microscopy images, randomly selecting 500 nanoparticles, using the image processing program (ImageJ, version 1.52a, National Institutes of Health, USA).25
RESULTS AND DISCUSSION The formation of molybdenum suboxides involves mechanisms of exfoliation of the structure and partial reduction of the structure through the formation of oxygen vacancies and reduction of the metal ion,26 where microstructural advances and changes in the intra-gap levels of the MoO3-x were investigated by different techniques. Structural and interfaces evolution The interaction between γ-radiation and FA promoted the formation of radicals capable of in situ reducing or oxidizing species. The presence of a small amount of water in the FA present in the solution allows the formation of potentially reducing species such as H• and HO• (Equation 2). These are important for forming reducing species from the FA molecule. The possible means of interaction begins with the formation of radical anions COOH- through interaction with HO•– (Equation 3).27,28 Such a process is followed by interaction with new FA molecules (Equation 4), and, in a final radiolysis stage, the formation of CO2 and HCO•– (Equation 5) occurs.29 HCO•– anions act as the final reducing agent in the MoO3 structure. 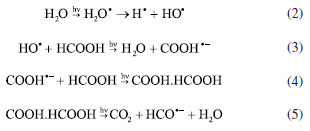 The reduced oxide production via radiolysis depends on the concentration of water, which is crucial for the progression of the reaction. The formation of the reduced oxide can be expressed by Equation 6. After radiolysis, upon opening the septum of the reaction vessel, the presence of pressurized gas was confirmed and identified as CO2 using gas chromatography, verifying the proposed reaction mechanism.  In this way, two characteristics are measurable: the first is associated with electronic effects by the formation of oxygen vacancies () and reduction of Mo6+ to Mo4+, and the second is related to the exfoliation of the material, increasing the interplanar distance in preferred crystallographic directions.26,30 Different techniques were used to monitor the structural and electronic changes after the radiolysis step, for the formation of the reduced oxide MoO3-x, and after the formation of the heterojunction between MoO3-x and CdS-MPA QDs. The results are shown in Figure 2.
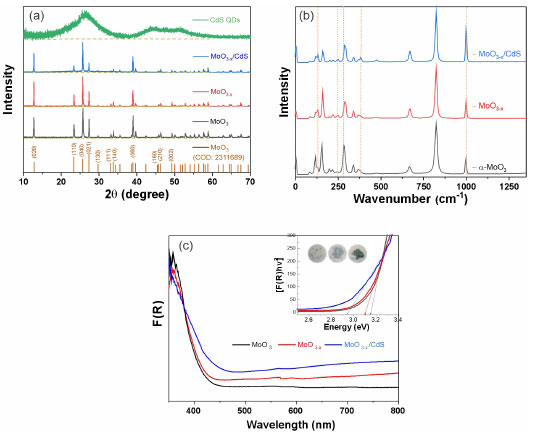 Figure 2. Structural and interface characterization for MoO3, MoO3-x, and MoO3-x/CdS: (a) powder X-ray diffraction ( XRD) patterns, (b) Raman spectra, and (c) diffuse reflectance spectra (inset: samples and Tauc plot)
Figure 2a presented the XRD patterns of the samples for each modification step. The MoO3 sample presented diffraction peaks in 2θ values of 12.71, 25.75, and 39.00º associated with the planes of the set (h 2k l): (020), (040) and (060) corresponding the α-MoO3 phase (Crystallography Open Database, COD: 2311689). The γ-radiolysis process of MoO3 in the presence of FA leads to the exfoliation of the oxide on the crystallographic direction [0 2k 0].27,28 The process of exfoliation leads to a shift of 2θ values towards smaller values, indicating an increase in the lattice parameter associated with van der Waals expansion.31 For the irradiated MoO3-x sample, the maintenance of the lamellar orthorhombic structure was verified, with diffraction peaks in the 2θ values of the set (0 2k 0) for 12.59, 25.65, and 38.93º.32 The CdS-MPA QDs were also characterized by XRD, exhibiting diffraction peaks at 2θ values of 26.47, 44.44, and 51.27º associated with the planes (111), (200), and (311) of zinc blend structure of CdS.33 With the formation of the MoO3-x/CdS-MPA QDs heterojunction, the exfoliation of the MoO3-x structure is maintained. Additionally, the presence of CdS-MPA QDs was evidenced by an increase in the baseline in the region between 20 and 35º associated with the diffraction plane (111) of CdS.22 Figure 3S (Suplementary Material) shows in detail the advance of the diffraction peaks associated with the plane (040) most intense peak, showing the shift towards lower values of 2θ, related to the exfoliation process. In order to highlight structural changes, structural parameters were calculated using physical-mathematical methods by Williamson-Halll and Halder-Wagner.34 Using the Scherrer method, the average crystallite size (DSC) can be calculated by Equation 7:  where, K is the shape factor of value 0.94, λ is the wavelength of the Cu-Kα radiation used (1.5418 Å), θ is the Bragg diffraction angle and bhkl is the width at half height of the corresponding peak of diffraction (in radians). The strain (e) can be calculated by Equation 8:  Using the Williamson-Hall method, it is possible to correlate size-induced changes in crystals with microstrain in the lattice. Using the uniform deformation model (UDM WH-plot) it can be estimated that the effects of crystallite size and stress on peak width are independent, being mathematically described by Equation 9:35  Linear adjustments can be used to determine parameters such as strain and crystallite size. The model assumes that stresses propagate isotropically, with the peak profile following Gaussian distributions. The Halder-Wagner model (HW plot) allows for the determination of the crystallite size (DHW) and microstrain (eHW) using Equation 10. This model considers that the diffraction peak follows a Voigt symmetry function, which can be seen as a deconvolution of Lorentzian and Gaussian functions.34,35  The WH-plot and HW-plot graphs are shown in Figure 4S (Supplementary Material), and their adjustments are detailed in Table 1. The exfoliation process of the α-MoO3 structure does not alter the crystalline structure, but results in an increase in interplanar distance. The Williamson-Hall method suggested an unexpected behavior during the exfoliation process, showing a decrease in the size of the crystallites, and was not adequate to explain experimental behavior. However, the Scherrer and Halder-Wagner models indicated an increase in crystallite size during the exfoliation of molybdenum oxide. The Halder-Wagner crystallites showed DHW values of 10.39 nm for MoO3 and 20.97 nm for substoichiometric oxides (MoO3-x). When a heterojunction with CdS-MPA QDs was formed, a lower crystallite size value of DHW = 18.23 nm was observed. According to the Halder-Wagner model, the strains obtained values of 7.98 for MoO3 and a decrease with exfoliation (MoO3-x) to 7.24, indicating that the Halder-Wagner model can explain the behaviors observed in XRD. The semiconductor interfaces were studied by Raman spectroscopy (Figure 2b), allowing the changes to accompany the nanomaterial symmetry sites. Spectroscopic signals specific to the α-MoO3 structure were verified at 282 cm-1 (B2g, δ, O=M=O wagging) and 338 cm-1 (Ag, B1g, δ, O–M–O bend).36 For the all samples were verified the signals associated with the O–Mo–O stretching was at 669 cm-1 (B2g and B3g), M=O terminal bond stretching at 823 and 998 cm-1, associated at symmetric and asymmetric Ag modes, respectively.36-38 With the formation of the reduced, non-stoichiometric oxide, the position of the O=Mo=O wagging and O–Mo–O bending modes are provided for 291 cm-1 (B3g, δ, O=M=O wagging) and 340 cm-1, respectively. Signals at 129 cm-1 (B3g, translational rigid MoO4 chain mode, Tc) and 245 cm-1 (B3g, τ, O=Mo=O twist mode) characteristic of MoO3-x domains were observed.38 The MoO3 vibrational modes associated with the M=O groups at 282 cm-1 (B2g) and 291 cm-1 (B3g) are indicators of local symmetry and permit inferring the stoichiometry of the oxide regarding oxygen vacancies. Dieterle and collaborators demonstrated that wagging modes are polarized parallel to the c direction but have different ways of symmetry, which directly affects the intensity of the signals. Local symmetry changes in the c direction are associated with the introduction of oxygen vacancies. Thus, the displacement of the maximum signals at 282 cm-1 (B2g) to 291 cm-1 (B3g) is indicative of the formation of the reduced oxide.36 Raman-active CdS modes, such as the 1LO (longitudinal optical) of phonons (197 and 278 cm-1), were not verified by overlapping peaks with active modes of MoO3-x.39 The band structure changes resulting from exfoliation and the formation of a heterojunction MoO3-x/CdS-MPA QDs led to macroscopic samples modification, initially indicated by a noticeable shift in color (inset Figure 2c). Accompanied by diffuse reflectance spectra (Figure 2). After γ-irradiation and heterojunction formation, the absorption band at 350 nm associated MoO3 original band structure remains for all samples. After γ-irradiation, there was an increase in the absorption band between 450 and 800 nm, associated with oxygen vacancies and reduction of MoVI to MoIV, forming charge donor and acceptor states that increase the charge recombination life-time. Broading the absorption spectral region. With the addition of CdS, there is a slight increase in radiation absorption in the visible region associated with the MoO3-x/CdS heterojunction.40 In the inset, the Tauc curves show the materials optical bandgap evolution, where MoO3 has 3.2 eV, MoO3-x 3.0 eV, and MoO3-x/CdS 3.0/2.8 eV. The overlapping of bandgap values does not allow for singling out MoO3-x from the CdS; however, the relative positioning of bands provides access to the charge transfer mechanisms. The semi-quantitative analysis by EDX estimated the elementary composition in each sample. The most intense peak spectra were observed for Mo (La1) (Figure 5S, Supplementary Material), and the data is reported in Table 2S (Supplementary Material). From the atomic percentage data of EDX, the elementary formulas were estimated as MoO2.93 for the MoO3 sample, MoO2.61 for the reduced oxide sample (MoO3-x), and MoO2.55/Cd1.6S for the sample MoO3-x/CdS-MPA QDs. The results of the semiquantitative analysis confirm the trends observed during the structural characterization processes. The presence of sulfur in the sample was confirmed based on the peak of the 2.15 to 2.55 keV (Figure 6S, Supplementary Material). CdS-MPA QDs were characterized by absorption and spectra and HRTEM images (Figure 3). From the absorption spectrum, was observed an absorption band (labs) at 373 nm (Eg = 2.8 eV) and emission band (lem) at 561 nm (Figure 3a). From the HRTEM image, the spherical morphology and average size distribution of 4.23 ± 1.00 nm were confirmed (Figure 3b). In the inset, is presented the Fourier transform pattern for the selected region where the verified interplanar distances are attributed to the diffraction planes (111) and (222) of the zinc blend structure of CdS.
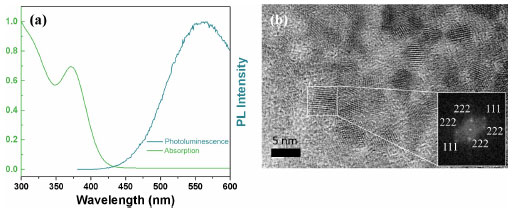 Figure 3. Optical and morphological characterization of CdS-MPA QDs: (a) photoluminescence and absorption spectra and (b) high-resolution transmission electron microscope (HRTEM) image (inset: FFT pattern of CdS QDs)
SEM images were used to accompany morphological changes. Figure 4a shows the α-MoO3, the starting material, with regular morphology and oxide plate characteristics. Following irradiation with a 30 kGy dose in the presence of FA (Figure 4b), a fragmented material is produced, resulting in smaller plates of MoO3-x which aligns with the exfoliation and breakage of the material. After the adsorption of CdS QDs stabilized by MPA, forming the MoO3-x/CdS heterostructure (Figure 4c), the previous morphology is maintained. The EDX spectra (Figure 4d) clearly showed distinctive peaks for Mo in both the MoO3 and MoO3-x samples, including spectral lines Lα1 at 2.293 keV, Lβ1 at 2.395 keV, Lβ2 at 2.518 keV, Lg1 at 2.624 keV, Li at 2.016 keV, and Lg3 at 2.831 keV. With the addition of CdS QDs, the Cd peaks were obtained apart from the Mo and O peaks: Lα1 3.134 keV, Lβ1 3.17 keV, Lβ2 3.538 keV, Lg1 3.727 keV, Mα12 0.405 keV. The K lines of S in Kα1 2.308 keV, Kα2 2.307 keV, and Kβ1 2.464 keV strongly overlap the L lines of Mo. The inset in Figure 4d presents the EDX of the MoO3-x/CdS-MPA QDs heterojunction, where the presence of Mo and O is evident throughout the support oxide structure, and the Cd signals indicate a uniform addition of CdS in the MoO3-x structure, where an exfoliated structure facilitates the adsorption of other nanostructures.41 Figure 4e presents the elemental mapping of the MoO3-x/CdS heterojunction, showing a homogeneous distribution of Mo, O, and Cd in the material.
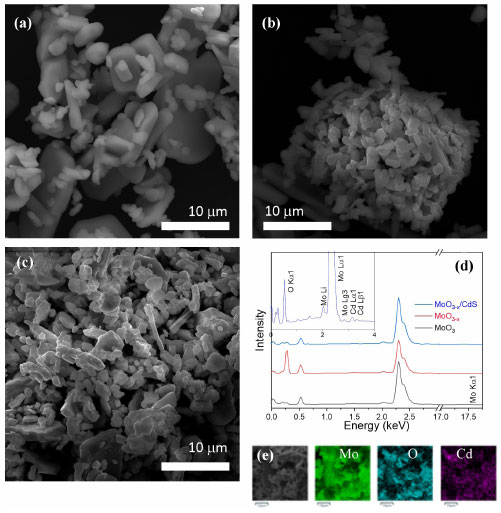 Figure 4. Scanning electron microscope ( SEM) images of (a) MoO3, (b) MoO3-x, (c) MoO3-x/CdS-MPA QDs, (d) energy dispersive X-ray (EDX) spectra of all samples. The inset offers the EDX of the MoO3-x/CdS heterojunction. (e) Elemental mapping of Mo, O, and Cd of MoO3-x/CdS-heterojunction
Structural and interfaces evolution Photoelectrochemical strategies such as chronoamperometry verified the performance gains associated with improved charge transfer at semiconductor interfaces. The experiments were carried out with simulated sunlight (Xe lamp, 150 W, filter AM 1.5 G) (Figure 7S, Supplementary Material). The photocurrent density increased from 0.12 μA cm-2 for MoO3 to 0.63 μA cm-2 with the substoichiometric oxides (MoO3-x). With the formation of the MoO3-x/CdS heterojunction, a photocurrent density of up to 1.22 μA cm-2 was obtained. The formation of oxygen vacancies in the MoO3 structure allows two processes: the increase in the absorption region of solar radiation and the improvement in electrical conductivity, increasing photoresponse. Nevertheless, despite the progress in radiation absorption within the visible region, a challenge remains with the relative positioning of bands, specifically concerning the MoO3 conduction band (CB: 0.29 V) concerning the hydrogen reduction line (H + |H2: 0.00 V), where the process lacks thermodynamic spontaneity. The results of water splitting in the presence of methanol (10%) with apparent pH 6.0, under simulated sunlight irradiation (100 mW cm-2) and controlled temperature at 25 ºC, showed the formation of small amounts of H2 for the MoO3 and MoO3-x systems, a consequence of the positioning of the MoO3 conduction band and hydrogen reduction line (Figure 5a). The synthesis of MoO3-x/CdS-MPA QDs produced 35 μmol of H2 upon irradiation, indicating a 4.2× increase compared to the reduced oxide. However, for the oxygen generation profile, it appears that the MoO3-x system produced 300 μmol O2 and the MoO3-x/CdS close to 1100 μmol of O2 (Figure 5b) after 240 min of experiment.
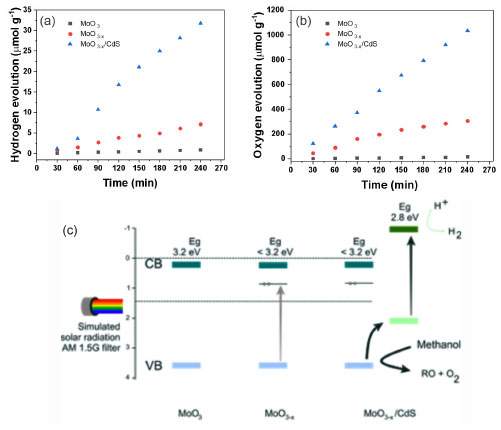 Figure 5. Water splitting results and relative bandposition: (a) hydrogen evolution, (b) oxygen evolution, and (c) relative bandposition for the heterojunction and ways for charge recombination
The results are justified when understanding the possible charge recombination paths for the heterojunction, which are presented in Figure 5c. Therefore, the relative positioning of bands for the MoO3 and CdS systems was initially calculated based on Mulliken’s absolute electronegativity.42 The relative positions of the calculated MoO3 were similar to those reported by other studies.43,44 The conduction and valence bands for MoO3 have values of 3.494 and 0.294 V vs. NHE, respectively (Equation 11). Therefore, the formation of the redox couple for hydrogen evolution is not thermodynamically spontaneous. The results are justified when interpreting the possible charge recombination paths for the heterojunction. With the formation of the partially reduced structures of MoO3-x, the formation of oxygen gaps occurs at different levels:  For hierarchical MoO3-x/CdS-MPA QDs systems, it is proposed that charge recombination begins with the promotion of electrons from the CdS, forming the excitonic pair (Equation 14). In a fixed process, the electrons of the CB CdS are transferred to the H+, forming hydrogen (Equation 15). And, to replenish the electron hole in VB CdS, the photoexcited electrons of the MoO3-x are transferred (Equation 16). The electrons in the electron holes of MoO3-x are replaced by the oxidation of methanol (Equation 12).  After the photocatalytic cycle, unconventional reaction trends, which had not been reported in previous works, were observed. A slightly bluish solution was formed for MoO3 samples after photocatalytic cycles for H2 production. Such a phenomenon was similarly observed in reactions in the presence of hole scavengers such as methanol, glycerol, and TEOA. Figure 8S (Supplementary Material) shows the absorption spectrum of the supernatant, indicating the reduction of the structure and the formation of nanoparticles. After conducting the MoO3-x photocatalysis procedure, we noticed the formation of the characteristic blue colloid, indicative of colloidal nanoparticles composed of this compound.46 A small amount of solid material was preserved. The absorption spectrum was obtained from the dilution of the obtained colloid in a 1:30 ratio (colloid:water) (Figure 6a). Two different absorption regions were formed, λ = 350 nm and a second between λ = 600-800 nm, with band gap values of 3.4 and 1.54 eV, respectively. To structurally characterize the samples, powder samples were obtained for X-ray diffraction pattern recording. The nanoparticles were precipitated with acetone in a 1:20 ratio (colloid:acetone) and centrifuged at 12000 rpm for 30 min. The XRD diffractogram (Figure 6b) indicated the formation of a mixed phase between MoO2 with diffraction peaks at 2θ values of 18.34, 23.63, 35.34, 37.01, and 41.67º associated with planes (100), (110), (-211), (-212), and (-122) COD 4345369.46 Peaks related to the structure of α-MoO3 at 2θ values of 12.68, 23.42, 25.62, 27.36, 35.59, 38.88º associated with planes (020), (110), (040), (021), (140), (060) were also observed, which highlights the transformation of the nanomaterial after the photocatalysis cycle for water splitting, which surprisingly allowed the generation of significant amounts of oxygen and the formation of a catalyst, MoO3-x blue, as a potential reducing agent for organic synthesis. For MoO3-x/CdS samples after the photocatalysis cycle, darkening of the formed powder was observed, preserving the typical diffraction peaks of the reduced α-MoO3 structure.
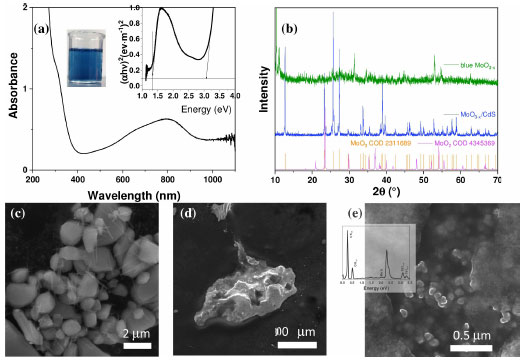 Figure 6. Characterization of photocatalysts post-catalysis: (a) colloidal solution formed using MoO3-x powder with an inset showing the extrapolation of the Tauc curve and a 30 × diluted sample. (b) Powder X-ray diffraction ( XRD) of colloidal MoO3-x and MoO3-x/CdS-MPA QDs. Scanning electron microscope (SEM) images for the catalysts: (c) MoO3 (d) MoO3-x and (e) MoO3-x/CdS-MPA QDs, inset: energy dispersive X-ray (EDX) spectrum
SEM images (Figures 6c-6e) revealed morphological transformations of the photocatalysts. MoO3, after one cycle of photocatalysis, showed the preservation of initial morphologies, but the formation of nanorods on the surface was observed (Figure 6c). SEM measurements were performed from the precipitated MoO3-x blue for the XRD samples. Figure 6d shows clusters of nanoparticles, with SEM not being a definitive technique for material analysis due to the size scale. For the MoO3-x/CdS heterojunction (Figure 6e), the preservation of microstructures was observed even after the catalytic cycle. The EDX spectrum (inset of Figure 6e) allowed visualization of the spectroscopic lines of Mo and Cd, inferring the maintenance of the structure. Given these results, MoO3-x/CdS was used to continue the photocatalysis cycle experiments. The photocatalysis cycles for oxygen and hydrogen generation are presented in Figure 7. It is observed that, for the hydrogen generation cycles (Figure 7a), there is a progressive decrease in hydrogen production, reaching hydrogen yields of approximately 30 μmol (1st cycle), 24 μmol (2nd cycle), and 17 μmol (3rd cycle) after 240 min of irradiation with simulated sunlight. Similarly, a decrease in oxygen production was also observed (Figure 7b), decreasing from 1000 μmol (1st cycle), 900 μmol (2nd cycle) to 800 μmol (3rd cycle).
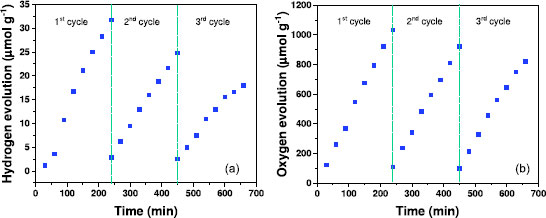 Figure 7. Cycles of hydrogen (a) and oxygen (b) production in the presence of the MoO3-x/CdS photo-catalyst using 10% methanol as a hole scavenger
The progressive decrease in hydrogen and oxygen production is associated with the passivation of the surface of the photocatalyst. Figure 8e (inset) highlighted a significant increase in the carbon Kα line, which may indicate surface passivation, poisoning the photocatalyst. The hydrogen generation observed in the present study, where MoO3-x sensitivity was tested using electrosynthesized CdS-MPA QDs (0.035 mmol g-1 h-1), is comparable to that reported for similar systems involving in situ CdS growth and other semiconductors, as g-C3N4. After photocatalysis, leaching was investigated by adding sulfide to the final supernatant (Figure 9S, Supplementary Material). The formation of the absorption band at 400 nm extending into the visible range was observed, associated with the formation of CdS, confirming the leaching of CdS QDs anchored on the surface of MoO3-x.47 Further studies will be performed to improve the interaction between the catalyst components to avoid leaching. As presented in the Table 2S, the photocatalytic generation of H2 using MoO3-x heterostructures with Cd0.9Zn0.1S nanorods achieves the highest production rates, around 150 and 30 mmol g-1 h-1, for 25 and 5 wt% of MoO3-x, respectively.48 The assembly of nanostructures with the same aspect ratio used 0.32 mg mL-1 (catalyst/solution) and lactic acid (10%) as a radical scavenger. Peng et al.49 reported a nanomaterial formed by MoO3-x/CdS with production rates of 5.0 mmol g-1 h-1 using 0.32 mg mL-1 (catalyst/solution) and lactic acid (10%) as a radical scavenger. Independently, Li et al.50 and Guo et al.14 developed catalyst systems based on the heterostructure of MoO3-x-g-C3N4 with a catalyst/solution ratio of 0.125 and 1.0 mg mL-1, respectively. Both works reported using the co-catalyst H2-PtCl6-H2O (3 wt.%) in the presence of triethanolamine (TEOA) 10%. The first system reported hydrogen production of around 2.250 and 0.0016 mmol g-1 h-1. However, previously reported works did not use filters to simulate the solar spectrum, such as AM 1.5 G, used in this study. Additionally, the higher power of the lamps (Xe 300 W) offers greater optical power than 150 W lamps. The effect of temperature cannot be neglected, as it may directly influence the reaction rates (since, in kinetic laws, the rate constant (k) is a function of temperature, following an Arrhenius thermally activated law). The results reported in this study were conducted under isothermal conditions at 25 ºC. Another important aspect is using radical scavengers and the rule of alpha hydrogens, hydrogen in the alpha-carbonyl position. The OH groups of the reported hole scavengers TEOA, lactic acid, and methanol play a role where the reduction capacity is associated with the number of available alpha hydrogens. The alpha hydrogen in lactic acid presents itself with a higher density of positive charge and spatial orientation that allows proximity to the catalyst.51 Methanol has three alpha hydrogens, which are less polarized than lactic acid. Triethanolamine has three terminal OH groups and three alpha hydrogens, but the orientation of the groups may not be facilitated for various oxidation steps.52 All these works open up new possibilities for further exploration, allowing the use of substoichiometric molybdenum oxides in green hydrogen generation.
CONCLUSIONS This study investigated the heterojunction between substoichiometric molybdenum oxides (MoO3-x) and CdS-MPA QDs and examined their efficacy in water-splitting applications. Substoichiometric oxide was produced via gamma irradiation in the presence of formic acid, while quantum dots were electrosynthesized. The self-assembly and structural/electronic properties of the micro- and nanostructures were evaluated at each stage of production. The results of water splitting experiments under simulated sunlight revealed a substantial increase in hydrogen production: the progression from MoO3 (H2: ~ 0 μmol/O2: ~ 0 μmol) to MoO3-x (H2: 8.3 μmol/O2: 300 μmol) and finally to MoO3-x/CdS-MPA QDs (H2: 35 μmol/O2: 1100 μmol) revealed an enhanced performance in the water-splitting reaction, attributed to band alignment and improved charge transfer. A proposed charge transfer mechanism highlights the importance of the relative band positions between MoO3-x and CdS-MPA QDs in facilitating the solar-driven generation of green hydrogen evolution and methanol processing.
SUPPLEMENTARY MATERIAL Supplementary data (electrochemical cavity cell, photocurrent density, EDX spectra, Williamson-Hall and Halder-Wagner plots, comparative overview of photocatalytic H2) are available at http://quimicanova.sbq.org.br/, as a PDF file, with free access.
ACKNOWLEDGMENTS This work was supported by MCTI, FINEP (Materiais Avançados, 29400), CAPES, CNPq (IBH2 405812/2022-1), FACEPE (APQ-0401-1.06/22). We gratefully acknowledge the staff at the CETENE Analytical Center, Paloma Barreto and Emanuely Souza, Laboratório de Metrologia das Radiações Ionizantes (LMRI-DEN-UFPE) for the γ-ray irradiation, PGMTR UFPE and Dr. Nielson Torres for the SEM images, Analytical Center of the Physics Department of UFPE, and Dr. Tarcyla Andrade for XRD analysis.
REFERENCES 1. Páll, B.; Mersel, M. A.; Pekker, P.; Makó, E.; Vágvölgyi, V.; Németh, M.; Pap, J. S.; Fodor, L.; Horváth, O.; Int. J. Mol. Sci. 2023, 24, 9802. [Crossref] 2. Guo, S.; Li, X.; Li, J.; Wei, B.; Nat. Commun. 2021, 12, 1343. [Crossref] 3. Wang, Q.; Wang, X.; Zhang, F.; Next Energy 2023, 1, 100016. [Crossref] 4. Thiemens, M. H.; Nat. Chem. 2012, 4, 66. [Crossref] 5. Li, X.; Chen, Y.; Tao, Y.; Shen, L.; Xu, Z.; Bian, Z.; Li, H.; Chem Catal. 2022, 2, 1315. [Crossref] 6. Villa, K.; Galán-Mascarós, J. R.; López, N.; Palomares, E.; Sustainable Energy Fuels 2021, 5, 4560. [Crossref] 7. Sampaio, M. J.; Yu, Z.; Lopes, J. C.; Tavares, P. B.; Silva, C. G.; Liu, L.; Faria, J. L.; Sci. Rep. 2021, 11, 21306. [Crossref] 8. Curcio, A.; Wang, J.; Wang, Z.; Zhang, Z.; Belotti, A.; Pepe, S.; Effat, M. B.; Shao, Z.; Lim, J.; Ciucci, F.; Adv. Funct. Mater. 2021, 31, 2008077. [Crossref] 9. Yin, Q.; Tan, L.; Lang, Q.; Ke, X.; Bai, L.; Guo, K.; Qiao, R.; Bai, S.; Appl. Catal., B 2018, 224, 671. [Crossref] 10. Nunomura, C. Y.; Sousa, S. J. F.; Arquivos Brasileiros de Oftalmologia 2023, 86, 1. [Crossref] 11. de Castro, I. A.; Datta, R. S.; Ou, J. Z.; Castellanos‐Gomez, A.; Sriram, S.; Daeneke, T.; Kalantar‐zadeh, K.; Adv. Mater. 2017, 29, 17011619. [Crossref] 12. Zhu, Y.; Yao, Y.; Luo, Z.; Pan, C.; Yang, J.; Fang, Y.; Deng, H.; Liu, C.; Tan, Q.; Liu, F.; Guo, Y.; Molecules 2019, 25, 18. [Crossref] 13. Jo, S.; Lee, Y. W.; Hong, J.; Sohn, J. I.; Catalysts 2020, 10, 1180. [Crossref] 14. Guo, Y.; Chang, B.; Wen, T.; Zhang, S.; Zeng, M.; Hu, N.; Su, Y.; Yang, Z.; Yang, B.; J. Colloid Interface Sci. 2020, 567, 213. [Crossref] 15. Sun, Z.; Yang, C.; Liu, G.; Lu, H.; Zhang, R.; Wang, L.; Wang, H.; Electrochim. Acta 2017, 239, 16. [Crossref] 16. Etman, A. S.; Abdelhamid, H. N.; Yuan, Y.; Wang, L.; Zou, X.; Sun, J.; ACS Omega 2018, 3, 2201. [Crossref] 17. Hong, R.; Li, Z.; Liu, Q.; Sun, W.; Deng, C.; Wang, Q.; Lin, H.; Tao, C.; Zhang, D.; Opt. Mater. 2020, 99, 109589. [Crossref] 18. Sen, S. K.; Al Mortuza, A.; Manir, M. S.; Pervez, M. F.; Hossain, S. M. A. I.; Alam, M. S.; Haque, M. A. S.; Matin, M. A.; Hakim, M. A.; Huda, A.; Nano Express 2020, 1, 020026. [Crossref] 19. Sen, S. K.; Noor, M.; Al Mamun, M. A.; Manir, M. S.; Matin, M. A.; Hakim, M. A.; Nur, S.; Dutta, S.; Opt. Quantum Electron. 2019, 51, 82. [Crossref] 20. Han, B.; Liu, S.; Zhang, N.; Xu, Y. J.; Tang, Z. R.; Appl. Catal., B 2017, 202, 298. [Crossref] 21. Wu, Y.; Wang, H.; Tu, W.; Wu, S.; Liu, Y.; Tan, Y. Z.; Luo, H.; Yuan, X.; Chew, J. W.; Appl. Catal., B 2018, 229, 181. [Crossref] 22. Wu, Y.; Wang, H.; Tu, W.; Wu, S.; Chew, J. W.; Appl. Organomet. Chem. 2019, 33, e4780. [Crossref] 23. Lima, D. C. A.; Ferreira, A. F.; Silva, S. E.; Alves, S.; Sousa, F. L. N.; de Azevedo, W. M.; Dalton Trans. 2023, 52, 8353. [Crossref] 24. Costa, B. M. F.; Freitas, D. V.; Sousa, F. L. N.; Silva, K. D.; Dias, J. M. M.; Assis, A. M. L.; Jesus, A. C.; Ribeiro, A. S.; Navarro, M.; Dyes Pigm. 2020, 180, 108483. [Crossref] 25. Rasband, W.; ImageJ, 1.52a; National Institutes of Health, USA, 2018. 26. Datta, R. S.; Haque, F.; Mohiuddin, M.; Carey, B. J.; Syed, N.; Zavabeti, A.; Zhang, B.; Khan, H.; Berean, K. J.; Ou, J. Z.; Mahmood, N.; Daeneke, T.; Kalantar-zadeh, K.; J. Mater. Chem. A 2017, 5, 24223. [Crossref] 27. Ito, T.; Tanabe, K.; Yamada, H.; Hatta, H.; Nishimoto, S.; Molecules 2008, 13, 2370. [Crossref] 28. Lousada, C. M.; Soroka, I. L.; Yagodzinskyy, Y.; Tarakina, N. V.; Todoshchenko, O.; Hänninen, H.; Korzhavyi, P. A.; Jonsson, M.; Sci. Rep. 2016, 6, 24234. [Crossref] 29. Smithies, D.; Hart, E. J.; J. Am. Chem. Soc. 1960, 82, 4775. [Crossref] 30. Agarwal, V.; Metiu, H.; J. Phys. Chem. C 2016, 120, 19252. [Crossref] 31. Eremeev, S. V.; Vergniory, M. G.; Menshchikova, T. V.; Shaposhnikov, A. A.; Chulkov, E. V.; New J. Phys. 2012, 14, 113030. [Crossref] 32. Chithambararaj, A.; Rajeswari, N. Y.; Bose, A. C.; Cryst. Growth Des. 2016, 16, 1984. [Crossref] 33. da Silva, J. E.; Freitas, D. V.; Sousa, F. L. N.; Caires, A. J.; Escobar, D. M. P.; Reis, T. J. A.; Navarro, M.; J. Alloys Compd. 2023, 969, 172315. [Crossref] 34. Sen, S. K.; Paul, T. C.; Manir, M. S.; Dutta, S.; Hossain, M. N.; Podder, J.; J. Mater. Sci.: Mater. Electron. 2019, 30, 14355. [Crossref] 35. Manh, D. H.; Ngoc Nha, T. T.; Hong Phong, L. T.; Nam, P. H.; Thanh, T. D.; Phong, P. T.; RSC Adv. 2023, 13, 25007. [Crossref] 36. Dieterle, M.; Weinberg, G.; Mestl, G.; Phys. Chem. Chem. Phys. 2002, 4, 812. [Crossref] 37. Saadati, M.; Akhavan, O.; Fazli, H.; Catalysts 2021, 11, 1445. [Crossref] 38. Guan, X.; Ren, Y.; Chen, S.; Yan, J.; Wang, G.; Zhao, H.; Zhao, W.; Zhang, Z.; Deng, Z.; Zhang, Y.; Dai, Y.; Zou, L.; Chen, R.; Liu, C.; J. Mater. Sci. 2020, 55, 5808. [Crossref] 39. Parani, S.; Tsolekile, N.; Pandian, K.; Oluwafemi, O. S.; J. Mater. Sci.: Mater. Electron. 2017, 28, 11151. [Crossref] 40. Ge, H.; Kuwahara, Y.; Yamashita, H.; Chem. Commun. 2022, 58, 8466. [Crossref] 41. Kumar, N.; George, B. P. A.; Abrahamse, H.; Parashar, V.; Ngila, J. C.; Appl. Surf. Sci. 2017, 396, 8. [Crossref] 42. Velásquez, D. A. P.; Sousa, F. L. N.; Soares, T. A. S.; Caires, A. J.; Freitas, D. V.; Navarro, M.; Machado, G.; J. Power Sources 2021, 506, 230165. [Crossref] 43. Liu, Y.; Dong, X.; Yuan, Q.; Liang, J.; Zhou, Y.; Qu, X.; Dong, B.; Colloids Surf., A 2021, 621, 126582. [Crossref] 44. Huang, L.; Zhang, F.; Li, Y.; Wang, H.; Wang, Q.; Wang, C.; Xu, H.; Li, H.; J. Mater. Sci. 2019, 54, 5343. [Crossref] 45. Zhang, H.; Wang, H.; Yang, Y.; Hu, C.; Bai, Y.; Zhang, T.; Chen, W.; Yang, S.; J. Mater. Chem. A 2019, 7, 1499. [Crossref] 46. Shin, S.; Yoon, J.; Kim, E.; Yoon, W. S.; Shin, H.; Energy Technol. 2020, 8, 1901502. [Crossref] 47. Pais, A.; Dina, L.; Alves, E.; Rezende, H.; Silva, L.; Alves, V.; Quim. Nova 2018, 41, 1218. [Crossref] 48. Wei, Y.; Zhang, Q.; Zhou, Y.; Ma, X.; Wang, L.; Wang, Y.; Sa, R.; Long, J.; Fu, X.; Yuan, R.; Chin. J. Catal. 2022, 43, 2665. [Crossref] 49. Peng, J.; Shen, J.; Yu, X.; Tang, H.; Zulfiqar; Liu, Q.; Chin. J. Catal. 2021, 42, 87. [Crossref] 50. Li, J.; Ma, L.; Huang, Y.; Luo, B.; Jing, D.; Int. J. Hydrogen Energy 2023, 48, 13170. [Crossref] 51. Frandsen, B. N.; Deal, A. M.; Lane, J. R.; Vaida, V.; J. Phys. Chem. A 2021, 125, 218. [Crossref] 52. Kumaravel, V.; Imam, M.; Badreldin, A.; Chava, R.; Do, J.; Kang, M.; Abdel-Wahab, A.; Catalysts 2019, 9, 276. [Crossref]
Associate Editor handled this article: Cassiana C. Montagner |
On-line version ISSN 1678-7064 Printed version ISSN 0100-4042
Qu�mica Nova
Publica��es da Sociedade Brasileira de Qu�mica
Caixa Postal: 26037
05513-970 S�o Paulo - SP
Tel/Fax: +55.11.3032.2299/+55.11.3814.3602
Free access


 . Such a result suggested forming sites with potential for adsorption: one is a terminal oxygen vacancy in Mo=O, and the other is a bridged oxygen vacancy in Mo–O–Mo. At each level of reduction, sites are generated by chemosorption of the scavenger radical (methanol). Following Lewis’ theory, sites with oxygen vacancies are considered acidic and electron-deficient due to the unpaired bonds of Mo6-n ions, where n is equal to 0, 1, or 2. Such a process enables the chemisorption of electron donor groups like C–O, leading to the generation of methanol oxidation products that replenish electrons in the oxide valence band, resulting in the formation of HyMoO3-x, hydrogen molybdenum oxide bronze (Equation 12).45 Hydrogen evolution occurs from the recombination of charges with photoexcited electrons (Equation 13). Additionally, another potential route of charge recombination involves the reduction of Mon+ ions.