
 |
 |
 |
 |
 |
Artigo
| Rapid quantitative analysis of methamphetamine by portable near-infrared spectroscopy and pls modeling |
|
Shan LiuI,II,III,IV,#; Yuemeng ChenI,III,#; Fang WangII,* I. Guiyang Public Security Bureau, 550081 Guiyang, China Received: 05/13/2024 *e-mail: wf19970908@163.com; bbs2811125@126.com; basonmail@163.com To rapidly detect different types of methamphetamine in the field, a portable near infrared spectroscopy (NIR) method was used to model and analyze the collected samples. Transmission spectra of 359 methamphetamine crystal samples (content range of 7.5-99.4%) and 187 methamphetamine tablet samples (content range of 2.43-23.91%) were collected, first-order derivatives and the Savitaki-Golay smoothing method were applied for spectral preprocessing. The drug concentrations in the calibration and validation sample sets were analyzed using high-performance liquid chromatography. The partial least squares quantitative analysis models were built, and the quantitative models for methamphetamine crystals were 2.10, 2.12 and 2.19% for root mean square error of cross-validation (RMSECV), root mean square error of validation (RMSEV) and root mean square error of prediction (RMSEP), respectively; in contrast, RMSECV, RMSEV, and RMSEP of methamphetamine tablets were 0.78, 0.80, and 0.82%, respectively. The results of the internal cross-validation and the methodology review show that the measurements of the modeled results are consistent with the true values, and that the model has good stability and can be used for accurate field measurements. Therefore, real time sample analysis can be performed using NIR technology combined with chemometric models, which helps the police to determine the quality of drugs in a timely manner for case analysis. INTRODUCTION Methamphetamine, commonly known as crystal methamphetamine, is highly addictive and difficult to quit, and is also a psychostimulant that is abused worldwide.1,2 According to reports,2-5 methamphetamine has become one of the most harmful drugs in the world, and abusers may suffer from problems such as agitation, anxiety, paranoia, and even cognitive and psychotic disorders. Thus, it is necessary to increase the crackdown on drug-related cases to reduce the harm that drugs bring to people, society, and the country. In 2018, the National Narcotics Control Commission proposed the "Six Comprehensive" drug governance system, and China gradually walked out of the road of drug prevention and treatment with Chinese characteristics, and the drug problem has been further controlled. In order to further accurately grasp the basic drug situation of methamphetamine in China and effectively control drug circulation, it is necessary to conduct rapid and accurate quantitative analysis of seized methamphetamine samples. The existing methods for quantitative analysis of methamphetamine are mainly liquid chromatography and gas chromatography.6-9 These two methods are highly accurate, but the pre-treatment of the samples is cumbersome, the detection time is long and the cost of the test is high.10 Secondly, the benchtop spectrometer is also widely used for the qualitative testing of sedative anaesthetics.11-13 However, large bench-top infrared spectrometers are expensive, inconvenient to carry, and require professional technicians to operate the instrument and analyze the data. With the development of microelectromechanical systems and micro-optoelectromechanical systems technologies, near infrared spectroscopy (NIR) technology has further evolved towards miniaturization.14 It has been reported that Fourier transform infrared (FTIR) spectral and micro-NIR have been effectively applied in the fields of drug detection,15,16 quality control of food products and agricultural benefits, etc.17,18 But the temperature of FTIR and micro-NIR instruments is not constant and fluctuates with changes in external temperature, which is not economically desirable. The use of NIR analytical methods is of increasing interest due to their rapidity, simplicity, non-destructive nature to the sample19,20 and the ability to generate unique data for each compound.21 There are literature reports22,23 that some scholars use NIR detection technology to conduct on-site physical analysis of drugs. At the same time, many scholars24-27 have combined spectroscopy with partial least squares (PLS) to detect more substances, achieving better results. Some scholars have established calibration models for fruits and milk using NIR hyperspectral images and PLS analysis to identify their varieties,28,29 origin,30,31 sources,32,33 etc. The application of multivariate calibration methods combining infrared spectroscopy and PLS for the determination of a substance in a sample has also been reported in the literature.26,27,34 In addition, multiple studies in recent years have reported the establishment of quantitative analysis methods for multiple drugs such as methamphetamine and heroin in multiple regions using NIR detection technology or combined with PLS.19,35,36 However, the types and concentration ranges of dopants covered by the above models are limited, and there is currently a lack of quantitative models for NIR and PLS construction for different types of methamphetamine (crystals and tablets) in Guizhou Province. In this work, a portable NIR spectrometer was used to quantitatively analyze samples of methamphetamine crystals and methamphetamine tablets seized at the scene of case in Guizhou Province. PLS regression models were developed for methamphetamine crystals and methamphetamine tablets, respectively, based on spectral data preprocessed by the Savitaki-Golay (S-G) smoothing method. The accuracy of the regression model was also evaluated through actual seized samples. The NIR quantitative analysis method established in this study can help the police to timely judge the quality of drugs in the field, making the quantitative analysis of drugs cheaper and faster.
EXPERIMENTAL Reagents and samples Standards of methamphetamine were provided by the Third Research Institute of the Ministry of Public Security (Shanghai, China). Glucose powder was purchased from Kangmei Pharmaceutical (Sichuan, China). Acetonitrile (chromatographic grade, purity > 99%) was obtained from Merck (Darmstadt, Germany). Phosphoric acid and triethylamine were purchased from China National Pharmaceutical Group Chemical Reagent Co., Ltd. (Shanghai, China) and Kemio Chemical Reagent Co., Ltd. (Tianjin, China), respectively. In this study, there were a total of 359 methamphetamine crystal samples, of which 329 were modeling and validation samples (214 were actual samples derived from cases and 115 were prepared by diluting high-purity methamphetamine with glucose, with diluted samples content range of 7.5-52.81%), and 30 were predicted to be from real cases. The total concentration range of all test samples is 7.5-99.4%. Methamphetamine tablet samples were tested directly using actual samples captured in the case, a total of 187 samples (content range of 2.43-23.91%) were used and divided into three sections. Of these, 127 samples were used for modeling, 40 for validation and 20 external test samples for model prediction experiments. NIR spectroscopy NIR spectra were collected on a transform near-infrared spectrometer instrument (NR-17, Beijing Kaiyuanshengshi, China). Linear variable filter (LVF), which produces stable and reliable optics, was used as a dispersive element in order to satisfy the requirements of the field analysis in terms of the instrument's portability and vibration resistance.37,38 All samples were grinded into powder before collecting the spectra. NIR spectra were recorded from 908-1676 nm at a nominal resolution of 6.25 nm and using 100 cumulative scans per spectrum. In this study, three levels of low, medium and high methamphetamine samples were selected and tested in parallel three times. In the repeatability experiments, each sample was tested five times continuously using the same instrument, and the relative standard deviations (RSDs) of the five test results were calculated as the repeatability data. Meanwhile, the reproducibility of each sample was tested for six consecutive days with three instruments. Reference methodology The accuracy of the reference method plays an important role in chemometric modelling since the model is based on data obtained from the reference method. A high performance liquid chromatography (HPLC) system (Waters e2695 series) was chosen to measure the exact content of methamphetamine in the model and validation samples.37 The waters XBridge C18 column (4.6 mm × 150 mm, 5 μm) at 35 ºC was used to split-off analytes. Acetonitrile and water, the latter containing 0.412% phosphoric acid and 0.556% triethylamine, were used as solvents A and B, respectively. The gradient condition of the mobile phase was as follows: 0-8.0 min 84% B, 8.0-8.2 min decreased to 20% B, held at 20% for 8.2-11 min, 11.0-11.2 min increased to 84% B, and maintained for 2.8 min. The flow rate was 1.0 mL min-1 and the injection volume was 5 μL, the absorbance wavelength was set at 210 nm. The linearity, accuracy, and precision of the HPLC method had already been checked in our laboratory and were not discussed in detail in this paper. Evaluation parameters In constructing the PLS model, the sample was divided into a calibration and test data set using the Kennard-Stone method.36 The accuracy of the regression models was analyzed using the coefficient of determination (R2), root mean square error of cross validation (RMSECV), root mean square error of prediction (RMSEP), root mean square error of validation (RMSEV),37 residual prediction deviation (RPD) and relative error rate (RER).39,40 R2 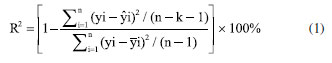 where the yi is reference value for the studied analytes obtained by HPLC, ŷi is the predicted value, -y is the mean value of the reference value, n and k are the number of the calibration set and latent variables, respectively. Bias 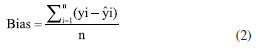 where n is the number of the sample set. RMSECV, RMSEV and RMSEP 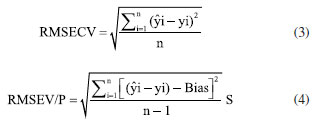 where S is the score matrix of the calibration set. RPD and RER 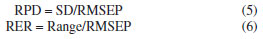 where SD is the standard deviation of the physicochemical values of the samples in the prediction set, Range refers to the range of sample concentration variation in the prediction set (i.e., the difference between the maximum and minimum values). Statistical analysis The spectral data were collected and analyzed by NR-17 Quantitative Software (v1.0, Beijing Kaiyuanshengshi, China). The S-G method was used to pre-process the spectral data to remove baseline drift, noise and stray light to improve the accuracy of the prediction model. Leverage was used as an identifier of outliers, removing outliers from the data set so that the parametric statistical model can fit the training data more smoothly.37,41 IBM SPSS Statistics 27.042 was used for conducting one-way analysis of variance on the data. Figshare online database43 was used to store raw data related to this article.
RESULTS AND DISCUSSION Spectra and pretreatments The absorption of NIR radiation is due mainly to overtone and combination bands, which can be attributed to hydrogen vibrations (N-H, S-H, C-H, and O-H).19 The infrared spectra of 359 methamphetamine crystals and 187 methamphetamine tablet samples are shown in Figures 1 and 2. The peaks at wavelengths of 1120-1200 nm and 1360-1450 nm are the second combination and second overtone of C-H in -CH2 and -CH3, respectively. Peaks in the regions of 1600-1650 nm is referred to the second overtone of the aromatic C-H group.
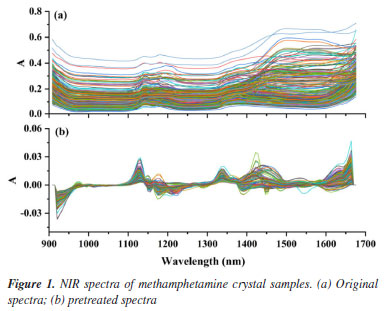
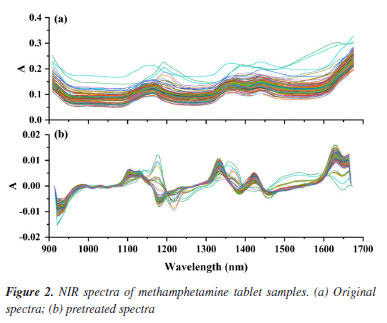
Spectral pretreatments were usually done before modelling to reduce the influence such as baseline drift.19,36,37 From Figures 1a and 2a, it can be clearly seen that the trends of the spectral curves are consistent, and most of them have same or similar absorption peaks, but most of the spectral lines have overlapping phenomena, while the spectra have more serious problems of baseline drift. In order to eliminate interference, the S-G method is used to pretreat the spectral data. The S-G method is one of the commonly used methods for smoothing and denoising spectral information, and the spectral preprocessing can effectively reduce the interference of background noise and environmental factors, improve the correlation between spectral data and chemical composition, and improve the accuracy and applicability of prediction models.44-46 Comparing Figures 1b and 2b, it can be seen that after preprocessing the spectra, the baseline drift is obviously corrected effectively, and the spectral peak information is more explicit. It indicates that the S-G preprocessing can effectively eliminate the interference of environmental factors. PLS quantitative modelling and validation of methamphetamine The accuracy of each model is expressed as the coefficient of determination (R2), adjusted root mean square error (RMSE). For each element and each spectral preprocessing method, the number of latent variables with the lowest resultant RMSECV was typically selected,45 larger R2 and smaller RMSECV indicate better model fit. Figures 3 and 4 show the results of fitting the NIR spectral data combined with PLS for methamphetamine crystals and methamphetamine tablets, respectively. The results show that the overall performance of the model is stable, and the predicted distribution of each indicator is concentrated around the target line, reflecting the overall reliability of the corresponding optimization modeling algorithm. The evaluation parameters of the PLS regression model were as follows: the evaluation metrics for the methamphetamine crystals calibration set were 99.50% R2 and 2.10% RMSECV (Figure 3a), and the corresponding values for methamphetamine tablets were 96.7 and 0.78% (Figure 4a); two models were validated for methamphetamine crystals (R2: 99.40%; RMSEV: 2.12%) (Figure 3b), and methamphetamine tablets (R2: 97.10%; RMSEV: 0.80%) (Figure 4b).
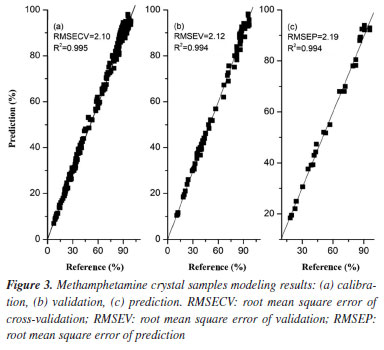
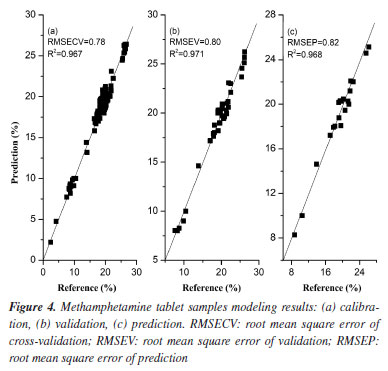
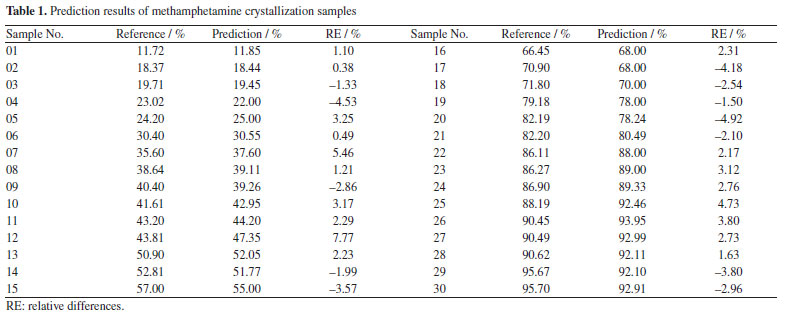
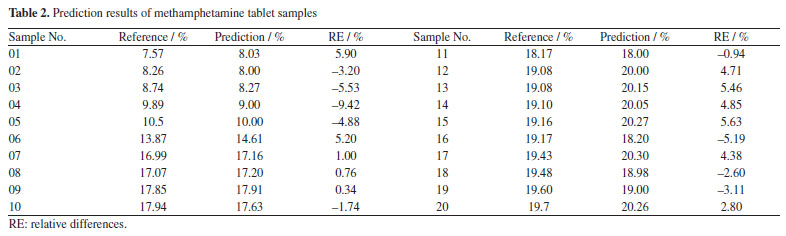
Finally, an independent sample set of 30 seized methamphetamine crystals and 20 methamphetamine tablets were used to testify the predictive power of the two models, respectively (Figures 3c and 4c). The evaluation metrics RMSEP for the prediction set were 2.19% (RPD of 12.45; RER of 38.35) and 0.82% (RPD of 4.15; RER of 16.92), respectively. According to the research of Barbin et al.39 and Parrini et al.,40 an RPD > 2.5 and RER > 10 can be considered to indicate good practicality of the models, sufficient for screening.39,40 Based on these ranges, it can be considered that the two types of methamphetamine PLS models in this experiment meet the requirements and can be used moderately in practice. Meanwhile, the content of the samples used in the experiments was measured by HPLC (reference methodology),37 and the reference physicochemical values of methamphetamine crystal samples set ranged from 11.72-95.70% (Table 1), while the content of methamphetamine tablet samples ranged from 7.57-19.70% (Table 2). The relative differences (RE%) between the reference values and the predicted values by the quantitative models were less than 10% in the predicted sample groups (Tables 1 and 2). The prediction results proved that the two quantitative models were acceptable for practical applications, and the results were consistent with those obtained by liquid chromatography. Some of the samples presented inferior results though the RE were below 10%. This is due to the complexity of the samples which makes it difficult for the samples to achieve good predictions.37,47 Although the matrices of the seized samples are more complex, the current model has basically covered the most common matrices and can meet the needs of daily usage.
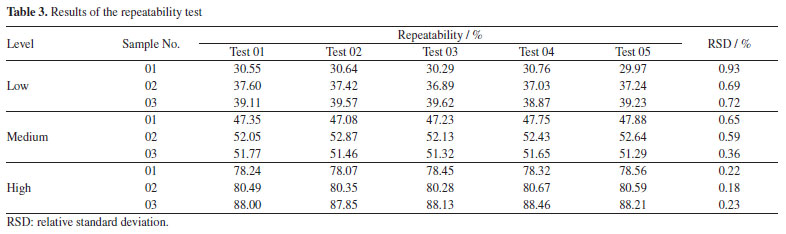
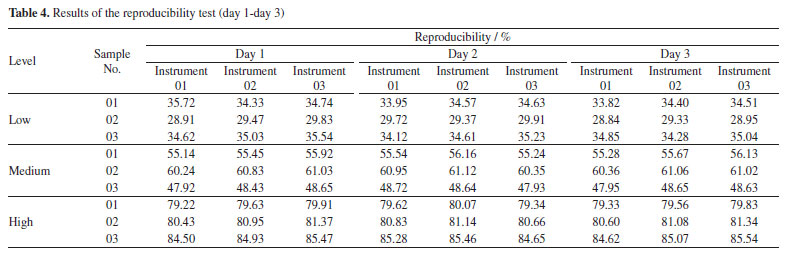
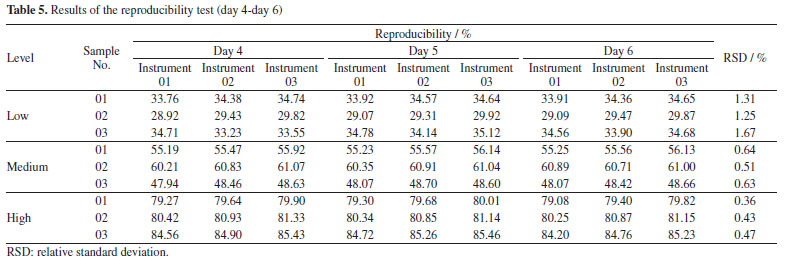
Repeatability and reproducibility test of PLS models While the RMSEP has been the main parameter for selecting the "best model",48 repeatability and reproducibility have also been considered and relevant tests were made for evaluation. In this study, the RSDs of repeatability for three levels of samples were controlled in the range of 0.18-0.93%, as shown in Table 3. Meanwhile, the reproducibility of each sample was tested for five consecutive days with three instruments and RSDs range for the nine samples was 0.36-1.67% (Tables 4 and 5). Liu et al.19,49 used NIR spectroscopy and multiple regression models to predict multiple types of drugs and their adulterants collected from multiple regions. The repeatability (RSD less than 3%) and reproducibility (RSD less than 5%) of their NIR quantitative models were higher than those obtained in this experiment, but the overall results showed that the methods were satisfactory. At the same time, some scholars have used50 the same method to predict compounds in diesel fuel50,51 and heroin.37 The reproducibility and repeatability range of its model is within an acceptable range of 0.1-8.59%. Thus, all of the above results demonstrate that using NIR spectroscopy and multiple regression modelling predictions can be used for the qualitative and quantitative analysis of substances.
CONCLUSIONS The combination of portable NIR technology with chemometric tools such as PLS has made it possible to develop portable, fast and inexpensive analytical methods. The NIR diffuse reflectance spectra of methamphetamine crystals and tablets were collected using a portable NIR analyzer. PLS was used to build two quantitative analysis models, with the R2 for all calibration models > 96.7%; also, the RMSEC, RMSECV, and RMSEP for all calibration models were smaller than 2.1, 2.12 and 2.19%, respectively. The quantitative model was predicted using actual captured samples, and the RE of the measured values to the true values were both below 10%. The repeatability (RSD: 0.18-0.93%) and reproducibility (RSD: 0.36-1.67%) of models were also within an acceptable range, and the results indicate that the methodology is acceptable for practical application. Thus, portable NIR spectroscopy combined with PLS regression modelling can enable rapid on-site detection of methamphetamine.
ACKNOWLEDGMENTS The authors gratefully acknowledge the financial support provided by the Science and Technology Planning Project of Guozhou Province under grant (Qian Ke He Zhi Cheng [2022] Yi Ban 279); the Opening Foundation of the Key Laboratory of Green Pesticide and Agricultural Bioengineering, the Ministry of Education, Guizhou University under grant 2020GDGP0105; the High School Science and Technology Talent Support Project of Guizhou Province, China (grant No. Qian Jiao He KY Zi [2021]037); High-Level Talent Initial Funding of Guizhou Industry Polytechnic College under grant (2023-RC-01); and the Natural Science Foundation of Education Buieau of Guizhou Province, China (grant No. [2021]053).
REFERENCES 1. United Nations Office on Drugs and Crime (UNODC), World Drug Report 2021, https://www.unodc.org/unodc/en/data-and-analysis/wdr2021.html, accessed in October 2024 2. Yang, X.; Wang, Y.; Li, Q.; Zhong, Y.; Chen, L.; Du, Y.; He, J.; Liao, L.; Xiong, K.; Yi, C.-x.; Yan, J.; Front. Mol. Neurosci. 2018, 11, 186. [Crossref] 3. Jayanthi, S.; Daiwile, A. P.; Cadet, J. L.; Exp. Neurol. 2021, 344, 113795. [Crossref] 4. Paulus, M. P.; Stewart, J. L.; JAMA Psychiatry 2020, 77, 959. [Crossref] 5. Zhao, Y.-L.; Zhao, W.; Liu, M.; Liu, L.; Wang, Y.; Oxid. Med. Cell. Longevity 2020, 8874304. [Crossref] 6. Kacinko, S. L.; Barnes, A. J.; Kim, I.; Moolchan, E. T.; Wilson, L.; Cooper, G. A.; Reid, C.; Baldwin, D.; Hand, C. W.; Huestis, M. A.; Forensic Sci. Int. 2004, 141, 41. [Crossref] 7. Strano-Rossi, S.; Castrignanò, E.; Anzillotti, L.; Serpelloni, G.; Mollica, R.; Tagliaro, F.; Pascali, J. P.; di Stefano, D.; Sgalla, R.; Chiarotti, M.; Forensic Sci. Int. 2012, 221, 70. [Crossref] 8. Jakobsson, G.; Truver, M. T.; Wrobel, S. A.; Gréen, H.; Kronstrand, R.; J. Anal. Toxicol. 2021, 45, 215. [Crossref] 9. Powers, D.; Erickson, S.; Swortwood, M. J.; J. Forensic Sci. 2018, 63, 1229. [Crossref] 10. Ng, T.-T.; So, P.-K.; Hu, B.; Yao, Z.-P.; J. Food Drug Anal. 2019, 27, 428. [Crossref] 11. Melucci, D.; Monti, D.; D'Elia, M.; Luciano, G.; J. Forensic Sci. 2012, 57, 86. [Crossref] 12. Tsujikawa, K.; Yamamuro, T.; Kuwayama, K.; Kanamori, T.; Iwata, Y. T.; Miyamoto, K.; Kasuya, F.; Inoue, H.; Forensic Sci. Int. 2014, 242, 162. [Crossref] 13. Pederson, C. G.; Friedrich, D. M.; Hsiung, C.; von Gunten, M.; O'Brien, N. A.; Ramaker, H.-J.; van Sprang, E.; Dreischor, M.; Proc. SPIE 2014, 9101, 91010O. [Crossref] 14. Wen, Q.; Lei, H.; Huang, J., Yu, F.; Huang, L.; Zhang, J.; Li, D.; Peng, Y.; Wen, Z.; Appl. Opt. 2019, 58, 4642. [Crossref] 15. Yusoff, M. Z.; Chang, K. H.; Abdullah, A. F. L.; Aust. J. Forensic Sci. 2018, 50, 543. [Crossref] 16. da Silva, A. F.; Grobério, T. S.; Zacca, J. J.; Maldaner, A. O.; Braga, J. W. B.; Forensic Sci. Int. 2018, 290, 169. [Crossref] 17. Malegori, C.; Marques, E. J. N.; de Freitas, S. T.; Pimentel, M. F.; Pasquini, C.; Casiraghi, E.; Talanta 2017, 165, 112. [Crossref] 18. Sun, Z.; Li, C.; Li, L.; Nie, L.; Dong, Q.; Li, D.; Gao, L.; Zang, H.; Spectrochimica Acta, Part A 2018, 201, 153. [Crossref] 19. Liu, C.-m.; Han, Y.; Min, S.-g.; Jia, W.; Meng, X.; Liu, P.-p.; Forensic Sci. Int. 2018, 290, 162. [Crossref] 20. Rebiere, H.; Ghyselinck, C.; Lempereur, L.; Brenier, C.; Drug Test. Anal. 2016, 8, 370. [Crossref] 21. Sorak, D.; Herberholz, L.; Iwascek, S.; Altinpinar, S.; Pfeifer, F.; Siesler, H. W.; Appl. Spectrosc. Rev. 2012, 47, 83. [Crossref] 22. da Silva, V. H.; da Silva, J. J.; Pereira, C. F.; J. Pharm. Biomed. Anal. 2017, 134, 287. [Crossref] 23. Correia, R. M.; Tosato, F.; Domingos, E.; Rodrigues, R. R. T.; Aquino, L. F. M.; Filgueiras, P. R.; Lacerda Jr., V.; Romão, W.; Talanta 2018, 176, 59. [Crossref] 24. de Souza, L. M.; Mitsutake, H.; Gontijo, L. C.; Borges Neto, W.; Fuel 2014, 130, 257. [Crossref] 25. Włodarska, K.; Khmelinskii, I.; Sikorska, E.; J. Spectrosc. 2018, 2018, 5191283. [Crossref] 26. Krepper, G.; Romeo, F.; Fernandes, D. D. S.; Diniz, P. H. G. D.; de Araújo, M. C. U.; Di Nezio, M. S.; Pistonesi, M. F.; Centurión, M. E.; Spectrochimica Acta, Part A 2018, 189, 300. [Crossref] 27. Kawamura, K.; Ikeura, H.; Phongchanmaixay, S.; Khanthavong, P.; Remote Sens. 2018, 10, 1249. [Crossref] 28. Qi, Z.; Wu, X.; Yang, Y.; Wu, B.; Fu, H.; Foods 2022, 11, 763. [Crossref] 29. Zhang, J.; Wu, X.; He, C.; Wu, B.; Zhang, S.; Sun, J.; Foods 2024, 13, 1439. [Crossref] 30. Wu, X.; Wang, Y.; He, C.; Wu, B.; Zhang, T.; Sun, J.; Foods 2024, 13, 1783. [Crossref] 31. Hu, C.; Xu, H.; Fu, Z.; Wu, B.; Zhang, R.; Zhi, C.; Int. J. Food Prop. 2023, 26, 3275. [Crossref] 32. Chanachot, K.; Saechua, W.; Posom, J.; Sirisomboon, P.; Foods 2023, 12, 3844. [Crossref] 33. Zhang, T.; Wu, X.; Wu, B.; Dai, C.; Fu, H.; J. Food Process Eng. 2022, 45, e14040. [Crossref] 34. Jović, O.; Smolić, T.; Primozič, I.; Hrenar, T.; Anal. Chem. 2016, 88, 4516. [Crossref] 35. Zhang, J.; Yang, J.; Chen, J.; Hu, J.; Yang, S.; J. Near Infrared Spectrosc. 2022, 30, 337. [Link] accessed in October 2024 36. Correia, R. M.; Domingos, E.; Tosato, F.; dos Santos, N. A.; Leite, J. A.; da Silva, M.; Marcelo, M. C. A.; Ortiz, R. S.; Filgueiras, P. R.; Romão, W.; Anal. Methods 2018, 10, 593. [Crossref] 37. Chen, Y.; Liu, S.; Yang, Y.; Qian, Z.; Wang, B.; An, C.; Liu, C.; Min, S.; Aust. J. Forensic Sci. 2021, 53, 40. [Crossref] 38. Correia, R. M.; Domingos, E.; Tosato, F.; Aquino, L. F. M.; Fontes, A. M.; Cáo, V. M.; Filgueiras, P. R.; Romão, W.; Forensic Chem. 2018, 8, 57. [Crossref] 39. Barbin, D. F.; Kaminishikawahara, C. M.; Soares, A. L.; Mizubuti, I. Y.; Grespan, M.; Shimokomaki, M.; Hirooka, E. Y. P.; Food Chem. 2015, 168, 554. [Crossref] 40. Parrini, S.; Staglianò, N.; Bozzi, R.; Argenti, G.; Animals 2022, 12, 86. [Crossref] 41. Boukerche, A.; Zheng, L.; Alfandi, O.; ACM Computing Surveys 2020, 53, 55. [Crossref] 42. IBM Corp.; IBM SPSS Statistics for Windows, version 27.0; IBM Corp., Armonk, NY, USA, 2020. 43. Liu, S.; Chen, Y. M.; Wu, J. J.; Wang, F.; Bai, S.; figshare, 2025. [Crossref] 44. Igne, B.; Reeves, J. B.; McCarty, G.; Hively, W. D.; Lund, E.; Hurburgh Jr., C. R.; J. Near Infrared Spectrosc. 2010, 18, 167. [Crossref] 45. Buddenbaum, H.; Steffens, M.; Appl. Environ. Soil Sci. 2012, 2012, 274903. [Crossref] 46. Chen, H.; Zhang, Y.; Qi, H.; Li, D.; Optik 2019, 195, 162861. [Crossref] 47. Salmeron, J. L.; Correia, M. B.; Palos-Sanchez, P. R.; Complexity 2019, 2019, 8160659. [Crossref] 48. Hwang, H.; Cho, G.; Psychometrika 2020, 85, 947. [Crossref] 49. Liu, C. M.; Han, Y.; Jia, W.; Hua, Z. D.; Min, S. G.; Spectrosc. Spectral Anal. 2020, 40, 2732 (in Chinese). [Link] accessed in October 2024 50. Velvarská, R.; Vráblík, A.; Fiedlerová, M.; Černý, R.; Chem. Pap. 2019, 73, 2987. [Crossref] 51. Hradecká, I.; Vráblík, A.; Frątczak, J.; Sharkov, N.; Černý, R.; Hönig, V.; ACS Omega 2023, 8, 4038. [Crossref]
#Shan Liu and Yuemeng Chen contributed equally to this work. |

On-line version ISSN 1678-7064 Printed version ISSN 0100-4042
Qu�mica Nova
Publica��es da Sociedade Brasileira de Qu�mica
Caixa Postal: 26037
05513-970 S�o Paulo - SP
Tel/Fax: +55.11.3032.2299/+55.11.3814.3602
Free access