
 |
 |
 |
 |
 |
Artigo
| A green and efficient HPLC-DAD method for the analysis of phenolic compounds in orange waste |
|
Mirella T. Ferreira RanzetiI I. Green Biotech Network, Universidade Estadual Paulista (UNESP), 17033-360 Bauru - SP, Brasil Received: 08/19/2024 *e-mail: daniel.rinaldo@unesp.br This study presents a sustainable high-performance liquid chromatography photodiode array detection (HPLC-DAD) method for analyzing polar phenolic compounds in sweet orange (Citrus sinensis) residues. Fractional factorial design was used to identify significant variables affecting method efficiency, which were subsequently optimized using Doehlert design. The optimized conditions were: initial ethanol percentage = 20%, final ethanol percentage = 75.3%, analysis temperature = 40 ºC, percentage of acetic acid in water = 0.4%, flow rate = 0.5 mL min-1, time = 35 min, and C-18 column (250 × 4.6 mm). The method effectively separated and allowed the identification of phenolic acids, vitexin, and hesperidin, while adhering to green chemistry principles, making it a safer and more environmentally friendly alternative to traditional methods, complying with principles 2, 4, 5, 6, 7, 8, 9, 10, 11 and 12 of the Green Analytical Chemistry (GAC), bringing a low cost of analysis, with little energy expenditure, low toxic solvents from renewable sources, little waste generation and safety in operation. INTRODUCTION Orange production is an important global agricultural business, with Brazil being the largest producer, with an output of around 16.9 million tons per year, followed by China with 7.55 million tons and the European Union with 6.1 million tons.1 This production holds substantial economic and social importance for the country and is extensively marketed, primarily as concentrated and frozen orange juice. The consumption of oranges is also of great value to human health, as the fruit contains more than 170 phytochemicals, including over 60 types of flavonoids, known for their antioxidant, anti-inflammatory, and potential anti-cancer properties.2 In addition to utilizing the fruit itself for extracting compounds of industrial interest, such as hesperidin, caffeic acid, naringenin, and coumaric acid,3 there is also an opportunity to use its waste. The production of agro-industrial waste is a cause for concern in today's society due to improper disposal and, in Brazil, around 50% of orange production becomes waste, much of which is discarded while the rest is underutilized.4 Therefore, developing reuse techniques is essential to minimize environmental impacts and convert this waste into products with higher added value, both ecologically and sustainably. For the industry, compounds such as phenolic acids and flavonoids are of great importance because they are compounds that have various bioactivities, such as antioxidant characteristics, with great potential for being transformed into drugs, cosmetics, and others.5 Among these compounds of interest, hesperidin is an important flavonoid present in the fruit, being the most abundant in oranges, which can be extracted in large quantities from its peel and works very well with vitamin C.6 Analyzing and identifying the compounds from this fruit is essential to investigate the chemical and biological properties that act on the organisms of those who consume them. To this end, one of the most common methods used is high-performance liquid chromatography (HPLC). This technique is very sensitive, selective, and high-resolution, making it ideal for analyzing plant-based products, for example, and it can also be coupled with several different techniques that guarantee a clearer and more precise analysis, such as photodiode array (DAD).7 HPLC makes it possible to identify and quantify a variety of compounds in complex matrix samples. It is therefore crucial to develop an appropriate chromatographic method according to the characteristics of the compounds present in these matrices to obtain analyses with good resolutions. In this context, the main chromatographic parameters, such as mobile phase, temperature, flow rate, and analysis time must be optimized to obtain a good separation of compounds in the shortest possible time and make a more accurate identification.8 Unfortunately, most studies in Natural Products use toxic solvents such as acetonitrile and methanol in the mobile phase of HPLC9 because they have good characteristics for analysis such as: dissolving a wide range of solutes, low acidity, minimal chemical reactivity, low absorbance in the UV region and compatibility with mass spectrometry. Although there are other less toxic solvents as potential substitutes, many methodologies use acetonitrile, for example, because they follow old study protocols, which makes the work less costly but exposes analysts to unhealthy environments, as well as making analysis more polluting. Given this context, with the technological alternatives available today, the development of methods that are less aggressive to the environment is a possible task for both large and small research centers. Therefore, for the development of non-polluting methods for the analysis of plant extracts, the chemical diversity of the extracts to be studied becomes an important factor for the breadth of application. Chromatographic methods must be developed from a holistic perspective due to the complexity of the matrix, and the use of design of experiments (DoE) can be effective in achieving this goal. As opposed to the univariate (or "trial and error") approach, DoE involves a multifactorial approach that enables a simultaneous, unbiased, and systematic evaluation of factors of interest in the development of the method for chromatographic profiling by HPLC, as well as obtaining maximum information from the experimental data with a reduced number of experiments, saving time and resources. In addition, it allows researchers to identify interactions between the factors investigated and to construct response surfaces, valuable for predicting optimal experimental conditions.10,11 Finally, to be environmentally responsible, the selection of factors to be evaluated, the function and/or response to be monitored and even the experimental design chosen should take into account the principles of Green Analytical Chemistry (GAC).12 Therefore, the study presented in this paper was guided by the principles and concepts of GAC with multivariate and multianalyte approaches, analyzing chromatographic and sustainability parameters equally and using appropriate and complementary response functions. Food-grade bioethanol was chosen as the organic phase for a conventional HPLC system due to its low toxicity because it is biodegradable, sustainable, and inexpensive in Brazil. In addition, although there are miniaturized technological alternatives that significantly reduce the use of solvents, such as ultra-efficient liquid chromatography (UHPLC), conventional HPLC was used in this work because it is a technique that requires lower-cost instrumentation, contributing to lowering the costs of the green method developed and thus making it feasible to apply in small research or quality control centers and laboratories.
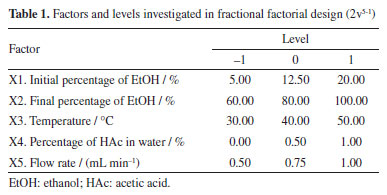
EXPERIMENTAL Materials and methods Reagents The solvents used as the mobile phase for HPLC analysis were food-grade ethanol (bioethanol, EtOH 96%; Kalim, Brazil), and ultra-purified water with HPLC-grade acetic acid (HAc, 99.9%; Merck®, St. Louis, MO, USA) varying in concentration by 0.4, 0.5, 1.0, and 1.5%. The standards used to identify compounds for HPLC analysis were: caffeic acid, vitexin, p-coumaric acid, ferulic acid, naringin, hesperidin, and naringenin (all Sigma-Aldrich®, St. Louis, MO, USA). The orange waste was provided by Fazenda Guacho, in Santa Cruz do Rio Pardo, São Paulo, Brazil. Preparation of the extract The residue was frozen, freeze-dried for 48 h at a temperature of -20 ºC (Alpha 1-2 LDplus, Martin Christ®), and then pulverized in an industrial processor (Bermar®). A quantity of 1 g of the powder was subjected to dynamic maceration with 20 mL of a 7:3 (v/v) EtOH/water extractant solution for 4 h at 25 ºC and 250 rpm, on a magnetic stirrer with probe (MR Hei-Tec, Heidolph®), resulting in a concentration of 50 mg mL-1 (plant material / volume of extracting solvent). The extract was then transferred to a 1.5 mL microtube (Eppendorf®) and centrifuged for 8 min at 1500 rpm. The supernatant was filtered through a 0.45 µm polytetrafluoroethylene (PTFE) microfilter (Allcrom®) and transferred to 1.5 mL vials for subsequent injection into the HPLC-DAD. HPLC-DAD analysis The analyses were performed in an HPLC apparatus (Shimadzu®) equipped with a 4-channel pump (LC-20AT), automatic sampler (SIL-20A), column oven (CTO-10AS), photodiode array detector (SPD-M20A), C-18 reverse phase column (250 × 4.60 mm, 5 µm; Luna Phenomenex®) coupled to a pre-column of the same stationary phase (Phenomenex®). The injection volume was 20 µL, the solvents used were water + HAc (A) and EtOH (B) and the analysis was monitored at λ = 283 nm. Screening of variables (fractional factorial design - 2v5-1) To develop the method, the GCF (green chromatographic fingerprinting) experiment planning method developed by Souza et al.13 was used as a parameter (Equation 1).  where n is the total number of peaks in the chromatogram, FP represents the peaks in the first half of the chromatogram and MP represents the peaks in the second half of the chromatogram. Finally, trl represents the time of the last peak, disregarding dead time. The design was initially carried out with a series of 20 experiments in which 5 factors were varied, with an analysis time of 60 min (Table 1).
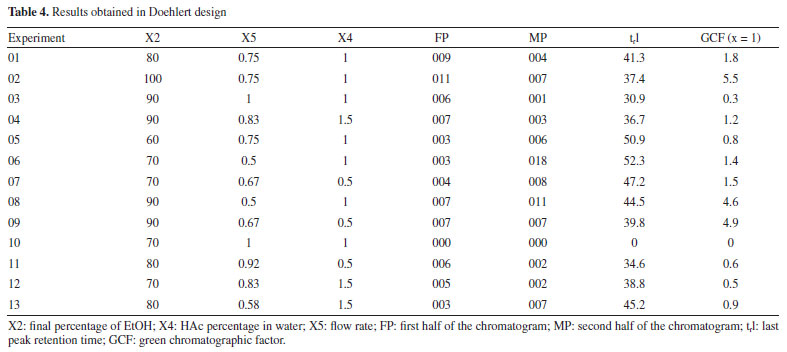
To calculate the efficiency of each experiment using the GCF response function, the total number of peaks (n), the number of peaks in each half of the chromatograms (FP and MP), and the time of the last peak (trl) were obtained from each chromatogram of the analyses, disregarding the dead time. Doehlert design Based on the data obtained in the fractional factorial design, the significant variables were selected to be optimized in the Doehlert design (Table 2).
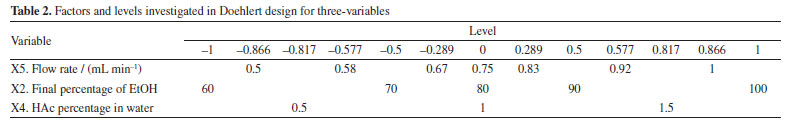
The analysis time and flow rate remained the same as those used in the variable screening. The variables that were not significant in the screening were set at the level where the best experimental response was obtained, which was 20% initial EtOH (X1) and a temperature of 40 ºC (X3). Identification of the compounds of interest The compounds were identified by comparing the extracted compounds with authentic standards using the UV spectra and retention time of the chromatographic peaks, and co-injection experiments. Method validation To assess the selectivity of the method developed, modern detectors such as diode arrays or mass spectrometry are used. Therefore, for this method, a diode array detector was used to identify the target compounds, guaranteeing the method's selectivity. In addition, another important parameter for verifying the efficiency of the method is through precision measurements. To do this, and following ANVISA14 and ICH (International Conference on Harmonization)15 recommendations, the respective absolute standard deviation estimates (s) can be calculated, where xi is the individual value of the measurement, x- is the population mean and n is the number of measurements (Equation 2).16 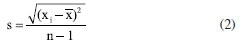 In addition to the absolute standard deviation, another recommended measure is the relative standard deviation (RSD), also known as the coefficient of variation (Equation 3).16 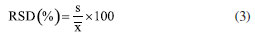 Precision in method validation is also expressed in terms of instrumental precision and repeatability, where successive measurements are carried out using the same method, the same analysis conditions, the same location, equipment, and analyst, and in a short period to analyze the agreement between the measurements taken.16 Instrumental precision estimation was performed for nine consecutive injections of the same sample at the concentration of 50 mg mL-1 and repeatability was calculated based on twenty-seven experiments, varying sample concentrations in three levels (10, 25, and 50 mg mL-1) and three replicates of each level over three days. Finally, robustness is an essential parameter for measuring the sensitivity of the method developed. To do this, small variations in pH, temperature, ionic strength of the mobile phase, and others are carried out to investigate how much these factors interfere at the time of analysis in triplicate at the concentration of 50 mg mL-1.16 Analysis of results and environmental impact The efficiency and environmental impact of the green method developed were compared with two reference chromatographic methods: Swatsitang et al.3 and Iglesias-Carres et al.17 Two criteria were used to select the reference methods: (i) studies involving the use of HPLC analysis of C. sinensis compounds and (ii) the highest number of citations in the SciFinder® database. The reference chromatographic methods were reproduced, and the efficiencies were compared using the GCF metric. To compare the environmental impact, the AGREE (Analytical GREEnness Metric Approach and Software; Pena-Pereira et al.)18 and GAPI (Green Analytical Procedure Index; Płotka-Wasylka)19 metrics were used, which use criteria based on the 12 principles of GAC to calculate the scores for each method. All analyses were performed in triplicate (n = 3) and the results were analyzed at a 95% confidence level by analysis of variance (ANOVA).11 All the statistical calculations in this study were carried out using the LibreOffice Calc®20 and Octave® software.21
RESULTS AND DISCUSSION Variable screening A series of 20 experiments was conducted according to the parameters described in "Screening of variables (fractional factorial design - 2v5-1)" sub-sub-section, using the GCF factor as the response. Experiments 17, 18, 19, and 20 were the central points (Table 3). The design was used to identify the significant chromatographic variables for separating the main compounds present in C. sinensis residues by HPLC.
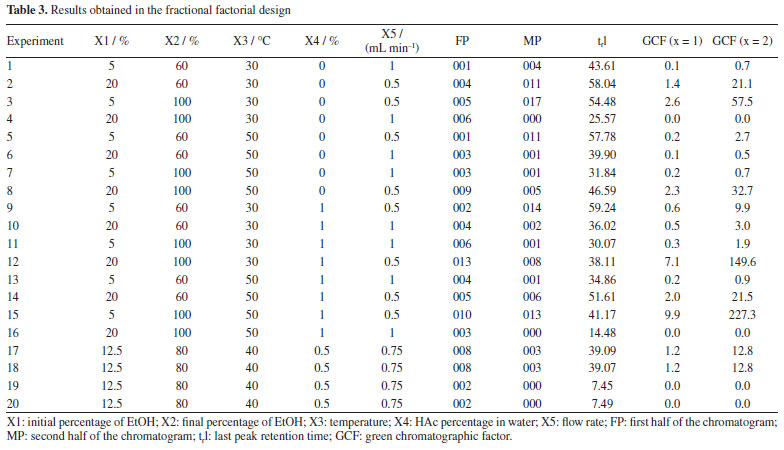
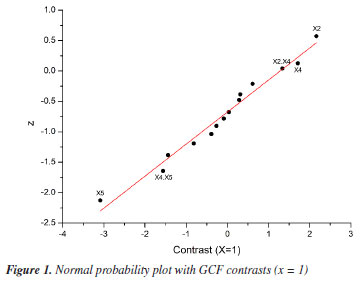
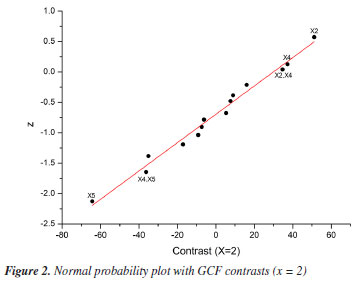
Based on the results, normal probability plots for the GCF responses (x = 1 and x = 2) were generated, reflecting the interactions between variables and calculated contrasts (Figures 1 and 2). It was thus possible to identify that the variables X2, X4, and X5, as well as the interactions between them, proved to be more significant in separating the majority chromatographic peaks, in addition to the number of peaks per time. Besides that, the strong synergistic interaction between X2 and X5 leads to a better distribution of peaks in the chromatogram (Figure 2S, Supplementary Material), which is essential for adjusting the analysis time at the end of the process. The significant variables were more favorable at their +1, +1, and -1 levels, respectively, which correspond to X2 = 100%, X4 = 1% and X5 = 0.5 mL min-1 (experiment 15, Table 3). These variables are essential for greater efficiency in the analysis, so they were chosen for a more detailed statistical analysis, with a greater number of levels, using Doehlert design.
For the less significant variables, values were assigned according to the level at which they showed the greatest responses, also considering the resolution of the main chromatographic peaks and the elution time of the last peak. The initial EtOH percentage variable (X1) was set at 20% because it showed the second highest response (experiment 12, Table 3), the best resolution of the main chromatographic peaks (Figure 1S, Supplementary Material), and the shortest elution time of the final peak. The temperature variable (X3) was assigned a value of 40 ºC, as it is the midpoint of the levels that showed the best responses, in experiments 12 and 15 (Table 3; Figures 1S and 2S). This temperature requires less energy than 50 ºC (the temperature of the experiment with the best response) but maintains satisfactory resolutions of the main chromatographic peaks. Doehlert design Based on the information obtained in the fractional factorial design, the significant variables were submitted to the 3-variable Doehlert design to calculate the values that provide the best condition for separating the compounds from the orange waste using HPLC (Table 4). As the GCF (x = 1) response function was equivalent to the GCF (x = 2) in the screening of variables, it was decided to use only the GCF (x = 1) as the response in this new design, the best results of which are shown in Figures 3S-5S (Supplementary Material).
The response surfaces (Figure 3), obtained from the mathematical model estimated by Doehlert design (Equation 4), made it possible to identify the regions where the values of the variables show maximum efficiency. 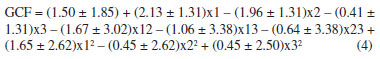
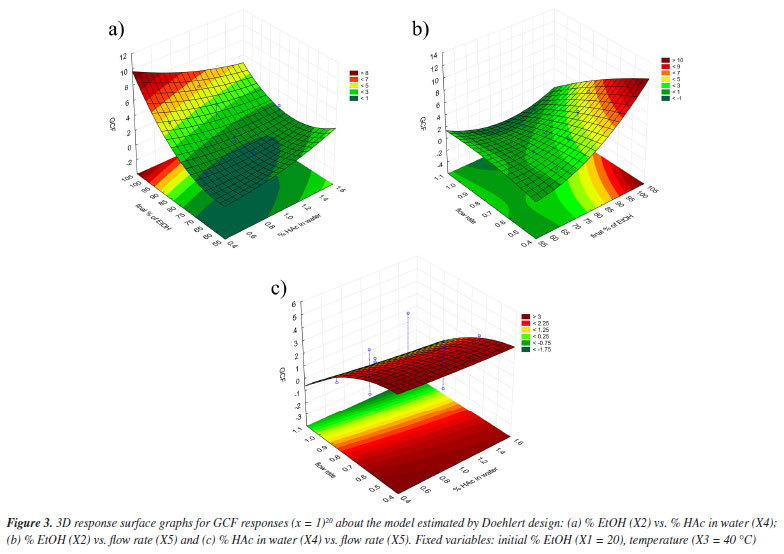
The optimum final percentage of EtOH (X2) would be in the region of 100% (Figure 3a). For the variable percentage of HAc in water (X4), the optimum region comprised the extreme values used in the development of the method, ranging from 0.4 to 1.8% (Figure 3b), depending on the flow rate (X5). Because of this, the value of 0.4% was set as the optimum for variable X4, as a lower concentration of HAc has a lower environmental impact. The optimum region for the flow rate variable (X5) was between 0.5 and 0.4 mL min-1 (Figure 3c). Because of this, experiments were carried out (n = 3) comparing the two flow rates and it was found that the majority of chromatographic peaks showed better resolution when the flow rate was 0.5 mL min-1. As a result, it was possible to conclude that the variation in final percentage of EtOH (X2) directly interfered with the elution force of the mobile phase, working on the distribution of the peaks in the chromatogram. On the other hand, the percentage of HAc in water (X4) was responsible for a possible suppression of the ionization of the acid metabolites in the complex matrix, bringing a better resolution to the peaks. The low flow rate (X5) obtained (0.5 mL min-1) resulted in greater diffusion of the analyte, resulting in more theoretical plates and better separation of the peaks. Finally, as the GCF response function used in the design has the time of the last chromatographic peak as one of the main terms in the equation, it was possible to adjust the optimum analysis time to the value of the retention time of the last chromatographic peak eluted under the optimum conditions. However, it was necessary to adjust the final percentage of EtOH according to the rate of change of EtOH determined in the optimum condition to maintain the chromatographic resolution obtained. Analysis of the calculated model The ANOVA (Table 5) shows two pieces of information that are very important for concluding the method: the regression and the lack of fit. In the regression, it is possible to see that the tests are not significant, indicating that the model does not fit as it should.11 This is because it is not possible to move forward on the response surface to obtain the optimum point, since the GCF response function in the design includes the time of the last chromatographic peak as a criterion, flow rates above 0.5 mL min-1 were not considered.
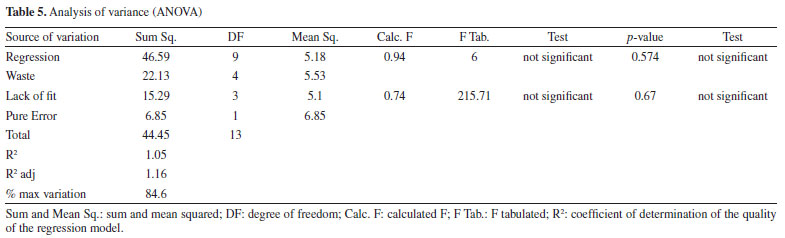
About the lack of fit, the test indicates that it is not significant, which shows that the method developed is efficient and does not need to be optimized again.11 Therefore, the method can be concluded based on the best experimental responses and will be efficient for its intended use. Identification of the compounds of interest To identify the compounds of interest, the UV spectra and retention time of the chromatographic peaks of the orange waste chromatogram were compared with those of authentic standards, and then co-injection experiments were performed for confirmation. As a result, it was possible to identify the 2 main markers of C. sinensis and a further 4 phenolic compounds, totaling 7 compounds in the chromatographic profile of the residue: caffeic acid, vitexin, p-coumaric acid, ferulic acid, naringin, hesperidin and naringenin (Figure 4, Figures 6S-12S, Supplementary Material).
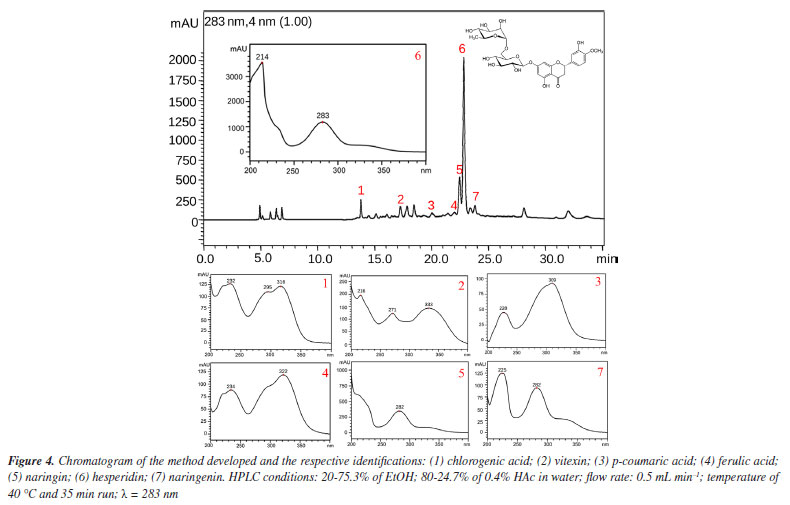
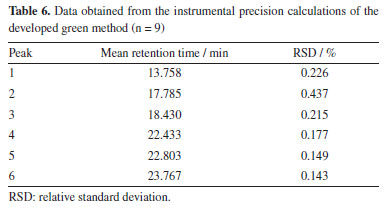
Although the resolution does not exceed 1.5 mark for all peaks, it is important to emphasize that because these compounds are widely known and are of great interest to the pharmaceutical and food industries, the authors of this study considered the identification of these compounds by HPLC-DAD alone to be satisfactory at the concentrations evaluated, reaffirming their proposal to develop an efficient and low-cost method for analyzing the main compounds present in orange waste. However, at concentrations where the plant material / volume of extracting solvent ratio is less than 10 mg mL-1 (lowest concentration evaluated in this work), the identification of peaks 4 and 5 may be impaired. In this case, co-injection experiments or the application of this green method in an HPLC system coupled to a mass spectrometer may be necessary. Method validation The parameters of selectivity, precision, and repeatability were used to reproduce the measurements and, using Equations 2 and 3, the data contained in Table 6 was obtained, where it can be seen that the standard deviations obtained are small values according to ANVISA14 and ICH15 standards (which determines that the RSD must be > 5%),14 thus showing that the deviations between each measurement are minimal, giving greater reliability to the method developed.
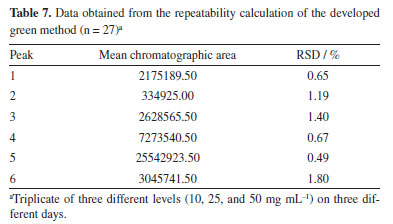
In addition to the retention time, the chromatographic peak areas of the chromatograms obtained were also considered, as shown in Table 7. With this, the deviations in the values of the chromatographic peak areas are also small.14,15
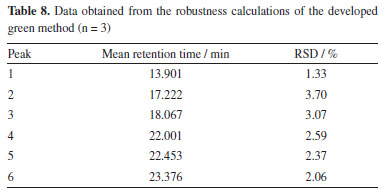
The same calculations were carried out for the robustness parameter using the chromatograms generated for each percentage of acetic acid in water, ranging from 0.4 to 1.5%. The data obtained is shown in Table 8, once again showing a low deviation, in line with that determined by INMETRO (DOQ-CGCRE-008)22 and therefore robustness in the method developed, bringing reliability to this measurement.
This study aimed to develop a green and sustainable method to obtain the fingerprint of orange waste, identifying the main compounds present. The validation of the optimized green method was conducted qualitatively since the determination of the fingerprint by HPLC-DAD is not a quantitative method. Therefore, the parameters analyzed, and the validation aspects differ from the general methods of analysis. The authenticity and identification of the quality of a plant extract can be accurately verified using chromatographic fingerprints, regardless of variations between batches or concentrations in different samples.23,24 Based on these characteristics of the fingerprints, the quality was evaluated through the retention time and the area of the 7 main peaks (markers). Environmental impact assessment The AGREE and GAPI metrics were used to calculate the environmental impact of the developed method and two published methods that analyzed extracts from C. sinensis waste by HPLC (Figure 5, Figures 13S-15S, Supplementary Material).
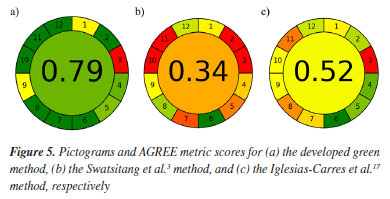
It can therefore be seen that the developed green method is efficient and greener than those found in the literature,3,17 being as good as or even better than existing methods. Something important to note is factor 3, which was considered not green in both experiments and relates to the form of analysis, which in both cases was off-line, meaning that both were carried out by manual processes, a parameter considered not very green for AGREE.18 Another noteworthy point is parameter 7, which concerns the amount of solvent used. Although we try to get around it, analytical methods such as HPLC require solvents for the analysis to take place. Their quantity can and should be reduced, but the waste generated is, until now, unavoidable. This project therefore aims to reduce the quantities of solvents used as much as possible. Finally, parameters 10 and 11 relate to the use of toxic solvents and operator safety,18 being considered non-green for the conventional methods compared. It can therefore be concluded that the method developed is safe for the environment and the operators of the technique. In addition to the AGREE metric, the GAPI tool metric19 was used for comparison, which once again shows that the method developed is greener than those found in the literature, as shown in Figure 6. The center of the image is red (not ideal) in all methods because both need to go through the extraction process, which the metric considers to be not green.
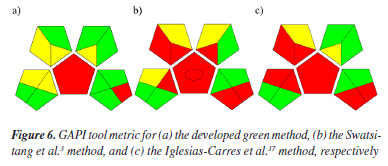
It was possible to see that in all the metric categories (sample preparation, reagents used, sample preservation, transportation, and storage and instrumentation),19 the developed method is safer for both the environment and its operators, with only two of the variables in red (not ideal), where the first is due to the macro-extraction carried out (top left) and the amount of residue being greater than 10 mL (bottom right), given the sum of the extraction process and chromatographic analysis. Thus, the method developed encompasses 10 of the 12 principles of GAC:12 (2) minimal sample size and minimal number of samples; (4) integration of analytical processes and operations, saving energy and reducing the use of reagents; (5) automated and miniaturized methods; (6) derivatization avoided; (7) generation of a small volume of analytical waste and proper management of analytical waste; (8) multi-analyte or multi-parameter methods; (9) use of energy minimized; (10) reagents obtained from renewable source; (11) toxic reagents eliminated or replaced, and (12) the safety of the operator.
CONCLUSIONS This study successfully demonstrated an efficient, cost-effective, and environmentally friendly HPLC-DAD method for obtaining the chromatographic profile of orange (C. sinensis) waste. The method simultaneously considered separation and environmental parameters using the GCF function. The strategy, developed through experimental design combined with the response surface methodology, made the process more objective, requiring fewer experiments and reducing overall costs. A biodegradable organic modifier, bioethanol (95º GL), was used due to its low toxicity and renewable origin. Although bioethanol is more viscous than traditional solvents like acetonitrile, the system pressure remained below 14.5 MPa, allowing the method to be applied in a conventional HPLC system without requiring expensive modifications to the instrumentation. The adoption of this approach represents a commitment to efficiency by integrating the principles of Green Analytical Chemistry and the bioeconomy. These practices address the urgent need for safe, sustainable, and efficient methodologies in today's world.
SUPPLEMENTARY MATERIAL This work contains supplementary material, available at http://quimicanova.sbq.org.br/, as a PDF file, with free access.
ACKNOWLEDGMENTS The authors gratefully acknowledge financial support from the National Council for Scientific and Technological Development (CNPq), National Institute of Science and Technology (INCT BioNat), grant No. 465637/2014-0, and the São Paulo Research Foundation (FAPESP), grants No. 2014/50926-0 and No. 2014/50926-0
REFERENCES 1. Statista, Leading Orange Producing Countries Worldwide in 2023/2024 (in Million Metric Tons), https://www.statista.com/statistics/1044840/major-orange-producers-worldwide/, accessed in December 2024. 2. Raimundo, M. G. M.; Machado Filho, J. V.; Manual de Citros; Coordenadoria de Desenvolvimento dos Agronegócios: São Paulo, 2018. [Link] accessed in December 2024 3. Swatsitang, P.; Tucker, G.; Robards, K.; Jardine, D.; Anal. Chim. Acta 2000, 417, 231. [Crossref] 4. dos Santos, L. A.; Santos, A. F. M. S.; Valença, R. B.; Jucá, J. F. T.; Oliveira, C. R. M.; Revista Geama 2018, 4, 022. [Link] accessed in December 2024 5. Favela-Hernández, J. M.; González-Santiago, O.; Ramírez-Cabrera, M. A.; Esquivel-Ferriño, P. C.; Camacho-Corona, M. R.; Molecules 2016, 21, 247. [Crossref] 6. Garg, A.; Garg, S.; Zaneveld, L. J.; Singla, A. K.; Phytother. Res. 2001, 15, 655. [Crossref] 7. Tistaert, C.; Dejaegher, B.; Heyden, Y. V.; Anal. Chim. Acta 2011, 690, 148. [Crossref] 8. Moldoveanu, S. C.; David, V.; Selection of the HPLC Method in Chemical Analysis; Elsevier: Kidlington, 2016, ch. 4. 9. Funari, C. S.; Rinaldo, D.; Bolzani, V. S.; Verpoorte, R.; J. Nat. Prod. 2023, 86, 440. [Crossref] 10. Souza, O. A.; Carneiro, R. L.; Vieira, T. H. M.; Funari, C. S.; Rinaldo, D.; Food Anal. Methods 2018, 11, 1977. [Crossref] 11. Barros Neto, B.; Scarminio, I. S.; Bruns, R. E.; Como Fazer Experimentos: Pesquisa e Desenvolvimento na Ciência e na Indústria, 4ª ed.; Editora Bookman: Porto Alegre, 2010. 12. Gałuszka, A.; Migaszewski, Z.; Namieśnik, J.; TrAC, Trends Anal. Chem. 2013, 50, 78. [Crossref] 13. Souza, O. A.; Furlani, R. P.; Ramalhão, V. G. S.; Borges, M. S.; Funari, C. S.; Bolzani, V. S.; Rinaldo, D.; Phytochem. Lett. 2021, 43, 200. [Crossref] 14. Agência Nacional de Vigilância Sanitária (ANVISA); Resolução RE No. 899, 05/29/2003; Guia para Validação de Métodos Analíticos e Bioanalíticos Métodos Analíticos; Ministério da Saúde, Brasil, 2003. [Link] accessed in December 2024 15. International Conference on Harmonisation (ICH); Note for Guidance on Validation of Analytical Procedures: Text and Methodology (CPMP/ ICH/381/95); European Medicines Agency: London, UK, 1995. [Link] accessed in December 2024 16. Ribani, M.; Bottoli, C. B. G.; Collins, C. H.; Jardim, I. C. S. F.; Melo, L. F. C.; Quim. Nova 2004, 27, 771. [Crossref] 17. Iglesias-Carres, L.; Mas-Capdevila, A.; Bravo, F. I.; Aragonès, G.; Muguerza, B.; Arola-Arnal, A.; PLoS One 2019, 14, e0211267. [Crossref] 18. Pena-Pereira, F.; Wojnowski, W.; Tobiszewski, M.; Anal. Chem. 2020, 92, 10076. [Crossref] 19. Płotka-Wasylka, J.; Talanta 2018, 181, 204. [Crossref] 20. LibreOffice Calc®; LibreOffice, Star Division, DE, 2010. 21. Octave®; GNU Octave, USA, 2023. 22. Instituto Nacional de Metrologia, Normalização e Qualidade Industrial (INMETRO), DOQ-CGCRE-008, https://www.gov.br/cdtn/pt-br/assuntos/documentos-cgcre-abnt-nbr-iso-iec-17025/doq-cgcre-008/view, accessed in December 2024. 23. Gong, F.; Liang, Y.-Z.; Xie, P.-S.; Chau, F.-T.; J. Chromatogr. A 2003, 1002, 25. [Crossref] 24. Ji, Y.-B.; Xu, Q.-S.; Hu, Y.-Z.; Heyden, Y. V.; J. Chromatogr A 2005, 1066, 97. [Crossref]
Associate Editor handled this article: Eduardo M. Richter |

On-line version ISSN 1678-7064 Printed version ISSN 0100-4042
Qu�mica Nova
Publica��es da Sociedade Brasileira de Qu�mica
Caixa Postal: 26037
05513-970 S�o Paulo - SP
Tel/Fax: +55.11.3032.2299/+55.11.3814.3602
Free access