Artigo
| Removal of Pb(II) ions and malachite green dye from wastewater by activated carbon produced from lemon peel |
|
Sayed Zia MohammadiI; Mohammad Ali KarimiI; Sayedeh Nasibeh YazdyI; Tayebeh ShamspurII,*; Hooshang HamidianI
IDepartment of Chemistry, Payame Noor University, Iran Recebido em 04/09/2013 *e-mail: shamspur@gmail.com In the present study, a high-surface area activated carbon was prepared by chemical activation of lemon peel with H3PO4 as the active agent. Then, the adsorption behavior of Malachite green dye and Pb(II) ions on the produced activated carbon was studied. Batch process was employed for sorption kinetics and equilibrium studies. Experimental data were fitted to various isotherm models. According to the Langmuir model, the maximum adsorption capacities of Malachite green dye and Pb(II) ions were found to be 66.67 and 90.91 mg g-1, respectively, at room temperature. Kinetic studies showed the adsorption process followed a pseudo second-order rate model. The sorption kinetics were controlled by intra-particle diffusion. The results indicated that the produced activated carbon can be economically and effectively used as an adsorbent for the removal of Malachite green dye and Pb(II) ions from wastewaters. INTRODUCTION Dyes and heavy metals are two contaminants commonly found in the wastewater from several industries. Specifically, heavy metals are discharged by industries such as agrochemical, petrochemical, and fertilizer,1 whereas dyes are principally found in effluents from dye manufacturing industries, electroplating factories, distilleries, and food companies.2 Further, these two types of contaminants are present in wastewaters from paper and pulp factories. Lead is a heavy metal associated with various toxic effects on the kidney, nervous, hematopoietic, and gastrointestinal systems of humans.3 Malachite green (MG), a basic (cationic) dye, is the most widely used dye for coloring purposes.4 This triarylmethane dye is widely used worldwide in the aquaculture industry as a biocide as well as in the silk, wool, cotton, leather, paper, and acrylic industries. Furthermore, it is also employed as a therapeutic agent to treat parasites, fungal, and bacterial infections in fish and fish eggs and as an antiseptic for external application on wounds and ulcers. Despite its extensive use, MG is a highly controversial compound because of its reported toxic properties, which are known to cause carcinogenesis, mutagenesis, teratogenesis, and respiratory toxicity.5 Its oral consumption is also hazardous and carcinogenic.5 However, despite the large amount of data on its toxic effects, MG is still used in aquaculture and other industries.6 Therefore, the removal of MG dye and Pb(II) ions from wastewater before discharging is necessary and very important. The removal of color and heavy metal ions from wastewaters is one of the major problems due to the difficulty in treating such effluents by conventional treatment methods. The sorption technique has proven to be an effective process for the removal of color and heavy metal ions from wastewaters. The significant advantages of the sorption technique are its high efficiency in removing very low levels of heavy metals from dilute solutions, easy handling, high selectivity, lower operating cost, minimization of chemical or biological sludge, and regeneration of adsorbent.7 Currently, different types of adsorbents used for the removal of Pb(II) ions and MG dye from water include zeolites,8 metallic oxides such as manganese oxides,9 ion exchange resins,10 limestone,11 chitosan,12 bagasse fly ash and activated carbon,13 lignite,14 modified carbon nanotubes,15 biosorbent,6,16-18 and produced activated carbon.1,13,19-29 In this study, lemon peel was used to prepare activated carbon as a new sorbent for the removal of Pb(II) ions and MG dye from wastewater. To the best of our knowledge, this material was never used before for this application. The effects of initial adsorbate concentration, pH, contact time, and capacity of sorbent on the removal of Pb(II) ions and MG dye have been studied.
EXPERIMENTAL Instrumentation A Varian scanning spectrophotometer (model CARY 50 Conc) with quartz cells was employed for absorbance measurements. The absorbance value of the MG was measured at 616 nm (maximum absorbance).6 A Metrohm pH-meter (Model 713) with a combined glass electrode (Metrohm) was used for pH measurements. An IKA stirrer model KS was used for agitation of the solutions. A Centurion scientific centrifuge model 1020 D.E. (West Sussex, United Kingdom) was used to accelerate the phase separation. A SensAA GBC atomic absorption spectrometer (Dandenong, Australia) equipped with a deuterium background correction and air-acetylene burner was used for absorbance measurements according to the instrument instruction. A lead hollow cathode lamp was used as the light source at a wavelength of 283.3 nm. The other operating parameters of the element were set according to the manufacturer recommendation. Reagents and solution All solutions were prepared in deionized water. A 1000.0 µg mL-1 Pb(II) metal stock solution was prepared by dissolving Pb(NO3)2 (Merck, Darmstadt, Germany) in water and acidifying it with 5 mL of concentrated HNO3 to prevent hydrolysis. A stock solution of malachite green (MG) (1000.0 µg mL-1) was prepared by dissolving 0.2500 g of MG (Merck, Darmstadt, Germany) in 250.0 mL of deionized water. All working solutions were prepared by diluting the stock solutions with deionized water. Preparation of the activated carbon Lemon peels were washed with distilled water and dried in an oven for 2 h at 105 ºC. It was then ground and sieved to particle sizes ranging from 0.3 to 0.5 mm. Then, the precursor was soaked for 24 h in a solution of phosphoric acid at a ratio of 2:1 (v/v). The activated precursor was dried in an oven at 250 ºC, carbonized in a muffle furnace for 1 h at 500 ºC under a current of nitrogen (150 cm3 min-1), and cooled to room temperature. The treated samples were repeatedly washed with boiling water until a neutral pH was obtained and then dried at 105 ºC for 24 h and stored in bottles until use. Adsorption studies Adsorption tests for the removal of lead ions were conducted by mixing 0.1 g activated carbon with 20 mL of a solution of known concentration (50-500 mg L-l at pH 7) in 250 mL Erlenmeyer flasks at room temperature. Adsorption tests for the removal of MG dye were conducted by mixing 0.2 g activated carbon with 30 mL of a solution of known concentration (50-500 mg L-1 at pH 7) in 250 mL Erlenmeyer flasks at room temperature. The pH of each solution was adjusted with HNO3 and NaOH. Flasks were agitated on an IKA stirrer model KS at 240 rpm for identified time intervals, then centrifuged, and analyzed for lead ion and MG concentration using a flame atomic absorption spectrometer and UV spectrophotometer. The amount of analyte adsorbed at any time was calculated by the difference in their initial and final concentrations. Each experiment was repeated in duplicate, and the averaged values are given as the results. The obtained data were employed to calculate the equilibrium analyte uptake capacity according to equation (1).

where qe (mg g-l) is the equilibrium amount of analyte in the adsorbed phase, C0 and Ce are the initial and equilibrium concentrations of analyte (mg L-l) in the aqueous solution, v is the volume of the solution (L), and m is the sorbent dose (g) in the mixture. The removal percent of the analytes (Re%) in solution was calculated using equation (2).

RESULTS AND DISCUSSION Characterization of the prepared activated carbon The yield of activated carbon, which is an indication of activation process efficiency, is the amount of activated carbon produced at the end of the activation step. The total ash content of the resultant activated carbon was determined by the ASTMD2866-94 method, and the surface area was measured by BET (Brunauer-Emmett-Teller) method. The iodine number, defined as milligrams of iodine per gram of carbon, was determined by the ASTM D4607-94 method. The pH point of zero charge (pHpzc), which indicates the acid or basic character of the carbon surface,30 was determined. According to the procedure described by Noh and Schwarz,31 known amounts of carbon were sequentially added to a given volume of aqueous 0.1 eq L-1 NaCl until the pH of the solute did not change with further addition of carbon. This value (pHpzc) corresponds to the H+ ion concentration after all acid groups present on the surface reach their dissociative-associative equilibrium. Characteristics of the activated carbon are presented in Table 1.
Scanning electron micrographs (SEM) were obtained by using a scanning electron microscope (Cam Scan MV2300). Scanning electron micrographs were recorded for the sample coating with 1000× magnification (Figure 1), and they showed that the adsorbent had an irregular and porous surface, indicating relatively high surface areas. This observation is supported by the BET surface area of the activated carbon. The porous and roughened surface had large surface areas for dye molecule binding, which may prove suitable for pollutant removal.
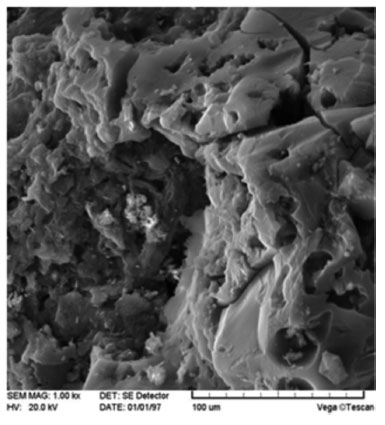 Figure 1. SEM image of produced activated carbon (magnification: 1000x)
An FTIR spectrometer (Brucker Tensor 27) was employed to determine the presence of functional groups in the activated carbon. The pellet (pressed-disk) technique was used for this purpose. The pellets were prepared using 1 mg of the sample and 100 mg of KBr. The FTIR spectra displayed the presence of some absorption peaks attributed to different functional groups including carbonyl, carboxylic acid, and hydroxy groups. Effect of pH The pH of the aqueous solution is an important factor and influences the removal of heavy metal ions and dyes as well as the surface properties of the adsorbent. Therefore, it can affect the extent of adsorption.32 For this purpose, the effect of pH on the removal of MG dye and lead ions were studied. The results are shown in Figure 2. The removal of MG dye and Pb(II) ions increased slowly as the pH increased from 2 to 8. The pHs higher than 8 were not studied for the removal of Pb(II) ions because lead could precipitate as lead hydroxide at those pH values. Based on these results, a pH of 7 was selected for further studies.
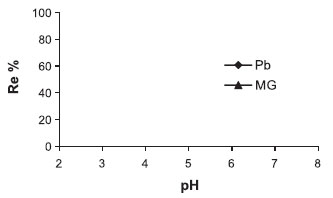 Figure 2. The effect of pH on the adsorption of Pb(II) ions and MG dye on produced activated carbon. Conditions: 20 mL Pb(II) 50.0 mg L-1 and 30 mL MG dye 80.0 mg L-1, agitation time: 25 min, agitation speed: 240 rpm, sorbent: 0.1 g for Pb(II) ions and 0.2 g for MG dye, pH - 7
The pHzpc plays an important role in the adsorption process.32 Above the pHzpc, the surface of activated carbon is negative, and there is a strong electrostatic attraction between surface groups and Pb(II) species. As a result, at pHs higher than pHzpc (3.2), the adsorption of Pb(II) ion and MG (basic or cationic dye) is high. Effect of initial concentration The effect of the initial concentration of Pb(II) ions and MG dye on adsorption was investigated for concentrations ranging from 50 to 500 mg L-1. The results are shown in Table 2. It can be seen that as the initial concentration increased the removal percent decreased. However, the actual amount of Pb(II) ions and MG dye adsorbed per unit mass of activated carbon increased with an increase in the initial concentration. At lower concentrations, high surface areas of adsorbent vacant sites are available, leading to an increase in the concentration gradient and rate of analyte diffusion to adsorbents. At high concentrations of analytes, the available sites of adsorbents decrease, and the analyte removal percentage is dependent on the initial concentration of Pb(II) ions and MG dye.
Effect of contact time The time-dependent behavior of Pb(II) ions and MG dye adsorption on activated carbon at a fixed stirring rate was evaluated for different equilibrium time intervals from 3 to 35 min at room temperature. The results are presented in Figure 3. It can be seen that the adsorption of Pb(II) ions and MG dye increases sharply, and ~95% of the total Pb(II) ions and MG dye was removed within 5 and 25 min, respectively. The fast adsorption rate is attributed to the large external surface of the activated carbon. Further increase in contact time does not enhance the adsorption percentage. Based on these results, a contact time of 25 min was selected in further studies for the removal of lead ions and MG dye. The short time needed to reach equilibrium suggests that activated carbon has a very high adsorption efficiency and high value for industrial applications.
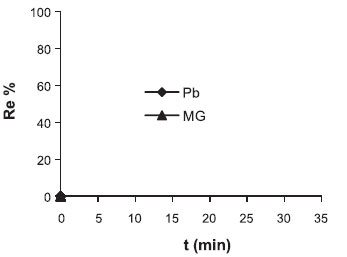 Figure 3. The effect of contact time on adsorption of Pb(II) ions and MG dye on produced activated carbon. Conditions were the same as Figure 3, except for agitation time
Adsorption kinetic study The adsorption of a solute by a solid in an aqueous solution is a phenomenon that often has complex kinetics. The adsorption rate is strongly influenced by several parameters related to the state of the solid, which generally has a very heterogeneous reactive surface, and the physico-chemical conditions under which the adsorption is performed.33 To investigate the adsorption processes of MG dye and Pb(II) ions on the adsorbent, pseudo-first-order and pseudo-second-order kinetic models were studied. Pseudo-first-order model The pseudo-first-order model was described by Lagergren.34

where qe and qt refer to the amount of analyte (mg g-1) at equilibrium and any time, respectively, and K1 is the equilibrium rate constant for pseudo-first-order adsorption (min-1). Integration of equation (3) for the boundary conditions t = 0 to t and q = 0 to q gives

The values of log (qe-qt) were linearly correlated with t. The plot of log (qe-qt) vs. t should give a linear relationship, and the value of K1 was determined from the slope of the plot (Table 3).
Pseudo-second-order model The pseudo-second-order model is represented by the following differential equation.35

where K2 is the equilibrium rate constant of pseudo-second-order adsorption (g mg-1 min-1). Integrating equation (5) for the boundary condition t = 0 to t and q = 0 to q gives

The slope and intercept of a plot of t/q vs. t were used to calculate the second-order rate constant, K2 (Table 3). The correlation coefficients of all the examined data were found to be very high (R2 > 0.999). This shows that the model can be applied for the entire adsorption process and confirms that the sorption of analytes on activated carbon prepared from lemon peels follows the pseudo-second-order kinetic model. Intra-particle diffusion model The adsorbate species are most probably transported from the bulk of the solution into the solid phase via an intra-particle diffusion process, which is often the rate-limiting step in many adsorption processes. The possibility of intra-particle diffusion is explored using the intra-particle diffusion model.36

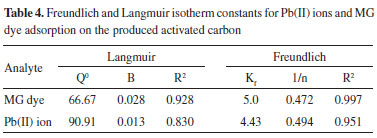
where C is the intercept and kid is the intra-particle diffusion rate constant. The values of kid, C, and the corresponding linear regression correlation coefficient, R2, are given in Table 3. The intra-particle rate constants calculated for MG dye and Pb(II) ions are 0.427 and 0.116 mg g-1 min-1/2, respectively. These high values show that activated carbon has a high tendency for the removal of MG dye and Pb(II) ions.37,38 Adsorption equilibrium study Equilibrium data, commonly known as adsorption isotherms, are basic requirements for the design of adsorption systems. To discover the adsorption capacity of the prepared activated carbons, Langmuir and Freundlich isotherms were applied, and the constants of the isotherm equations were calculated. Langmuir isotherm The Langmuir equation, which is valid for monolayer adsorption on a completely homogenous surface with a finite number of identical sites and negligible interaction between adsorbed molecules, is represented in the linear form as follows:39

where Q0 is the theoretical maximum adsorption capacity (mg g-1) and b is the constant related to the free energy of adsorption (I µ exp(-ΔG/RT)). Figures 4 and 5 show the Langmuir plots for the adsorption of Pb (II) ions and MG dye at room temperature. The values of Q0, b, and the correlation coefficients for Langmuir isotherms are presented in Table 4.
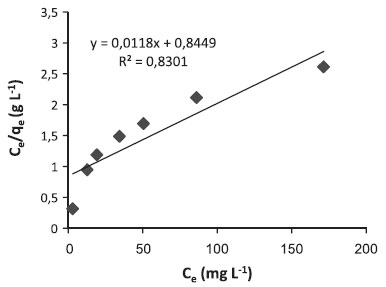 Figure 4. Langmuir adsorption isotherm of Pb(II) ions on produced activated carbon at room temperature
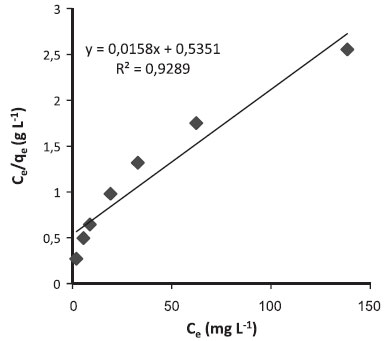 Figure 5. Langmuir adsorption isotherm of MG dye on produced activated carbon at room temperature
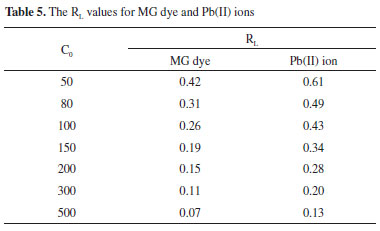
The essential characteristics of the Langmuir isotherm can also be expressed in terms of a dimensionless constant of separation factor or equilibrium parameter, RL,40 which is defined as

where b is the Langmuir constant and C0 is the initial concentration of Pb(II) ion. The RL value indicates the shape of the isotherm. RL values between 0 and 1 indicate favorable adsorption, while RL > 1 or RL = 0 indicate unfavorable and irreversible adsorption isotherms. RL values are given in Table 5. RL at different concentrations between 0 and 1 indicates a highly favorable adsorption.
Freundlich isotherm The Freundlich isotherm is derived by assuming a heterogeneous surface with a nonuniform distribution of heat of sorption over the surface. It can be expressed in the linear form as follows:41

where Kf (L mg-1) and n are isotherm constants that indicate the capacity and intensity of the adsorption, respectively. The linear plot of log qe vs. log Ce indicates that adsorption of Pb(II) ions and MG dye also follows the Freundlich isotherm. Table 4 shows the Freundlich adsorption isotherm constant and correlation coefficients. The value of 1/n for the Freundlich isotherm was found to lie between 0 and 1, indicating that MG dye and Pb(II) ions are favorably adsorbed by the activated carbon prepared at room temperature.33
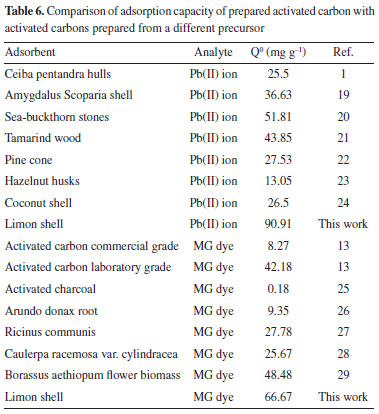
CONCLUSION The present study shows that the lemon peel can be effectively used as an adsorbent for the removal of MG dye and Pb(II) ions from wastewater. The equilibrium data were found to be well represented by the Freundlich and Langmuir isotherms, and the maximum adsorption capacity of Pb(II) ions and MG dye on the produced activated carbon were 90.91 and 66.67 mg g-1, respectively. Figure 3 showed that quantitative removal of MG dye and Pb(II) ions was obtained within a very short time. This result is very interesting because equilibrium time is a very important parameter for wastewater treatment applications. Adsorption rate constants and capacities were very fast and high, respectively, compared to other methods for the removal of pollutants from aqueous solution. Low cost, rapid adsorptive ability, agricultural waste, and regeneration facility of these adsorbents offer a promising technique for industrial wastewater clean up. The adsorption capacities were compared to other adsorbents1,13,19-29 and are presented in Table 6.
REFERENCES 1. Madhava-Rao, M.; Chandra-Rao, G. P.; Seshaiah, K.; Wang, M. C.; Waste Manage. 2008, 28, 849. 2. Nevine-Kamal, A.; Desalination 2008, 223, 152. 3. Hsu, P. C.; Guo, Y. L.; Toxicology 2002, 180, 33. 4. Crini, G.; Peindy, H. N.; Gimbert, F.; Robert, C.; Sep. Purif. Technol. 2007, 53, 97. 5. Berberidou, C.; Poulios, I.; Xekoukoulotakis N. P.; Mantzavinos, D.; Appl. Catal., B 2007, 74, 63. 6. Hamdaoui, O. ; Chiha, M.; Naffrechoux, E.; Ultrason. Sonochem. 2008, 15, 799. 7. Ozdes, D.; Duran, C.; Senturk, H. B.; J. Environ. Manage. 2011, 92, 3082. 8. Salem, A.; Sene, R.; Chem. Eng. J. 2011, 174, 619. 9. Su, Q.; Pan B.; Pan, B.; Zhang, Q.; Zhang, W.; Lv, L.; Wang, X.; Wu, J.; Zhang, Q.; Sci. Total Environ. 2009, 407, 5471. 10. Tsunekawa, M.; Ito, M.; Yuta, S.; Tomoo, S.; Hiroyoshi, N.; J. Hazard. Mater. 2011, 191, 388. 11. Aziz, H. A. ; Adlan, M. N.; Ariffn, K. S.; Bioresource Technol. 2008, 99, 1578. 12. Zhu, H. Y.; Jiang, R.; Fu, Y. Q.; Jiang, J. H.; Xiao, L.; Zeng, G. M.; App. Surf. Sci. 2011, 258, 1337. 13. Mall, I. D.; Srivastava, V. C.; Agarwal, N. K.; Mishra, I. M.; Colloids Surf., A 2005, 264, 17. 14. Uçurum, M.; Fuel 2009, 88, 1460. 15. Salam, M. A.; Colloid Surf., A 2013, 419, 69. 16. Shao, W.; Chen, L. Lü, L.; Luo, F.; Desalination 2011, 265, 177. 17. Vasanth Kumar, K.; Dyes Pigm. 2007, 74, 595. 18. Bhatnagar, A.; Minocha, A. K.; Sillanpaa, M.; Biochem. Eng. J. 2010, 48, 181. 19. Mohammadi, S. Z.; Karimi, M. A.; Afzali, D.; Mansouri, F.; Cent. Eur. J. Chem. 2010, 8, 1273. 20. Mohammadi, S. Z.; Karimi, M. A.; Afzali, D.; Mansouri, F.; Desalination 2010, 262, 86. 21. Acharya, J.; Sahu, J. N.; Mohanty, C. R.; Meikap, B.C.; Chem. Eng. J. 2009, 149, 249. 22. Momcilovic, M.; Purenovic, M.; Bojic, A.; Zarubica A.; Randelovic, M.; Desalination 2011, 276, 53. 23. Imamoglu, M.; Tekir, O.; Desalination 2008, 228, 108. 24. Sekar, M.; Sakthi, V.; Rengaraj, S.; J. Colloid Interf. Sci. 2004, 279, 307. 25. Iqbal, M. J.; Ashiq, M.N.; J. Hazard. Mater. 2007, 139, 57. 26. Zhang, J.; Li, Y.; Zhang, C.; Jing, Y.; J. Hazard. Mater. 2008, 150, 774. 27. Santhi, T.; Manonmani, S.; Smith, T.; J. Hazard. Mater. 2010, 179, 178. 28. Bekci, Z.; Seki, Y.; Cavas, L.; J. Hazard. Mater. 2009, 161, 1454. 29. Nethaji, S.; Sivasamy, A.; Thennarasu, G.; Saravanan, S.; J. Hazard. Mater. 2010, 181, 271. 30. Radovic, L. R.; Chemistry and physics of carbon. Taylor & Francis: New York, 2008. 31. Noh, J. S.; Schwarz, J. A.; Colloid Interf. Sci. 1989, 130, 157. 32. Sreejalekshmi, K. G.; Krishnan, K. A.; Anirudhan, T. S.; J. Hazard. Mater. 2009, 161, 1506. 33. Amin, N. K.; J. Hazard. Mater. 2009, 165, 52. 34. Lagergren, S.; Handlingar 1898, 24, 1. 35. Mckay, G.; Ho, Y. S.; Process Biochem. 1999, 34, 451. 36. Jnr, M. H.; Spiff, A. I.; Electron. J. Biotechnol. 2005, 8, 162. 37. Ghaedi, M.; Tavallali, H.; Sharifi, M.; Nasiri Kokhdan, S.; Asghari, A.; Spectrochim. Acta, Part A 2012, 86, 107. 38. Gupta, V. K.; Ali, I.; Sep. Purif. Technol. 2000, 18, 131. 39. Langmuir, I.; J. Am. Chem. Soc. 1916, 38, 2221. 40. Madhava Rao, M.; Ramana, D. K.; Seshaiah, K.; Wang, M. C.; Chang Chien, S. W. ; J. Hazard. Mater. 2009, 166, 1006. 41. Freundlich, H. M. F.; Z. Phys. Chem. 1906, 57, 385. |
On-line version ISSN 1678-7064 Printed version ISSN 0100-4042
Qu�mica Nova
Publica��es da Sociedade Brasileira de Qu�mica
Caixa Postal: 26037
05513-970 S�o Paulo - SP
Tel/Fax: +55.11.3032.2299/+55.11.3814.3602
Free access


