Artigo
| Spectrophotometric determination of Sudan Blue II in environmental samples after dispersive liquid-liquid microextraction |
|
Yunus Emre UnsalI; Mustafa TuzenI; Mustafa SoylakII,*
IGaziosmanpasa University, Faculty of Science and Arts, Chemistry Department, 60250 Tokat, Turkey Recebido em 25/10/2013 *e-mail: soylak@erciyes.edu.tr A dispersive liquid-liquid microextraction procedure coupled to spectrophotometry is described for the determination of the trace levels of Sudan Blue II. Analytical parameters, such as pH, volume of extraction solvent (carbon tetrachloride), volume of dispersant (ethanol), volume of sample, and extraction time, were optimized. Matrix effects were also investigated. Preconcentration factor was found to be 200. Detection limit and relative standard deviation (RSD) were 0.55 µg L-1 and 3.9%, respectively. The procedure was successfully used for the determination of trace levels of Sudan Blue II in food, ink, antifreeze, and industrial waste-water samples. INTRODUCTION Synthetic dyes have been widely used as coloring reagents in the various industries, such as food, textile, and petroleum. One such class of dyes, Sudan dyes, that contain azo functional groups and aromatic rings, can have adverse effects on human health and environment.1-4 Sudan Blue II is used as a dye for staining alcohols, ester, hydrocarbon derivatives, oils, fats, and waxes.5 Carcinogenic effect of Sudan dyes has been recognized by researchers. Sudan Blue II is harmful to human and animals; it causes irritation to the skin, eyes, and respiratory tract.6 The potential toxicity and pathogenicity of Sudan Blue II creates a need for the development of methods for their detection/determination in environmental samples.5,6 Several methods have been reported for the separation and preconcentration of organic and inorganic species at trace levels.7-11 Dispersive liquid-liquid microextraction (DLLME) is a technique that uses a mixture of three solvents and has similarities with other technique, like liquid-liquid extraction (LLE) and cloud point extraction (CPE).12,13 The principal advantages of the DLLME method are the low cost of solvents, the use of simple equipment, high recoveries and enrichment factors, and rapid execution.14-17 DLLME has been successfully used for the preconcentration of organic species, such as dyes in environmental samples.18-20 In this study, we have coupled DLLME with spectrophotometry and have developed a new technique for the separation, preconcentration, and determination of trace amounts of Sudan Blue II in real samples.
EXPERIMENTAL Instruments A Hitachi 150-20 spectrophotometer with quartz micro-cell (path-length = 10 mm; and volume = 700 µL) was used for absorbance measurements. A pH meter, Sartorius PT-10 Model, and glass-electrode was employed for measuring pH values in the aqueous phase. Water used in the experiments was collected from a water purification system (Model RO 180, HUMAN Corp., Seoul, Korea) and had a conductivity of 1 µS cm-1. ALC PK 120 model centrifuge (Buckinghamshire, England) was used in all experiments. Standard solutions and reagents All chemicals used were analytical reagent grade and were obtained from Merck (Darmstadt, Germany) and/or Sigma-Aldrich (Milwaukee, WI, USA). Sudan Blue II (Figure 1) was purchased from Sigma-Aldrich Co. (WI, USA). A stock solution of Sudan Blue II (25 µg mL-1) was prepared in ethanol and stored at 4 ºC in the dark. A calibration curve was established using several dilutions of the standard stock solution of Sudan Blue II. The pH values were adjusted with the addition of 0.1 mol L-1 phosphate buffer (H2PO4-/H3PO4), 0.1 mol L-1 acetate buffer (CH3COO-/CH3COOH), or 0.1 mol L-1 ammonium buffer (NH4+/NH3).
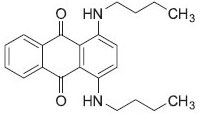 Figure 1. Structure of Sudan blue II
Analytical procedure A solution of the sample (25 mL) containing Sudan Blue II (12.5 µg) was placed in a 50 mL conical tube. The pH of the sample solution was adjusted to pH 4.0 with acetate buffer. Carbon tetrachloride (125 µL) and ethanol (1250 µL) were added, resulting in the formation of a cloudy solution. The magnetic stirrer was turned on and the mixture was centrifuged at 2500 rpm for 5 min. Then, the sediment phase (~50 µL) was diluted with ethanol. The volume of sample in cuvette was 250 µL. The concentration of Sudan Blue II in the final solution was determined by measuring the absorbance at 642 nm. Applications Candy and desert samples (1.0 g each) purchased from a local market were added to hot water (30 mL, 75 ºC). The samples were filtered and transferred to a beaker. The pH of each sample was adjusted to 4.0 with acetate buffer. The preconcentration procedure described for the analysis of Sudan Blue II was then used to isolated the organic components. A similar protocol was used for determining the organic content in blank samples, i.e., samples that do not contain any organic material. Concentrations of the analyte in the samples were determined by measuring the absorbance at 642 nm. The proposed method was also used to analyze waste-water samples collected from various industries. Waste-water samples collected in polyethylene bottles were filtered through a cellulose membrane filter (Millipore) of 0.45 µm pore size and stored at <4 ºC till use for analysis. The pH values of the samples were adjusted to 4.0 with acetate buffer. Then, the separation/preconcentration was carried out as described for Sudan Blue II and candy samples above. Blank samples were also analyzed. The concentration of Sudan Blue II in the waste-water samples after separation/preconcentration was determined by measuring the absorbance at 642 nm on a UV-visible spectrophotometer.
RESULTS AND DISCUSSION Effect of pH The pH of the aqueous solution is an important factor regulating the partitioning of Sudan Blue II from aqueous phase to the extraction phase.19-23 Extraction of Sudan Blue was studied in the pH range from 2 to 8. The results are shown in Figure 2. The recovery of Sudan Blue II was found to be quantitative in the pH range from 2 to 6. Accordingly, a pH of 4 was selected for all subsequent work and analysis of real samples.
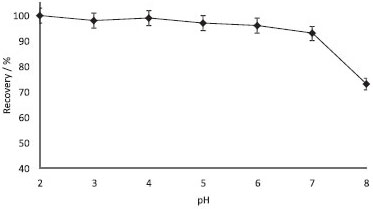 Figure 2. Influences of pH on the recoveries of Sudan Blue II (N= 3, 0.5 µg mL-1 of Sudan blue II, centrifugation speed: 2500 rpm, time: 5 min)
Nature and volume of the dispersant The nature of the disperser solvent was also evaluated in the current method. Ethanol showed higher recovery of Sudan Blue II, when compared with that from methanol, acetone, and acetonitrile. Furthermore, ethanol was less toxic and dissolved Sudan Blue II efficiently. The effect of the volume of ethanol on the extraction efficiency was also investigated. To obtain the optimized volume of ethanol, various experiments were performed to extract 0.5 µg mL-1 of Sudan Blue II using different volumes of ethanol (100-3000 µL). Quantitative recoveries were observed when the volume of ethanol was 1000-3000 µL (Figure 3). Accordingly, 1250 µL of ethanol was used for all subsequent experiments and analysis of real samples.
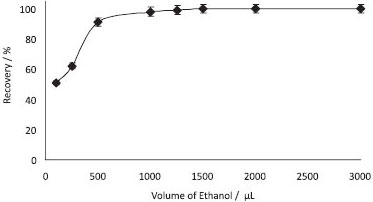 Figure 3. Effect of ethanol volume on the recoveries of Sudan blue II (N=3, 0.5 µg mL-1 of Sudan blue II, pH: 4, centrifugation speed: 2500 rpm, time: 5 min)
Nature and volume of extraction solvent Carbon tetrachloride (CCl4) was selected as the extraction solvent. In order to examine the effect of the volume of extraction solvent, DLLMEs of Sudan Blue II were carried out with different volumes of CCl4 (0-400 µL). The recovery values of Sudan Blue II were obtained quantitatively with extraction solvent volume of 100-400 µL. The results are shown in Figure 4. By increasing the volume of CCl4 from 100 µL to 400 µL, the enrichment factor decreased from 200 to 125, because the volume of the sediment phase increased from 110 µL to 400 µL. Thereby, 125 µL of CCl4 was used as the extraction solvent in all subsequent experiments.
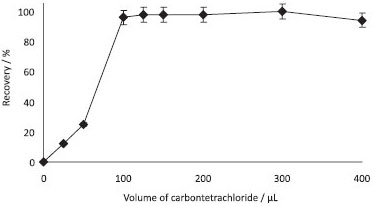 Figure 4. Effect of carbon tetrachloride volume on the recoveries of Sudan blue II (N=3, 0.5 µg mL-1 of Sudan blue II, pH: 4, volume of ethanol: 1.0 mL, centrifugation speed: 2500 rpm, time: 5 min)
Effect of the amount of NaCl In order to investigate the effect of the ionic strength on the extraction, DLLME experiments were conducted in the presence of different amounts of NaCl (0.5-5.0%; w/v). As can be seen in Figure 5, maximum extraction efficiency was obtained in the presence of 0.5-2.0% (w/v) of NaCl. At higher concentrations of NaCl, e.g. 2.0% (w/v), the formation of cloudy solution was observed. Therefore, 0.5% (w/v) of NaCl was used in all subsequent studies.
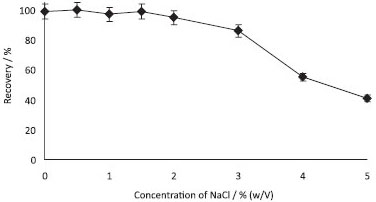 Figure 5. Effect of NaCl concentrations on the recoveries of Sudan Blue II (N= 3, 0.5 µg mL-1 of Sudan blue II, pH: 4, volume of ethanol: 1.0 mL, volume of carbon tetrachloride: 125 µL, centrifugation speed: 2500 rpm, time: 5 min)
Effects of centrifugation speed and time The effect of centrifugation speed (500-4000 rpm) on the recoveries of Sudan Blue II in the DLLME procedure was examined. Quantitative recoveries (95%) were obtained at 2000-4000 rpm. The effects of centrifugation time (1-6 min) on the recoveries were also investigated. The recoveries of Sudan Blue II were higher than 95% in the range from 4 min to 6 min. Therefore, a centrifugation speed of 2500 rpm and a duration of 5 min was used in all subsequent studies. Effect of foreign ions The effects of the matrix components of the real samples are a critical parameter in microextraction studies, therefore, the influence of various cations, anions, and dyes on the recoveries of Sudan Blue II were investigated. The standard solution of Sudan Blue II (0.5 µg mL-1) was used as a reference. The results are given in Table 1. Tolerance limits were defined by the concentration of dyes, cations, and anions which caused an <5% error in the preconcentration and determination of Sudan Blue II. 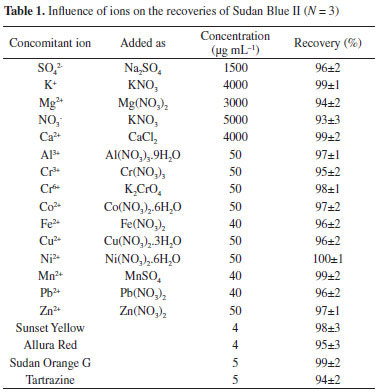
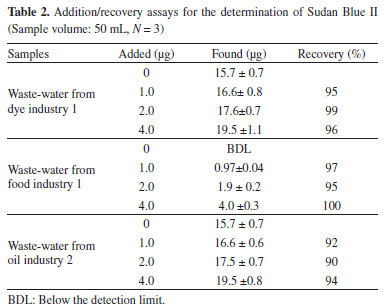
Sample volume Sample volume has a critical impact on the preconcentration factor. The sample volume is closely associated to extraction volume due to partition equilibrium. The effect of sample volume (10-50 mL) on the recoveries of Sudan Blue II was examined. The recoveries of Sudan Blue II using DLLME were quantitative (95%) for sample volumes upto 50 mL. A preconcentration factor of 200 can be achieved when using a sample volume of 50 mL and obtaining a final volume of 250 µL. Analytical figures of merit Analytical data were obtained using the optimized DLLME protocol. The calibration graph was linear in range from 1.0 µg mL-1 to 5.0 µg mL-1, with a coefficient of determination (R2) of 0.9995. The regression equation was A = 0.0493C + 0.0044. The limit of detection (LOD), calculated as the concentration of absolute amount of analyte yielding a signal equivalent to three times the standard deviation of the signal due to the blank (n = 10), was 0.55 µg L-1. The relative standard deviation (RSD), i.e., precision, for ten-replicate measurements of 0.5 µg mL-1 of Sudan Blue II was 3.9%. The recovery of Sudan Blue II was 99±1% at 95% confidence level. Applications The optimized preconcentration/separation method was used to determine the concentration of Sudan Blue II in waste-water samples by the method of standard addition. The results are given in Table 2. The recoveries of Sudan Blue II for spiked samples were in the range from 95% to 100%.
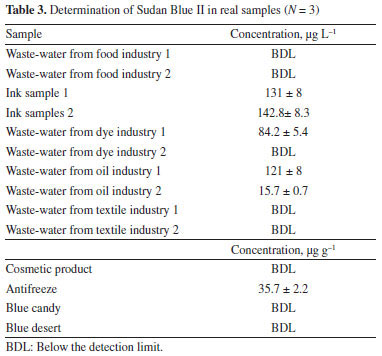
The method was also used to determine the Sudan Blue II content in candy, desert, cosmetic product, ink, antifreeze, and different industrial waste-water samples (Table 3). The levels of Sudan Blue in these samples were generally below the LOD of the method.
CONCLUSIONS The optimization of a dispersive liquid-liquid microextraction protocol for the extraction of trace amounts of Sudan Blue II from samples, prior to its spectrophotometric detection, is described. This method involves the minimum use of toxic organic solvents, is inexpensive, has enhanced sensitivity, is simple to execute, is rapid, and is environmentally friendly. In addition, the optimized procedure can reasonably tolerate the presence of diverse ions. Our results are comparable with those determined previously with respect to both preconcentration factor and detection limit.4,24-27
REFERENCES 1. http://en.wikipedia.org/wiki/Oil_Blue_35, accessed April 2014. 2. Chuande, Z.; Ting Z.; Xiaoyan, L.; Haixia, Z.; J. Chromatogr. A 2010, 1217, 6995. 3. Amjad H. E.; Yahya S. A.; Dyes Pigm. 2013, 97, 330. 4. Alothman, Z. A.; Unsal, Y. E.; Habila, M.; Shabaka, A.; Tuzen, M.; Soylak, M.; Food Chem. Toxicol. 2012, 50, 2709. 5. Soylak, M.; Unsal, Y. E.; Tuzen, M.; Food Chem. Toxicol. 2011, 49, 1183. 6. Ping, Q.; Tao, Z.; Zejun W.; Xiaoyan, L.; Xuewu, Z.; Food Chem. 2011, 125, 1462. 7. Dinc, E.; Baydan, E.; Kanbur, M.; Onur, F.; Talanta 2002, 58, 579. 8. Soylak, M.; Unsal, Y. E.; Yilmaz, E.; Tuzen, M.; Food Chem. Toxicol. 2011, 49, 1796. 9. Anthemidis, A. N.; Themelis, D. G.; Stratis, J. A.; Talanta 2001, 54, 37. 10. Pan, L.; Qin, Y. C.; Hu, B.; Jiang, Z. C.; Chem. Res. Chin. Univ. 2007, 23, 399. 11. Mobarakeh, S. Z. M.; Taher, M. A.; Mostafavi, C.; Can. J. Anal. Sci. Spectrosc. 2005, 25, 7. 12. Afzali, D.; Taher, M. A.; Mostafavi, M.; Mobarakeh, S. Z. M.; Talanta 2005, 65, 476. 13. Sayed, Z. M.; Daryoush, A.; Mohammad, A. T.; Mohammad, Y.; Talanta 2009, 80, 875. 14. Pei. L.; Hongbo, S.; Anal. Biochem. 2008, 380, 21. 15. Rezaee, M.; Assadi, Y.; Hosseini, M. R. M.; Aghaee, E.; Ahmadi, F.; Berijani, S.; J. Chromatogr. A 2006, 1116, 1. 16. Farajzadeh, M. A.; Bahram, M.; Jonsson, J. A.; Anal. Chim. Acta 2007, 591, 69. 17. Nagaraju, D.; Huang, S. D.; J. Chromatogr. A 2007, 1161, 89. 18. Pena-Pereira, F.; Cabaleiro, N.; de la Calle, I.; Costas, M.; Gil, S.; Lavilla, I.; Bendicho, C.; Talanta 2011, 85, 1100. 19. Xiao-Huan, Z.; Qiu-Hua, W.; Mei-Yue, Z.; Guo-Hong, X.; Zhi, W.; Chin. J. Anal. Chem. 2009, 37, 161. 20. Hongyuan, Y.; Hui, W.; Jindong, Q.; Gengliang, Y.; J. Chromatogr. A 2011, 1218, 2182. 21. Soylak, M.; Sahin, U.; Elci, L.; Anal. Chim. Acta 1996, 322, 111. 22. Turkoglu, O.; Soylak, M.; J. Chin. Chem. Soc. (Taipei, Taiwan) 2005, 52, 575. 23. Divrikli, U.; Akdogan, A.; Soylak, M.; Elci, L.; Talanta 2009, 79, 1287. 24. Mejia, E.; Ding, Y. S.; Mora, M. F.; Garcia, C. D.; Food Chem. Toxicol. 2007, 102, 1027. 25. Biparva, P.; Ranjbari, E.; Hadjmohammadi, M. R.; Anal. Chim. Acta 2010, 674, 206. 26. Pourreza, N.; Rastegarzadeh, S.; Larki, A.; Food Chem. Toxicol. 2011, 126, 1465. 27. Farhadi, K.; Maleki, R.; Nezhad, N. M.; Samadi, N.; Spectrosc. Lett. 2010, 43, 101. |
On-line version ISSN 1678-7064 Printed version ISSN 0100-4042
Qu�mica Nova
Publica��es da Sociedade Brasileira de Qu�mica
Caixa Postal: 26037
05513-970 S�o Paulo - SP
Tel/Fax: +55.11.3032.2299/+55.11.3814.3602
Free access


