Artigo
| LC-MS/MS method applied to preclinical pharmacokinetic investigation of olanzapine-loaded lipid-core nanocapsules |
|
Frantiescoli A. DimerI,*; Maiara C. PigattoI; Adriana R. PohlmannI,II; Teresa Dalla CostaI; Silvia S. GuterresI
IFaculdade de Farmácia, Universidade Federal do Rio Grande do Sul, 90610-000 Porto Alegre - RS, Brasil Recebido em 09/04/2014 *e-mail: fdimer1@gmail.com In spite of different methods reported in the literature to determine olanzapine in biological fluids, all of them used high volumes of plasma. Therefore, the purpose of this paper was to develop an LC-MS/MS method using small plasma volume (0.1 mL) to apply in a preclinical pharmacokinetic investigation. The method was linear over the concentration ranges of 10-1000 ng mL-1. Extraction recoveries, stability, and validation parameters were evaluated. Results were within the acceptable limits of international guidelines. A significant decrease in clearance led to a significant 2.26-times increase in AUC0-6h of olanzapine-loaded lipid-core nanocapsules compared with free-olanzapine. INTRODUCTION The atypical antipsychotic agent olanzapine (OLA) has a thienobenzodiazepinyl structure (Figure 1). It has been used in the treatment of positive and negative symptoms of schizophrenia,1,2 bipolar disorders,3 in the control of breakthrough nausea in the patients receiving highly hematogenic chemotherapy, and in the treatment of mood and anxiety disorders.4 Despite the reduction in tardive dyskinesia and extra-pyramidal side-effects, when compared to first-generation antipsychotics, such as haloperidol,5 the side-effects of OLA include weight gain and cardiometabolic diseases.6,7
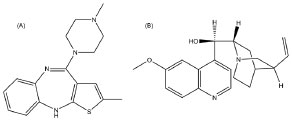 Figure 1. Chemical structures of olanzapine (A) and quinine (B), used as internal standard
Due to these side effects of the drug, it is necessary to develop new delivery systems that can afford the bioavailability of OLA to improve treatment for schizophrenia. A potential method for increasing bioavailability consists of loading drugs into nanocarriers.8 Using the interfacial deposition of preformed polymer, our research group has developed lipid-core nanocapsules (LNC).9 This system is based on the dispersion of sorbitan monostearate and capric/caprylic triglycerides as the core of the nanocapsules, and a biodegradable polymer and polysorbate 80 as the shell. Recent reports have shown that LNC could increase the targeting of drugs in tissues such as the brain10,11 with minimal side-effects.12 Based on these reports, studies on the pharmacokinetics, tissue distribution, and antipsychotic activity of olanzapine-loaded lipid-core nanocapsules (OLA-LNC) were performed in Wistar rats. Several methods have been reported in the literature to determine OLA in plasma, including high performance liquid chromatography (HPLC) with ultraviolet,13-16 electrochemical,17-19 diode array20 and, most commonly, mass spectrometry based detection.21-33 However, these methods require high plasma volumes (> 0.2 mL). A method that uses smaller volumes (< 0.1 mL) has been reported, but it is applied to brain microdialysates without the need for sample extraction.34 In pharmacokinetic studies with rodents, low volumes of blood are collected at a time in order to avoid deleterious reduction in volemia due to sequential sampling in the animal. In addition, it should be underlined that drastic changes in blood volume could affect the results of pharmacokinetic studies. Therefore, methods based on an extraction procedure using small plasma volumes (< 0.1 mL), as reported to other drugs,35,36 to quantify OLA in preclinical investigations are desired. The objective of the present study was to develop and validate a selective and sensitive method for the determination of OLA in rat plasma using liquid chromatography/tandem mass spectrometry (LC-MS/MS). Quinine was chosen as an internal standard (IS), and the extraction procedure was performed with 0.1 mL of plasma. The method was proved to be selective and was successfully applied to a pharmacokinetic comparative study of OLA dosed to rats as free drug solution as well as loaded into lipid-core nanocapsules.
EXPERIMENTAL Chemical reagents and animals OLA was offered by Teuto (Brazil). Poly(ε-caprolactone) (Mw 60.000 g mol-1), sorbitan monostearate (Span 60®) and the quinine were acquired from Sigma-Aldrich (Brazil). Caprylic/capric triglyceride and polysorbate 80 were purchased from Delaware (Brazil). Acetonitrile of HPLC grade was purchased from Tedia (Brazil). Ammonium acetate and acetic acid were purchased from Merck (Germany). Ultra-pure water was used for all the preparations (Millipore, USA). Other reagents were all of pharmaceutical or special analytical grade. The chemical structures of OLA and quinine are given in Figure 1. Male Wistar rats weighing 280 ± 20 g were obtained from the State Foundation for the Research and Production in Health (FEPPS, Porto Alegre, Brazil). The animals were kept in a ventilated cage system for 1 week before the beginning of experiments. The animals were housed under a 12 h light/dark cycle (lights on at 7:00 a.m.), temperature (22 ± 1 ºC), humidity (50%-60%), water, and standard food were offered ad libitum. Instrument and analytical conditions The chromatographic Shimadzu (Japan) HPLC system consisted of an SCL-10 AVP system controller, LC-10 ADVP pump, DGU-14A degasser, and the CTO-10 ADVP column oven. The separation of the compounds was done on a reversed-phase Shim Pack (Shimadzu, Japan) CLC-C8 column (150 mm × 4.6 mm) with a guard column (5 µm, 3.0 mm × 4.0 mm, Phenomenex). The optimized mobile phase was used in the isocratic mode, and consisted of acetonitrile-ammonium acetate (0.05 mol L-1)-acetic acid (70:30:0.1, v/v/v). Mobile phase was filtered through a 0.45 µm membrane (Millipore, USA) and pumped at a flow rate of 0.45 mL min-1. A 10 µL of injection volume was used. Animal samples and standards were detected in a triple-quadrupole mass spectrometer, Quattro LC (Micromass, UK), run in a positive mode (ESI+). Mass spectrometry conditions were optimized and OLA and IS were monitored with cone voltages of 32 eV (OLA) and 40 eV (IS), collision energy of 25 eV for both the drugs at source and desolvation temperatures of 120 ºC and 350 ºC, respectively. Nebulizer and desolvation gas flows were adjusted to 40 and 600 L h-1, respectively. The transitions 312.7 → 256.04 (OLA) and 325.0 → 307.0 (quinine, IS) were monitored. The resulting peak areas were integrated automatically using the Masslynx software (v. 3.6). The chromatographic run time of each sample was 7 min. Quality control sample preparation Individual stock solutions of OLA and IS were prepared by accurately weighing the required amounts into 10 mL volumetric flasks and dissolving in acetonitrile to a final concentration of 1 mg mL-1. In addition, the OLA stock solutions were diluted to 100 µg mL-1. The working standard solutions of OLA were serially diluted with acetonitrile-water (50:50, v/v) to the desired concentrations (10, 7.5, 5, 3.75, 2.5, 1, 0.5, 0.25, and 0.1 µg mL-1). The IS was diluted to 10 µg mL-1. Sample extraction procedure Calibration standards from 10 to 1000 ng mL-1 (10, 50, 100, 250, 500, and 1000 ng mL-1) were prepared by mixing 10 µL of each working standard solutions, 10 µL of IS (final concentration of 1 µg mL-1), and 10 µL of 0.25% ascorbic acid to prevent OLA degradation23,25 with 90 µL of pooled rat blank plasma. Quality control samples (QC) were also prepared at concentrations of 25 ng mL-1 (low), 375 ng mL-1 (medium), and 750 ng mL-1 (high). Moreover, diluted samples (DS) were prepared by diluting the samples containing 3000 ng mL-1 of OLA with blank plasma to the concentration of 1000 ng mL-1. This DS were prepared to ensure that plasma samples of above 1000 ng mL-1 are within the calibration range. Pooled plasma was obtained after collecting the blood from healthy and drug-free animals. For drug extraction from calibration curve and QC samples, 500 µL of methyl tert-butyl ether was added to the samples. After vortexing for 5 min, samples were centrifuged for 10 min at 6800 g at 4 ± 2 ºC. The tubes were placed in a freezer for 5 min. The liquid supernatant was transferred to 5 mL plastic tubes and completely evaporated at 40 ± 2 ºC using a centrifugal vacuum concentrator, RC 1010 (Jouan, France). The dry residues were reconstituted with 100 µL of acetonitrile:water (50:50, v/v) and sonicated for 3 min. Plasma samples from animals (100 µL) were processed as similar to that of calibration curve and QC samples. Validation of the bioanalytical method The method was validated for plasma samples to evaluate specificity, lower limit of quantitation (LLOQ), linearity, recovery, accuracy, precision, matrix effect, dilution integrity, and stability, in accordance with ICH and FDA guidelines.37,38 Specificity and carry-over effect Blank plasma samples (without OLA and IS) from different rats were collected and analyzed to evaluate potential endogenous interferences in the OLA and IS analysis. The results were compared with the response at the lower limit of quantitation (LLOQ). Furthermore, the carry-over was evaluated by injecting three blank samples after a sample at the high calibration curve concentration. Lower limit of quantification (LLOQ) and linearity The linearity method was determined on three different days after analysis of two calibration curves/day containing six non-zero concentrations ranging from 10 to 1000 ng mL-1. In addition, a blank sample (a plasma sample processed without OLA and IS) and a zero sample (a plasma processed just with IS) were analyzed. The calibration curve was fitted by linear regression analysis of the peak area ratios from OLA-to-IS plotted against the different OLA concentrations using 1/x as weight. The acceptance criteria for each calibration curve linearity was a correlation higher than 0.98. Accuracy and precision The intra-day accuracy and precision of the method were evaluated by the analysis of five replicates of LLOQ, QC samples (25, 375, and 750 ng mL-1), and DS samples on three consecutive days. Data from all the three days were used to evaluate inter-day accuracy and precision. Inter-day and intra-day accuracy were expressed as the percentage ratio between the experimental and nominal concentrations for each sample. Precision was expressed as relative standard deviation (RSD) obtained by the quotient of the standard deviation and the media of the values. The acceptability criteria for precision were ±20% standard deviation from the nominal values for the LLOQ and ±15% for the other values. Acceptability criteria for the mean accuracy was 100% ± 15% for the nominal concentration of all points of the calibration curve except LLOQ, for which a 100% ± 20% value was accepted. Extraction recovery and matrix effects The extraction recovery and matrix effects of OLA and IS were evaluated using three replicates of QC samples at concentrations of 25 and 750 ng mL-1 for OLA and 1000 ng mL-1 for IS. The recovery of OLA from the extraction procedure was determined by comparing the peak areas in spiked plasma before the extraction and the corresponding peak areas of the prepared standard solutions. The matrix effect was assessed by dividing the peak areas of each compound obtained from spiked plasma after the extraction with the same corresponding concentration in organic solution. Stability Stability was evaluated in plasma samples under different conditions. The stability of OLA in plasma samples was evaluated in triplicate at low (25 ng mL-1) and high (750 ng mL-1) QC concentrations. The results of concentration at time zero (freshly prepared samples) were used as reference for stability evaluation. The samples were considered stable if the changes in concentrations were less than 15% as that of time zero samples. For bench-top temperature stability, samples were maintained at room temperature (25 ± 2 ºC) for 12 h, which exceeds the collection, freezing, and the routine sample preparation time. The long-term stability was evaluated by keeping the samples at -80 ± 4 ºC for 60 days before the analysis. The stability of the post-processed samples was measured after 12 h in the autosampler at 4 ± 2 ºC. The stability of OLA after freeze-thaw cycles was evaluated over three freeze-thaw cycles, with a minimum freezing intervals of 24 h. Preparation of olanzapine-loaded lipid-core nanocapsules According to previously reported method,39 100 mg OLA, 1200 mg poly (ε-caprolactone), 770 mg sorbitan monostearate, and 2.2 mL caprylic/capric triglycerides were dissolved in 270 mL of acetone and 30 mL of ethanol. At the same time, 770 mg polysorbate 80 was solubilized in 540 mL Milli-Q water. After mixing both the phases, the organic phase was poured into the aqueous phase under magnetic stirring at 40 ºC. The preparation was evaporated to 100 mL, resulting in the olanzapine loaded lipid-core nanocapsules (OLA-LNC). The physicochemical characterization of the particle was previously demonstrated.39 The OLA in solution (OLA-FREE) was compared to the OLA-LNC formulation. OLA-FREE was prepared by mixing 100 mg OLA in 100 mL phosphate buffer with pH equal to 6.2. Pharmacokinetic protocol This study was previously approved by the Ethical Committee on Animal Care of the Universidade Federal do Rio Grande do Sul (Protocol 21615) and it was conducted in accordance with the international norms of animal care and maintenance. For the pharmacokinetics study, 2.5 mg kg-1 of OLA-FREE or OLA-LNC were administered via i.v. bolus in the lateral tail vein of Wistar male rats (weighing about 300 g). Blood samples (200 to 250 µL) were obtained from the counter lateral tail vein according to the specific schedule (0.083, 0.25, 0.5, 0.75, 1, 1.5, 2, 4, and 6 h after dosing) via puncture and placed into heparinized tubes. The plasma was separated by centrifugation at 6800 g and 4 ºC for 10 min and stored at -80 ºC until the assay. Pharmacokinetic parameters of OLA in plasma after OLA-FREE or OLA-LNC administrations were determined by non-compartmental analysis of individual plasma profiles with the aid of Excel® v.15.0 software (Microsoft, USA).40 Pharmacokinetic parameters are presented as mean ± standard deviation (SD). The Student's t-test was used to analyze the differences between pharmacokinetic parameters of both groups. A probability (p) of less than 0.05 was considered statistically significant.
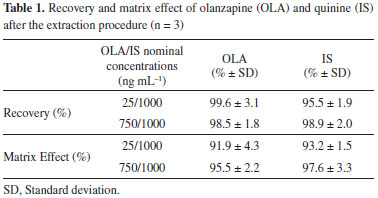
RESULTS AND DISCUSSION The chromatographic conditions, mainly of the analytical column and of the mobile phase composition, were optimized over several tests in order to achieve an intended sensitivity, specificity, separation, and analytical running time for the analyte and IS. Different C8 and C18 columns with different sizes (50, 75, and 150 mm) were evaluated. The Shim Pack CLC-C8 column (150 mm × 4.6 mm) was selected, because it produced an excellent performance with a good peak shape and short analytical time. Additionally different mobile phase compositions using organic solvents like methanol or acetonitrile and ammonium acetate buffer as an aqueous phase in different proportions, with pH adjusted with formic acid or acetic acid were evaluated. The mobile phase composed of acetonitrile-ammonium acetate (0.05 M)-acetic acid (70:30:0.1, v/v/v) (pH* 4.0) resulted in the highest peak area for the analyte, with no interferences in OLA and IS peaks. At the early stages of the development of the extraction method different solvents and solvent mixtures such as acetonitrile, methanol, methyl tert-butyl ether, ethyl acetate, dichloromethane, methanol, tri-chloroacetic acid, sodium hydroxide, ether, chloroform, acetic acid, formic acid and their mixtures were tested, for protein precipitation or liquid-liquid extraction (LLE). The best results, which showed low interference with OLA and IS quantification and highest recoveries were obtained using methyl tert-butyl ether as extracting solvent, in a proportion of 1:5 plasma/organic solvent. Moreover, low volumes of plasma were required (100 µL) to obtain a clean sample and to avoid the introduction of non-volatile materials into the column and in the MS system. Clean samples are essential for decreasing matrix effects and ion suppression in LC-MS/MS analysis.41 The LLE procedure showed high recoveries for OLA and for IS, confirming the suitability of the method for analysis of plasma samples (Table 1). Furthermore, no significant carry-over and matrix effects from OLA and IS were observed.
When the chromatograms obtained from blank, spiked rat plasma (10 ng mL-1), and samples obtained after OLA dosing to rats were compared, no interferents from plasma were observed, showing the selectivity of the method. Representative chromatograms using the current method from blank plasma, spiked rat plasma at the LLOQ standard (10 ng mL-1), the IS (1000 ng mL-1), and real animal sample are shown in Figure 2.
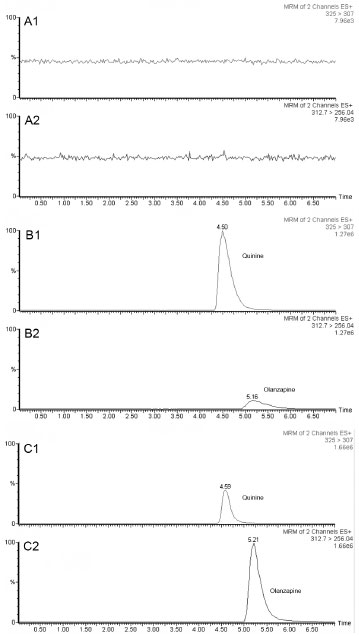 Figure 2. Representative LC-MS/MS chromatograms: of quinine (IS, 1) and olanzapine (OLA, 2). (A) MRM of blank plasma; (B) MRM of blank plasma spiked with olanzapine (10 ng mL-1) and IS (1 µg mL-1); (C) MRM of 1 h plasma sample from rat dosed with OLA-LNC at 2.5 mg kg-1 i.v.
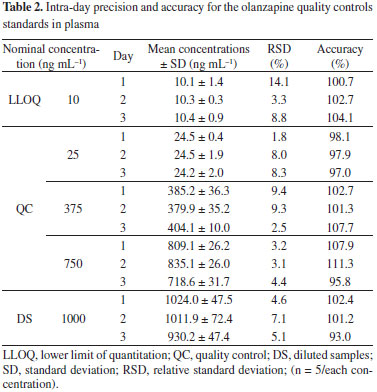
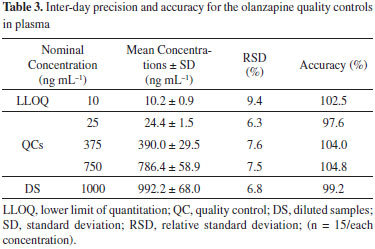
The six plasma calibration curves determined over the concentration ranges from 10 to 1000 ng mL-1 using a 1/x weighting scheme were linear. The analysis of variance indicated no significant differences in the slopes of the calibration curves (p > 0.05). Moreover, the determination coefficient calculated (r2) with the mean calibration curve was 0.9996 (y = 0.012966x + 0.073887, where y is OLA/IS peak-area ratio). The results of intra-day precision and accuracy for OLA at LLOQ, QC, and DS samples in plasma are shown in Table 2, while the results of inter-day precision and accuracy for OLA at LLOQ, QC and DS samples in plasma are shown in Table 3. The intra-day imprecision (% RSD) of the method was below 15%, and accuracy ranged from 93% to 111.3%. The inter-day precision (% RSD) was above 90%, and accuracy ranged from 97.6% to 104.8%. These results demonstrated the precision and accuracy of the developed bioanalytical method.
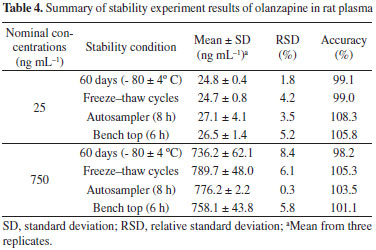
The results of the stability tests are shown in Table 4. After extraction, the plasma was stable in the LC autosampler for at least 8 h. Moreover, the bench-top stability results show that spiked samples were stable for 6 h. The samples were stable for three freeze-thaw cycles and for 60 days at -80 ºC. The good stability values observed are due to the presence of ascorbic acid in the sample treatment method, which was recommended in other works.23,25
In a recent paper, OLA was successfully loaded into polymeric lipid-core nanocapsules using the interfacial deposition of the preformed polymer technique without the need for purification steps. The lipid-core nanocapsules showed a particle size, measured by dynamic light scattering, of 156 ± 14 nm, pH of 6.12 ± 0.14, zeta potential of-17.2 ± 2.4 and encapsulation efficiency higher than 80%.39 The bioanalytical method developed was applied in the preclinical pharmacokinetic investigation of the OLA-LNC after intravenous 2.5 mg kg-1 dosing to Wistar rats in comparison with the drug administered alone (OLA-FREE) (n = 3/group). The mean plasma concentration-time profiles for both formulations are shown in Figure 3. Mean pharmacokinetic parameters obtained by non-compartmental analysis are summarized in Table 5. Higher concentrations of OLA in plasma were obtained using OLA-LNC, in comparison with OLA-FREE dosing. The zero time-concentration was almost 3 times higher for OLA-LNC formulation, when compared with the OLA-FREE. After OLA-LNC administration a significant 2.3 times increase (p > 0.05) in AUC0-6h,a 0.45 times decrease in clearance (CL), and a 0.66 fold decrease in volume of distribution (Vdss) was observed for OLA-LNC as compared with OLA-FREE. Due to the changes in CL and Vdss, the half-life was not significantly altered. The lipid-core nanocapsules influenced OLA distribution and elimination probably due to a decrease in drug uptake by macrophages as previously reported for nanocarriers coated by polysorbate 80.42 Further experiments, however, have to be conducted to elucidate the mechanisms involved in the alterations observed in OLA pharmacokinetics due to nanoencapsulation.
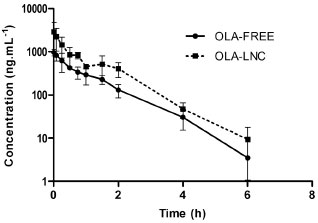 Figure 3. Mean olanzapine plasma concentration-time profiles after 2.5 mg kg-1 i.v. dose of olanzapine-loaded lipid-core nanocapsules (OLA-LNC) and olanzapine in solution (OLA-FREE) to Wistar rats (mean ± SD, n = 3/group)
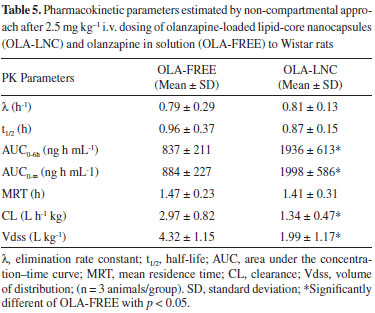
Nonetheless, the results demonstrate a developed and validated bioanalytical method suitable to quantify OLA concentrations in rat plasma after drug dosing as a free or nanoencapsulated form. The method's LLOQ was low enough to allow the appropriate characterization of OLA elimination phase for both formulations, resulting in an extrapolated AUC lower than 20% of the AUC0-∞.
CONCLUSION This work described a new LC-MS/MS method for the quantification of OLA in plasma after drug dosing as solution or loaded into a lipid-core nanocapsule formulation. The method was validated and found to be simple, specific, sensitive, linear, accurate, and precise with an advantage of using low sample volume (100 µL). The method was successfully applied to a pharmacokinetic preclinical study of OLA-LCN in rats after i.v. administration. A more extensive investigation of OLA-LCN formulation pharmacokinetics after other administration routes is underway.
ACKNOWLEDGEMENTS This study was supported by the Brazilian agencies: CNPq/MCT, Rede Nanocosméticos/CNPq-MCT, Capes, and FAPERGS. F. Dimer and M. Pigatto were recipients of Brazilian CNPq and Capes fellowship, respectively.
REFERENCES 1. Littrell, K. H.; Littrell, S. H.; Journal of the American Psychiatric Nurses Association 1997, 3, S18. 2. Bymaster, F. P.; Nelson, D. L.; DeLapp, N. W.; Falcone, J. F.; Eckols, K.; Truex, L. L.; Foreman, M. M.; Lucaites, V. L.; Calligaro, D. O.; Schizophrenia Research 1999, 37, 107. 3. Fountoulakis, K. N.; Vieta, E.; Int. J. Neuropsychopharmacol. 2008, 11, 999. 4. Edlinger, M.; Hofer, A.; Rettenbacher, M. A.; Baumgartner, S.; Widschwendter, C. G.; Kemmler, G.; Neco, N. A.; Fleischhacker, W. W.; Schizophrenia Research 2009, 113, 246. 5. Rummel-Kluge, C.; Komossa, K.; Schwarz, S.; Hunger, H.; Schmid, F.; Lobos, C. A.; Kissling, W.; Davis, J. M.; Leucht, S.; Schizophrenia Research 2010, 123, 225. 6. Boyda, H. N.; Procyshyn, R. M.; Tse, L.; Wong, D.; Pang, C. C.; Honer, W. G.; Barr, A. M.; Neuropharmacology 2012, 62, 1391. 7. Rubenstein, A. H.; Trans. Am. Clin. Climatol. Assoc. 2005, 116, 103. 8. Schaffazick, S. R.; Guterres, S. S.; Freitas, L. L.; Pohlmann, A. R.; Quim. Nova 2003, 26, 726. 9. Jäger, E.; Venturini, C. G.; Poletto, F. S.; Colomé, L. M.; Pohlmann, J. P. U.; Bernardi, A.; Battastini, A. M. O.; Guterres, S. S.; Pohlmann, A. R.; J. Biomed. Nanotechnol. 2009, 5, 130. 10. Frozza, R. L.; Bernardi, A.; Paese, K.; Hoppe, J. B.; da Silva, T.; Battastini, A. M. O.; Pohlmann, A. R.; Guterres, S. S.; Salbego, C.; J. Biomed. Nanotechnol. 2010, 6, 694. 11. Bernardi, A.; Braganhol, E.; Jager, E.; Figueiro, F.; Edelweiss, M. I.; Pohlmann, A. R.; Guterres, S. S.; Battastini, A. M. O.; Cancer Lett. 2009, 281, 53. 12. Dimer, F. A.; Ortiz, M.; Pase, C. S.; Roversi, K.; Friedrich, R. B.; Pohlmann, A. R.; Burger, M. E.; Guterres, S. S.; J. Biomed. Nanotechnol. 2014, 10, 1137. 13. Olesen, O. V.; Linnet, K.; J. Chromatogr. B. 1998, 714, 309. 14. Weigmann, H.; Härtter, S.; Maehrlein, S.; Kiefer, W.; Krämer, G.; Dannhardt, G.; Hiemke, C.; J. Chromatogr. B. 2001, 759, 63. 15. Dusci, L. J.; Peter Hackett, L.; Fellows, L. M.; Ilett, K. F.; J. Chromatogr. B. 2002, 773, 191. 16. Zhang, G.; Terry Jr, A. V.; Bartlett, M. G.; J. Chromatogr. B. 2007, 856, 20. 17. Chiu, J. A.; Franklin, R. B.; J. Pharm. Biomed. Anal. 1996, 14, 609. 18. Raggi, M. A.; Casamenti, G.; Mandrioli, R.; Volterra, V.; J. Chromatogr. B. 2001, 750, 137. 19. Raggi, M. A.; Mandrioli, R.; Sabbioni, C.; Ghedini, N.; Fanali, S.; Volterra, V.; Chromatographia 2001, 54, 203. 20. Madej, K.; Biedron, A.; Garbacik, A.; J. Liq. Chromatogr. Relat. Technol. 2009, 32, 3025. 21. Bogusz, M. J.; Kruger, K. D.; Maier, R. D.; Erkwoh, R.; Tuchtenhagen, F.; J. Chromatogr. B: Biomed. Sci. Appl. 1999, 732, 257. 22. Chin, C.; Zhang, Z. P.; Karnes, H. T.; J. Pharm. Biomed. Anal. 2004, 35, 1149. 23. Berna, M.; Ackermann, B.; Ruterbories, K.; Glass, S.; J. Chromatogr. B. 2002, 767, 163. 24. Gunaratna, P. C.; Kissinger, P. T.; Kissinger, C. B.; Gitzen, J. F.; J. Pharmacol. Toxicol. Methods 2004, 49, 57. 25. Zhou, Z.; Li, X.; Li, K.; Xie, Z.; Cheng, Z.; Peng, W.; Wang, F.; Zhu, R.; Li, H.; J. Chromatogr. B. 2004, 802, 257. 26. Nirogi, R. V. S.; Kandikere, V. N.; Shukla, M.; Mudigonda, K.; Maurya, S.; Boosi, R.; Yerramilli, A.; J. Pharm. Biomed. Anal. 2006, 41, 935. 27. Zhang, G.; Terry, A. V.; Bartlett, M. G.; Rapid Commun. Mass Spectrom. 2007, 21, 920. 28. Choong, E.; Rudaz, S.; Kottelat, A.; Guillarme, D.; Veuthey, J.-L.; Eap, C. B.; J. Pharm. Biomed. Anal. 2009, 50, 1000. 29. Elshafeey, A. H.; Elsherbiny, M. A.; Fathallah, M. M.; Clin. Ther. 2009, 31, 600. 30. Josefsson, M.; Roman, M.; Skogh, E.; Dahl, M.-L.; J. Pharm. Biomed. Anal. 2010, 53, 576. 31. Cao, J.; Zhang, Z.; Tian, Y.; Li, Y.; Rui, J.; Curr. Pharm. Anal. 2012, 8, 247. 32. Gopinath, S.; Kumar, R. S.; Alexander, S.; Danabal, P.; Biomed. Chromatogr. 2012, 26, 1077. 33. Patel, D. S.; Sharma, N.; Patel, M. C.; Patel, B. N.; Shrivastav, P. S.; Sanyal, M.; Acta Pharm. Sin. B 2012, 2, 481. 34. Zheng, Q.; Wang, F.; Li, H.; Xu, P.; Tang, H.; Li, L.; Cheng, R.; J. Chromatogr. B 2012, 905, 127. 35. Haas, S. E.; Brum, L.; de Andrade, C.; Azeredo, F. J.; Pigatto, M.; Silva Torres, B. G.; Guterres, S. S.; Costa, T. D.; J. Liq. Chromatogr. Relat. Technol. 2012, 35, 2873. 36. Torres, B. G. S.; Uchôa, F. D. T.; Canto, R. F. S.; Crestani, A.; Eifler-Lima, V.; Costa, T. D.; Quim. Nova 2014, 37, 461. 37. Food and Drug Administration (FDA); Guidance for Industry: Bioanalytical Method Validation, 2001. 38. International Conference on Harmonization (ICH); Technical Requirements for the Registration of Pharmaceutical for Human Use, Validation of Analytical Procedures: Text and Methodology Q2 (R1), 2005. 39. Dimer, F. A.; Pohlmann, A. R.; Guterres, S. S.; J. Nanosci. Nanotechnol. 2013, 13, 8144. 40. Shargel, L.; Yu, A.; Wu-Pong, S.; Applied Biopharmaceutics & Pharmacokinetics, 6th ed., McGraw-Hill, 2012. 41. Sismotto, M.; Paschoal, J. A. R.; Reyes, F. G. R.; Quim. Nova 2013, 36, 449. 42. Longmire, M.; Choyke, P. L.; Kobayashi, H.; Nanomedicine 2008, 3, 703. |
On-line version ISSN 1678-7064 Printed version ISSN 0100-4042
Qu�mica Nova
Publica��es da Sociedade Brasileira de Qu�mica
Caixa Postal: 26037
05513-970 S�o Paulo - SP
Tel/Fax: +55.11.3032.2299/+55.11.3814.3602
Free access


