Artigo
| Determination of sulfate in the wet-process of phosphoric acid by reverse flow injection |
|
Wenhui Shi; Lin Yang; Quanjun Fu; Zhiye Zhang; Xinlong Wang*
School of Chemical Engineering, Sichuan University, Chengdu 610065, China Recebido em 25/03/2014 *e-mail: wangxl@scu.edu.cn An improved method based on reverse flow injection is proposed for determining sulfate concentration in the wet-process of phosphoric acid (WPA). The effect of reagent composition, flow rate, temperature, acid concentration, length of the reaction coil, and linear response range on the flow system is discussed in detail. Optimal conditions are established for determining sulfate in the WPA samples. Baseline drift is avoided by a periodic washing step with EDTA in an alkaline medium. A linear response is observed within a range of 20-360 mg L-1, given by the equation A = 0.0020C (mg L-1) + 0.0300, R2 = 0.9991. The detection limit of the proposed method for sulfate analysis is 3 mg L-1, and the relative standard deviation (n = 12) of sulfate absorbance peak is less than 1.60%. This method has a rate of up to 29 samples per hour, and the results compare well with those obtained with gravimetric method. INTRODUCTION Wet-process phosphoric acid (WPA) is prepared by acidulating apatite from phosphate rock with sulfuric acid. The reaction combines calcium from the phosphate rock with sulfate from sulfuric acid to form phosphoric acid and calcium sulfate crystals. The calcium sulfate crystals are then filtered from the reaction slurry; thus, WPA is obtained. The efficiency of WPA production process is primarily influenced by filtration rate. Sulfate concentration exerts significant influence on the formation of crystals, growth of calcium sulfate crystals, and the filterability of the reaction slurry.1 Furthermore, it affects the phosphate rock extraction rate. During the production of WPA, the calcium to sulfate ratio must be adjusted to an optimal value to increase filtration and extraction rates. Consequently, analysis of sulfate in WPA slurry is essential. By determining the sulfate amount, the sulfuric acid can be adjusted accurately to increase the production efficiency of WPA. Many methods have been proposed for the determination of sulfate in WPA slurry. Gravimetric BaSO4 method is well known for sulfate determination.2,3 This method is simple, and the analysis results are accurate. However, because of the inherent characteristics of gravimetric analysis, it is time consuming with low sensitivity.4 Moreover, in the industrial production process, numerous samples are involved, thus making this method less convenient. Sodium rhodizonate method is usually employed for sulfate determination during WPA production. A red precipitate is formed when sodium rhodizonate is mixed with barium chloride solution of a known concentration. The solubility of this red-colored complex is significantly greater than that of the barium sulfate. When sulfate solution is added to this solution, BaSO4 is precipitated, and the color disappears.5 This method is characterized by simple operation, higher analysis speed, and low reagent consumption. However, only a measurement range, rather than an actual value, can be obtained with this method. Moreover, the deviation is larger when compared with the results obtained using the gravimetric method. Therefore, sulfuric acid concentration cannot be accurately adjusted during the production of WPA. Thermosensitive titrimetric method has currently been adopted by some researchers for determining the sulfate concentrations in WPA slurry. Although this method is more complicated, its analysis speed is much higher than that of the gravimetric method. This method needs fewer reagents, and the precision is close to that of the gravimetric method. However, thermal titration is expensive with specific requirements for indoor temperature. Turbidimetric method is also used for determination of sulfate.6 The results obtained using this method are similar to those obtained using the gravimetric method. The method is highly accurate. However, the time spent on each measurement can be rather long because the detection process can be performed only when the reaction is in a steady state. The repeatability of this method is poor because it is greatly affected by the operator's skill of the operator and, in some cases, by the time at which the detection is conducted.7 Moreover, the linear response range is relatively narrow; therefore, this method is not suitable for sulfate control during WPA production. Therefore, this paper presents a convenient procedure for quickly and accurately analyzing sulfate in WPA slurry by introducing reverse flow injection analysis (r-FIA) technology.7-14 Flow analysis is a widely used methodology for analytical measurements and has many significant advantages.7,15-20 The sulfate in WPA slurry can be easily and conveniently analyzed using this flow system because almost all operations (such as sampling and separation and mixing of reagents) involved in sulfate analysis are automated. Moreover, this approach minimizes reagent consumption and maximizes sampling rate. The effects of reagent composition, flow rate, temperature, acid concentration, length of reaction coil, and linear response range on the r-FIA system are discussed in detail in the following sections. The results demonstrates the high performance of the r-FIA method, which is based on the reaction of sulfate with barium ions, with respect to sampling rate, precision, linearity, and accuracy.
EXPERIMENTAL Reagents and solution All the solvents and reagents are of analytical grade unless stated otherwise. Double distilled water is used throughout the experiment. A 5000 mg L-1 sulfate stock solution is prepared by dissolving 2.72 g of dried K2SO4 in 250 mL water. A standard working solution (20-360 mg L-1 SO42-) containing 0.02 mol L-1 hydrochloric acid is prepared by proper dilution of the stock solution. A 4.0% (w/v) barium chloride solution containing 4.0% (v/v) ethanol, and 2.4% (v/v) nonyl phenol polyethyleneoxy ether (OP-10) is used as the precipitating reagent. A 5.0% (w/v) alkaline ethylenediaminetetraacetic acid (EDTA) in 5.0% (v/v) NH3•H2O is used as the washing solution. The WPA samples were provided by the YUNTIANHUA Group. The concentration of P2O5 is 10-27% (w/w). The concentration of Fe3+, Mg2+, and Al3+ of the impurity is in the range of 0.7-1.5% (w/w). Reverse flow injection analysis system The flow system, shown in Figure 1, is composed of an eight-way multiposition selector valve, a Teflon tube (i.d. = 0.8 mm), two peristaltic pumps, a 1 cm optical path flow cell, a thermostatic bath, a reaction coil, accessories, and a spectrophotometer connected to a PC equipped with UV professional software.21-24
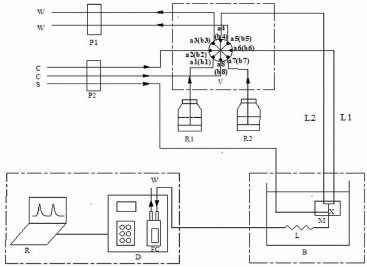 Figure 1. Reverse flow injection analysis system. P1, P2: peristaltic pump, S: samples, C: carrier stream(water), R1:alkaline EDTA solution, R2: precipitation reagent, L: reaction coil, V: 8-way multi-position selector valve, M: reactor block, FC: 1-cm optical path flow cell, D: spectrophotometer, R: recorder(computer), L1: output tube of precipitation reagent, L2:output tube of washing solution, X: confluent point, W: waste liquid, B: thermostatic bath
At the load position of 25 s, the precipitating reagent and alkaline EDTA solution are directly aspirated through pump P1, and they fill sample loops 1-1' and 3-3', respectively, with the excess discarded (W). The length of the sample loop determines the injected reagent's volume. The sulfate solution is continuously added through confluence point X. After the sample loops are filled, the corresponding actuator is activated to switch this valve to the injection position of 100 s. This simple movement causes the simultaneous introduction of both the precipitating reagent and EDTA solution into their corresponding carrier streams (water). Small aliquots of the solutions are inserted into the analytical path, thus generating a repeatable sampling profile. The precipitating reagent is physically transported by the carrier stream to the reactor block where it mixes with the sulfate solution. The sulfate anions and barium ions react to form insoluble barium sulfate particles in the reactor coil, which has been immersed in the thermostatic bath at 30 ºC. Finally, the reaction product is transported by the carrier solution to the spectrophotometer, where the detection signal is acquired at 420 nm wavelength. The analytical signal is directly proportional to sulfate concentration. After the analytical signal has been recorded, an alkaline EDTA solution is added into the reaction coil to dissolve BaSO4 by the formation of Ba(EDTA)2- complex, thus removing the remaining solid particles of barium sulfate adhered to the tube. This cleaning step is introduced to avoid positive drift of the baseline and clogging of the analytical path. The measurements are taken in triplicates at least.
RESULTS AND DISCUSSION System optimization The primary parameters, such as the length of the reaction coil, flow rate, volume of the precipitating reagent, acid concentration, and temperature, affecting this method are optimized to achieve desirable performance and robustness of the system. Further, these variables, which are related to the r-FIA system, are studied using the univariate analysis method. A balance among the analysis speed, precision, and linearity is the aim of this study. Concentration of nonionic surfactant OP-10 Addition of surfactants is typically needed in turbidimetry to guarantee uniform nucleation. Surfactants can encapsulate particles, resulting in steric hindrance to particles, thus effectively avoiding particle agglomeration.7,17,19,20 Moreover, the absence or presence of protective colloids in a suspension affects the particle size.7 One of the factors examined in this study is the concentration of nonionic surfactant OP-10, which is used to stabilize BaSO4 suspension, thus increasing the repeatability of the determination. Different concentrations of OP-10 ranging from 0.8 to 4.0% (v/v) are assayed. The analytical signal and relative standard deviation (RSD%) of 156 mg L-1 SO42- are evaluated, and the results are shown in Table 1. The analytical curves corresponding to the different concentrations of nonionic OP-10 are shown in Figure 2. The analytical signal is higher in the presence of OP-10 when compared with the signal obtained without any surfactant. Furthermore, the RSD% is lower when compared with the result when OP-10 is absent because the presence of nonionic surfactant OP-10 increases the hydrophilicity of particles and effectively prevents particle agglomeration, thereby improving the analytical signal and precision of the analysis.16,17 The analytical signal is slightly improved with the increasing concentration of OP-10 when the concentration is below 2.4% (v/v) because when the concentration of OP-10 is less than 2.4% (v/v), dispersion of BaSO4 particles occurs. However, a higher concentration of OP-10 is not recommended because of the aggregation of oil drops. The linearity of the analytical curves is greatly improved when compared with the results obtained in the absence of OP-10. Moreover, the linearity of the analytical curves is satisfactory when the concentration of OP-10 is 2.4% (v/v). Therefore, an OP-10 concentration of 2.4% (v/v) is chosen for further experiments. The OP-10 concentration of 2.4% is greater than the critical micelle concentration (CMC) of OP-10, which is 40 × 10-5 mol L-1.25
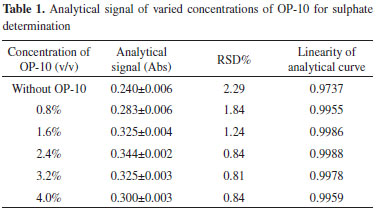
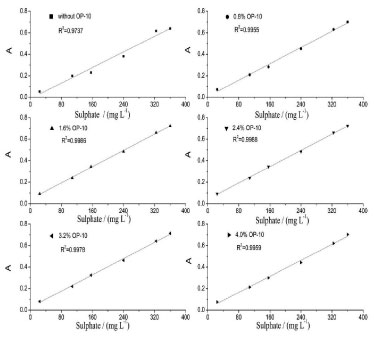 Figure 2. Analytical curves of varied concentrations of OP-10 for sulphate determination
Concentration of ethanol The dielectric constants of organic solvents are comparatively lower than that of water. Therefore, addition of organic solvents may increase the electrostatic attraction between ions in solution, leading to precipitation.26 In this study, ethanol is added to the precipitating reagent, and its effect on the r-FIA system is investigated. The analytical signal and RSD% of 228 mg L-1 SO42- are evaluated, and the results are shown in Table 2. The analytical curves for different concentrations of ethanol are shown in Figure 3. The results show that a higher amplitude analytical signal can be obtained by adding ethanol to the precipitating reagent because ethanol can effectively enhance the hydrophilicity of the barium sulfate particles, thus further hindering the agglomeration of particles. Furthermore, the addition of ethanol may affect the nucleation process because it can reduce the activation energy for homogeneous nucleation, thus boosting the nucleation rate. Ethanol has better growth inhibition effects in the BaSO4 crystal growth process.27 In view of the favorable influence of ethanol concentration, its concentration must be as high as possible. However, the RSD% of the analysis increases with increasing ethanol concentration. Therefore, the concentration of ethanol cannot be increased randomly because it will pose difficulties during system washing and causes baseline instability and contributes to the formation of air bubbles inside the analytical path.18 The analytical curve shows good linearity when the ethanol concentration is 4.0% (v/v). Therefore, 4.0% (v/v) ethanol is chosen for subsequent experiments.
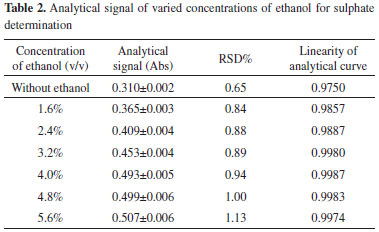
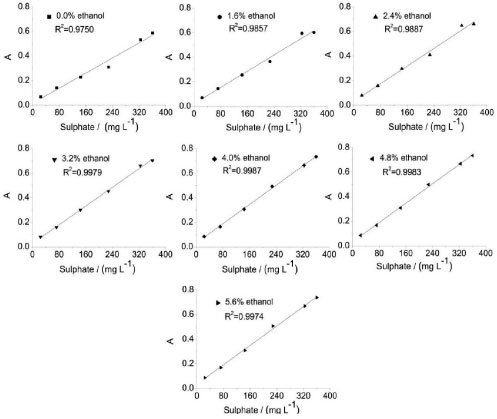 Figure 3. Analytical curves of varied concentrations of ethanol for sulphate determination
Volume of precipitating reagent The effect of the volume of the precipitating reagent on the proposed method is investigated within the range of 100-500 µL. The analytical signal and RSD% of 228 mg L-1 SO42- are evaluated, and the results are shown in Table 3. The analytical curves corresponding to different volumes of the precipitating reagent are shown in Figure 4. Experiments show that when the volume is very small, the relationship between the analytical signal and sulfate concentration is nonlinear. A linear relationship between analytical signal and sulfate concentration can be observed when the concentration reaches up to 300 µL. When the volume is increased from 300 to 400 µL, the magnitude of analytical signal is also increased, and the linearity of the analytical curves is simultaneously improved. However, the analytical signal presents a small difference when the volume of the precipitating reagent is greater than 400 µL. Namely, the magnitude of the analytical signal increases by approximately 14% when the volume is increased from 200 to 400 µL; however, a similar trend cannot be seen above 400 µL. Therefore, 400 µL of the precipitating reagent is used for subsequent experiments to obtain a satisfactory degree of precise and linear analysis. In this case, the dispersion coefficient value is calculated to be 5.3.28
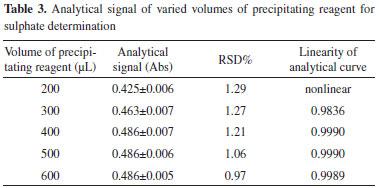
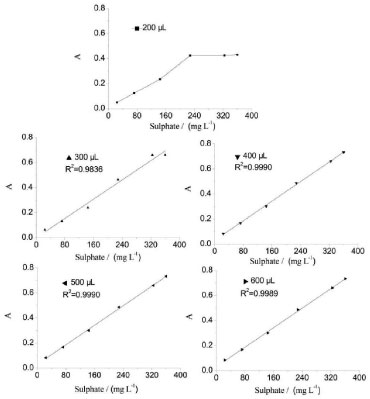 Figure 4. Analytical curves of varied volume of reagent for sulphate determination
Flow rate To improve the analysis frequency, the flow rate and length of the reaction coil are also optimized. The flow rate is varied within a range of 2.1-4.2 mL min-1. The analytical signals and RSD% of 156 mg L-1 SO42- are evaluated, and the results are shown in Table 4. The analytical curves of the different flow rates are shown in Figure 5. The results show that a negative correlation exists between the flow rate and the analytical signal. When the flow rate is increased from 2.1 to 4.2 mL min-1, the analytical signal magnitude decreases by approximately 20%. The negative correlation implies that the lower the flow rate, the higher the obtained analytical signal. However, it should be noted that a lower flow rate not only decreases the sampling frequency but also favors the formation of air bubbles along the analytical tube and the flow cell, which impedes detection. Therefore, after considering precision, reagent consumption, sampling rate, and linearity, a flow rate of 3.2 mL min-1 is selected for subsequent experiments.
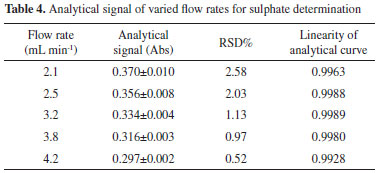
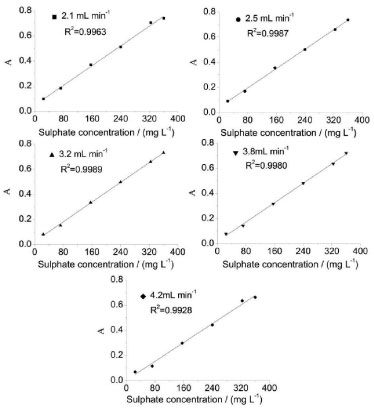 Figure 5. Analytical curves of varied flow rates for sulphate determination
Length of the reaction coil The length of the reaction coil is studied within the range of 80-200 cm. The analytical signals and RSD% of 216 mg L-1 SO42- are evaluated, and the results are shown in Table 5. The analytical curves at different lengths of the reaction coil are shown in Figure 6. The obtained results indicate that this parameter exerts minimal influence on the analytical signal and the linearity of the analytical curves when it is greater than 150 cm. When the length of the reaction coil increases from 150 to 200 cm, the amplitudes of the analytical signals remain almost constant. This phenomenon is explored to analyze the concepts of dispersion and residence time. The increase in analytical signal amplitude because of the increased retention time with the longer reaction coil is offset by further dilution (larger axial dispersion) within the reaction zone when the BaSO4 suspension flows through the longer reaction coil.29 When the length of the reaction coil is less than 150 cm, the analytical signal is higher; however, the precision of the analysis is lower. To obtain a relatively higher level of precision and minimize the time required for sulfate determination, the length of the reaction coil is set to 150 cm. The selected 150-cm-long reaction coil provides desirable precision and linearity because it provides sufficient room for reaction completion and proper dispersion of the reaction product.
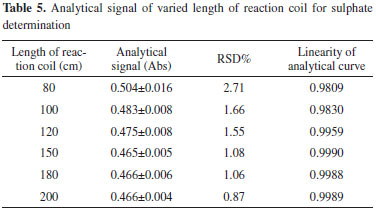
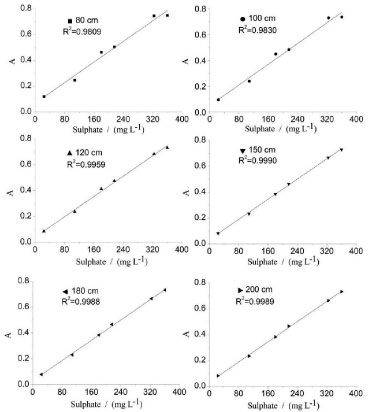 Figure 6. Analytical curves of varied length of reaction coil for sulphate determination
Temperature of the reaction The temperature of the reaction, acid concentration of samples, and the concentration of barium chloride are other important influencing variables and must be carefully controlled. The effect of temperature on the assay of sulfate is investigated within the range of 20-50 ºC. The analytical signals and RSD% of 204 mg L-1 SO42- are evaluated, and the results are shown in Table 6. The analytical curves at different temperatures are shown in Figure 7. Furthermore, the linearity of the analytical curves at different temperatures is also described in Table 6. As can be observed, the analytical signal increases almost linearly with increasing temperature because a lower temperature contributes to a larger number of crystal nucleuses, thus refining the BaSO4 particles. As the temperature increases, the crystal surface energy decreases, and the molecular thermal motion is intensified. The reduced surface energy may contribute to particle agglomeration. The intensified molecular thermal motion may increase the frequency of particle collisions, thus increasing the size of BaSO4 particles. Larger particles imply fewer particles, thus indicating a less pronounced scattering effect. Moreover, the stronger the scattering light, the higher the level of the analytical signal. Therefore, the analytical signal is higher at a high temperature than that at low temperature. Therefore, a higher temperature is conducive for obtaining a higher analytical signal. However, the RSD% of the analysis increases with the increase in temperature, whereas the linearity of the analytical curves decreases with increasing temperature. To obtain a desirable precision and linearity, the temperature of the analysis is controlled at a relatively lower temperature of 30 ºC.
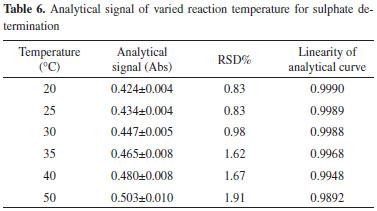
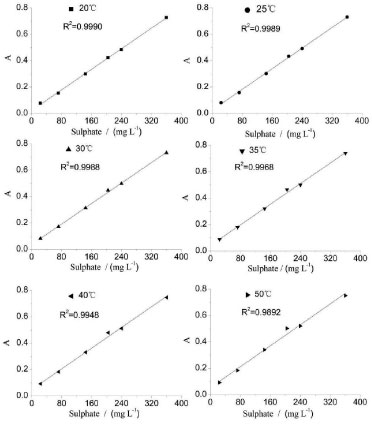 Figure 7. Analytical curve of varied temperatures for sulphate determination
Acid concentration Acid concentration of the sample is an important parameter that must be investigated. Here, acidity is associated with ionic strength, which affects the turbidimetric procedure.18 Therefore, this variable must be precisely adjusted to improve the stability of barium sulfate suspension. In this study, the acid concentration of the sample is adjusted by adding dilute hydrochloric acid. The analytical signal and RSD% of 156 mg L-1 SO42- are evaluated, and the results are shown in Table 7. The analytical curves at different acid concentrations are shown in Figure 8. The experimental results suggest that when the acid concentration of the sample is increased from 0.002 to 0.020 mol L-1, the peak height increases by approximately 31%. When acid concentration of the sample increases from 0.020 to 0.100 mol L-1, the values of the analytical signal are almost constant.
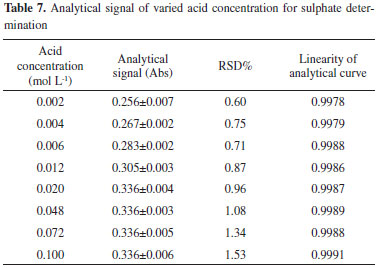
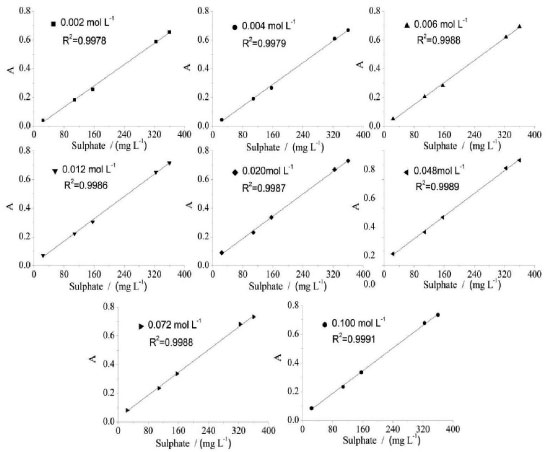 Figure 8. Analytical curves of varied temperatures for sulphate determination
Foreign ions such as Fe3+, Mg2+, and Al3+ exist mainly in the form of phosphate salts in the WPA slurry, thus resulting in a highly acidic environment. When the WPA samples are diluted, the acidity of the solution is weakened. When the acid concentration of the samples is low, the hydroxides of Fe3+, Mg2+, and Al3+ will be deposited. This hydroxide precipitation will clog the tube and hinder the determination of sulfate. Moreover, hydrochloric acid is added to prevent the formation of phosphate barium, which may interfere with sulfate determination. Therefore, the acid concentration of the samples is controlled within the range of 0.020-0.100 mol L-1. Length of output tube Precipitates may occasionally build up when turbidimetric flow methodologies are adopted. This leads to lower precision and may even block the tube.30 EDTA is a strong chelating agent and forms a stable complex with many metal ions.31 To dissolve the BaSO4 adhered to the tube, a washing step with EDTA solution in an alkaline medium is necessary.7,19,20 The concentrations of EDTA and NH3•H2O are then evaluated, with the former varied within a range of 3.0-6.0% (w/v) and the latter varied within a range of 3.0-7.0% (v/v). The results demonstrate that the optimal signal is obtained, and the baseline is stabilized when the washing solution is composed of 5.0% (w/v) EDTA and 5.0% (v/v) NH3•H2O. The concentration of NH3•H2O is not recommended to be very high because the tail peaks are obvious. Furthermore, the time at which the washing solution enters the reaction coil is an important parameter that affects the maximum absorption peak produced by the analyte. If the EDTA solution enters the reaction coil too early, it can interfere with the determination of the analyte. By adjusting the length of L2, the output tube, the time at which the washing solution enters the reactor coil can be controlled. The experiments are conducted by varying the length of L2 from 230 to 300 cm while maintaining the length of L1 at 80 cm. The results show that when L2 is longer than 270 cm, the baseline remains stable after a long-time operation. Therefore, the length of L2 is set to 270 cm. Concentration of barium chloride The concentration of barium chloride is varied from 2.0 to 6.0% (w/v). The analytical signal and RSD% of 132 mg L-1 SO42- are evaluated, and the results are shown in Table 8. The analytical curves for different barium chloride concentrations are shown in Figure 9. As can be observed, the analytical signal decreases as the barium chloride concentration decreases from 4.0 to 2.0% (w/v), indicating that when barium chloride concentration is less than 4.0%, the precipitation reaction is insufficient. Therefore, 4.0% (w/v) BaCl2 solution is used as the precipitating reagent because it results in higher analytical signals and better linearity for the r-FIA system than those obtained with barium chloride concentrations of 4.0-6.0% (w/v).
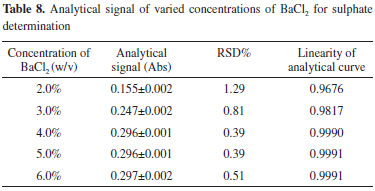
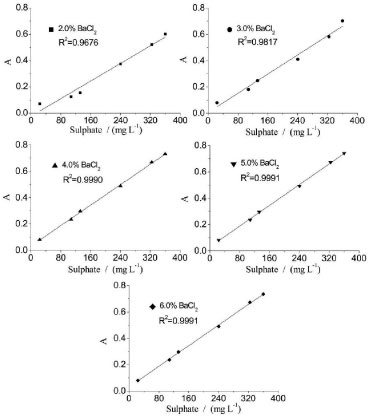 Figure 9. Analytical curves at varied concentrations of barium chloride for sulphate determination
Linearity range The sulfate concentration is optimized to obtain a good linearity. The minimal concentration is optimized to obtain the lowest turbidity without sensitivity loss. To evaluate the dynamic working range, the concentrations of sulfate anions are varied in the range of 10-400 mg L-1. A straight line is obtained when SO42- concentration ranges between 20 and 360 mg L-1. A typical calibration graph for sulfate, as shown in Figure 10, is plotted after analyzing eight different standard working solutions, with each concentration measured in triplicates. Each point of the calibration graph corresponds to a mean value obtained from three continuous absorption peaks. The calibration graph is described by the equation A = 0.0020 C (mg L-1) + 0.0300, and the correlation coefficient R2 = 0.9991, where A is the absorbance value at the maximum peak. The detection limit of the proposed method for sulfate analysis is 3 mg L-1.
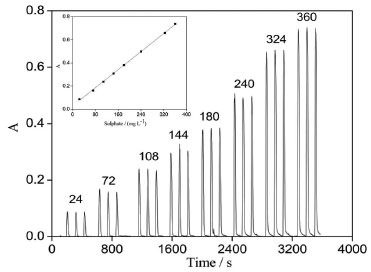 Figure 10. Transient signals obtained for sulphate standard working solution measured in triplicates. The insets show the corresponding calibration graph
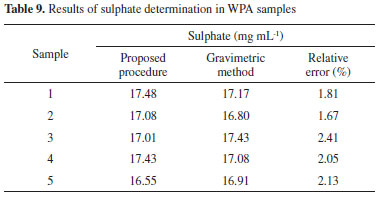
Analytical features The time required for determining sulfate concentration in WPA slurry is significantly shortened by the proposed method when compared with the conventional analysis methods such as gravimetric, sodium rhodizonate, and turbidimetric methods. The proposed method can satisfy the requirement of rapid determination of sulfate concentration during WPA production. Because no sophisticated equipment and special reagents are required, the proposed method is simple and inexpensive. Application The feasibility of the proposed method is ascertained by analyzing a set of WPA samples. First, the WPA samples must be diluted with distilled water to a linear response range of 20-360 mg L-1, and the acidity must be adjusted to 0.020-0.100 mol L-1. All measurements of transient absorbance are made in triplicates at least, and the mean value of the absorbance is used to calculate the sulfate concentration by means of the calibration curve. The conventional gravimetric method is used for comparison, and the results are shown in Table 9. As can be observed, the accuracy of the proposed method is satisfactory. When compared with the standard gravimetric method, the deviation of the proposed approach is less than 2.50%. The system is stable, and no baseline drift is observed during extended working periods. The relative standard deviation (n = 12) of the sulfate absorbance peak is less than 1.60%.
Interferences With regard to selectivity, a 240 mg L-1 sulfate standard working solution containing 500 mg L-1 Fe3+, Mg2+, and Al3+ was tested; no interference was observed.
CONCLUSION In summary, the proposed method can be used for effectively determining sulfate concentration in WPA. With an automated spectrophotometric system, the proposed method realizes a fast and accurate sulfate determination. In the proposed method, the analysis speed is significantly improved reaching up to 29 determinations per hour. The advantages of the proposed analysis method include a high degree of accuracy, great flexibility, and excellent repeatability, and the use of discrete precipitation ensures convenient operation. Moreover, because sophisticated equipment and special reagents are unnecessary, the proposed method is simple and inexpensive. Although manual methods for sulfate determination are simple, they are time consuming because they require complicated sample preparations. Therefore, the proposed method can be considered as an effective alternative for sulfate concentration determination in WPA.
ACKNOWLEDGMENTS This study is supported by the National High Technology Research and Development Program of China (Grant no. 2011AA06A106).
REFERENCES 1. Norwood, V. M.; Kohler, J. J.; Nutr. Cycling Agroecosyst. 1991, 30, 61. 2. Roy, A.; Das, B. K.; Bhattacharya, J.; Mine Water Environ. 2011, 30, 169. 3. Sahinkaya, S.; Sevimli, M. F.; J. Ind. Eng. Chem. 2013, 19, 197. 4. Santelli, R. E.; Lopes, P. R. S.; Santelli, R. C. L.; Wagener, A. L. R.; Anal. Chim. Acta 1995, 300, 149. 5. Swaroop, A.; Clin. Chim. Acta 1973, 46, 333. 6. BingÖl, D.; Aydoğan, S.; Bozbas, S. K.; J. Ind. Eng. Chem. 2012, 18, 834. 7. Morais, I. P. A.; Tóth, I. V.; Rangel, A. O. S. S.; Spectrosc. Lett. 2006, 39, 547. 8. Albendín, G.; Mánuel-Vez, M. P.; Moreno, C.; García-Vargas, M.; Talanta 2003, 60, 425. 9. Tzanavaras, P. D.; Themelis, D. G.; Economou, A.; Thedoridis, G.; Talanta 2002, 57, 575. 10. Grudpan, K.; Hartwell, S. K.; Lapanantnoppakhun, S.; Mckelvie, I.; Anal. Methods 2010, 2, 1651. 11. Esmadi, F. T.; Kharoaf, M. A.; Attiyat, A. S.; Talanta 1990, 37, 1123. 12. Beauchemin, D.; Specht, A. A.; Anal. Chem. 1997, 69, 3183. 13. Pojanagaroon, T.; Watanesk, S.; Rattanaphani, V.; Liawrungrath, S.; Talanta 2002, 58, 1293. 14. Van Staden, J. F.; Anal. Chem. 1987, 326, 754. 15. Dos Santos, W. T. P.; Gimenes, D. T.; Richter, E. M.; Angnes, L.; Quim. Nova 2011, 34, 1753. 16. Brienza, S. M. B.; Krug, F. J.; Gomes Neto, J. A.; Nogueira, A. R. A.; Zagatto, E. A. G.; J. Flow Injection Anal. 1993, 10, 187. 17. Krug, F. J.; Bergamin Filho, H.; Zagatto, E. A. G.; Jørgensen, S. S.; Analyst 1977, 102, 503. 18. Brienza, S. M. B.; Sartini, R. P.; Gomes Neto, J. A.; Zagatto, E. A. G.; Anal. Chim. Acta 1995, 308, 269. 19. Morais, I. P. A.; Souto, M. R. S.; Lopes, T. I. M. S.; Rangel, A. O. S. S.; Water Res. 2003, 37, 4243. 20. Krug, F. J.; Zagatto, E. A. G.; Reis, B. F.; Bahia Filho, O.; Jacintho, A. O.; Jørgensen, S. S.; Anal. Chim. Acta 1983, 145, 179. 21. Kassab, N. M.; Amaral, M. S.; Singh, A. K.; Santoro, M. I. R. M.; Quim. Nova 2010, 33, 968. 22. Peeplwal, A.; Vyawahare, S. D.; Bonde, C. G.; Anal. Methods 2010, 2, 1756. 23. Da Silva, A. A.; De Keukeleire, D.; Cardoso, D. R.; Franco, D. W.; Anal. Methods 2012, 4, 642. 24. Sahin, S.; Sarıburun, E.; Demir, C.; Anal. Methods 2009, 1, 208. 25. Misra, P. K.; Panigrahi, S.; Somasundaran, P.; Int. J. Miner. Process. 2006, 80, 229. 26. Prada, S. M.; Guekezian, M.; Suárez-Iha, M. E. V.; Anal. Chim. Acta 1996, 329, 197. 27. Jia, Z.; Liu, Z.; He, F.; J. Colloid Interface Sci. 2003, 266, 322. 28. Růžička, J.; Hansen, E. H.; Anal. Chim. Acta 1978, 99, 37. 29. Penteado, J. C.; Angnes, L.; Masini, J. C.; J. Chem. Educ. 2005, 82, 1074. 30. Baban, S.; Beetlestone, D.; Betteridge, D.; Sweet, P.; Anal. Chim. Acta 1980, 114, 319. 31. Oviedo, C.; Rodríguez, J.; Quim. Nova 2003, 26, 901. |
On-line version ISSN 1678-7064 Printed version ISSN 0100-4042
Qu�mica Nova
Publica��es da Sociedade Brasileira de Qu�mica
Caixa Postal: 26037
05513-970 S�o Paulo - SP
Tel/Fax: +55.11.3032.2299/+55.11.3814.3602
Free access


