Nota Técnica
| Grape juice quality control by means of 1H NMR spectroscopy and chemometric analyses |
|
Caroline Werner Pereira da Silva Grandizoli#; Francinete Ramos Campos#; Fabio Simonelli#; Andersson Barison*,#
Departamento de Química, Universidade Federal do Paraná, CP 19081, 81530-900 Curitiba - PR, Brasil Recebido em 17/12/2013 *e-mail: andernmr@ufpr.br This work shows the application of 1H NMR spectroscopy and chemometrics for quality control of grape juice. A wide range of quality assurance parameters were assessed by single 1H NMR experiments acquired directly from juice. The investigation revealed that conditions and time of storage should be revised and indicated on all labels. The sterilization process of homemade grape juices was efficient, making it possible to store them for long periods without additives. Furthermore, chemometric analysis classified the best commercial grape juices to be similar to homemade grape juices, indicating that this approach can be used to determine the authenticity after adulteration. INTRODUCTION Grape juice is a nutritious beverage and an important natural source of flavonoids and phenolic compounds1 that may reduce occurrence of several chronic diseases such as cancer and arthritis, and free radical formation.1,2 Similar to red wine, grape juice has a vasodilator effect that protects against coronary disease without the negative impacts of the alcohol (i.e., ethanol). Thus, grape juice can be consumed by children and individuals with hypertension or diabetes3 as a source of polyphenols for abstemious individuals. Furthermore, grape juice provides sufficient amounts of absorbable trans-resveratrol, thereby reducing the risk of atherosclerosis and eliminating the need for additional sources of polyphenols.4 Since grape juice consumption is significantly increasing around the world,5,6 development of analytical approaches for assess the quality of grape beverages are essential for guaranteeing their healthfulness and authenticity. Most studies of grape juice described in the literature have focused on determining its chemical composition.6-11 Only a few studies have been dedicated to grape juice quality control such as evaluating integral, sweetened, and reprocessed juices, or evaluating nectars and beverages using physicochemical, HPLC, GC, and atomic absorption methods in association with multivariate analyses.6 A study evaluated soluble solids, pH, vitamin C content, and levels of reducing, non-reducing and total sugars for three different Brazilian brands.12 Other study evaluated the influence of cultivars in the composition of homemade grape juice.13 Research efforts have also focused on assessing the relationship between cultivars and flavor characteristics6 and organic acids content that are directly associated to quality, authenticity, and biological process of grape juices and wines,14 and contamination by ochratoxin A.15,16 The traditional methods employed for the quality control of beverages are quite tedious, time- and chemical-consuming as well as involve several sample pre-treatment steps to isolate the compounds under investigation. Because there is a need for chemical standards, increased efforts have been directed toward the development of more rapid, precise, and informative analytical methods that permit direct investigation of foods and beverages without isolation and/or purification processes that alter the nature of the sample or result in the loss and/or dilution of compounds. In this way, NMR-based methods are recognized as versatile analytical tools for quality control assessment of foods and beverages, and have the advantage of simultaneously detecting all compounds in a single NMR experiment acquired directly from the sample. For example, a simple 1H NMR spectrum can provide both qualitative and quantitative information about the sample under investigation. In recent years, NMR-based methods have been applied to characterize many food and beverage, including olive oil,17-19 fruit juices,20-23 coffee,24,25 wine26,27 and beer.28-30 Some applications include assessment of malic and lactic acid levels during the fermentation of grapes,31 changes in the chemical composition of mango during ripening,22 spoilage and the microbial contamination of mango juices,32 cultivar discrimination based on metabolic profile of mango juices,33 fermentation process of sorghum34 and identification and quantification of chemical compounds in vinegars.35 Moreover, NMR-based methods, combined with multivariate analyses (chemometric), have successfully been used for the quality control of foods and beverages, including authenticity determination of grape,8,9 orange and cherry juices,22,36 coffee24 and olive oil,37,38 and determination of geographical origins of red wines,27 olive oil,39-41 coffee24 and wheat flour.27,42 Furthermore, these methods have been employed to discriminate different apple varieties used in apple juice production21 and to discriminate sugarcane according to cultivar.43 Another study that shows the great potential of NMR-based methods combined with chemometrics is the in vitro anti-TNFa activity screening that was performed for different grape and berry types.44 The aim of this work was to develop an NMR-based method for quality control assessment of both commercial and homemade grape juices by directly analyzing the juice without any sample pre-treatment.
EXPERIMENTAL Samples Commercial grape juice samples from different regions were purchased from local markets and classified into four groups based on addition of sucrose (i.e., sweetened) and/or preservatives. Homemade grape juice samples, without addition of sugar or preservatives, were obtained directly from producers in Curitiba, Brazil. According to the producers, the bottles and stoppers used for grape juice storage were previously sterilized in boiling water. Following the sterilization step, the fresh juice was immediately transferred into the hot bottles, which were then closed and stored at room temperature. The whole process was performed over a stove to maintain an ascendant hot-air flow, and avoid contamination by microorganisms. As the contents of closed hot bottles began to cool, the bottles were sealed owing to a reduction in internal pressure. NMR analyses of all grape juices were performed immediately after the bottles had been opened. Then, samples were separated into two groups: one group was stored at room temperature, while the other was stored under refrigeration. Every three days-storage new NMR analyses were collected for 15 days. Moreover, fresh homemade grape juices were stored at room temperature for 5 months and every month some bottles were submitted for NMR analyses. NMR analyses The 1H NMR spectra of grape juices were acquired at 295 K on a Bruker AVANCE 400 NMR spectrometer, operating at 9.4 T, observing 1H at 400.13 MHz, which was equipped with a 5-mm multinuclear direct detection probe. Aliquots of 0.6 mL were sampled and filtered through a cotton plug directly into NMR tubes. On the other hand, homemade juices required vacuum filtration prior to adding them to the NMR tubes. Next, three drops of a D2O solution containing 0.1% 2,2,3,3-tetradeuterium-3-(trimethylsilyl)propionic acid sodium salt (TMSP-d4) were added for the NMR chemical shift reference and spectrometer lock. The 1H NMR spectra were recorded with water signal suppression by selective low-power irradiation at H2O resonance frequency during the relaxation delay using Bruker zgpr pulse sequence. Each NMR spectrum was acquired with 90º pulse excitation, 128 scans, 64K data points distributed in a spectral width 3634 Hz (~ 9.0 ppm), providing a digital resolution of 0.12 Hz, 7.0 s acquisition time, and 1.0 s recycle delay. The free induction decays (FIDs) were multiplied by a factor of 0.3 Hz prior to Fourier transform with aid of Bruker TopSpin software. All 1H NMR chemical shifts are given in ppm (δ) related to TMSP-d4 signal at 0.00 ppm as internal reference. The assignments of the signals in the 1H NMR spectra were performed by comparison with reported data22,32 and with aid of 1H-1H NMR correlation maps from COSY NMR experiments, which were acquired using the DQF-COSY pulse sequence with a spectral width 4400 Hz (~11.0 ppm) in both dimensions, resulting in 4K data points and 16 transients in t2 per each of 256 increments in t1. Chemometric analyses Principal components analyses (PCA) were performed over 1H NMR spectra. Initially, the spectra were binned into continuous buckets 0.05 ppm width between 0.5 and 9.00 ppm, thereby resulting in 170 NMR variables. The area under each bucket was determined by the special integration mode in Bruker AMIX software.30 However, only segments between 1.5 and 3.0 ppm were used in the PCA. Therefore, the final number of NMR buckets (i.e., variables) considered in PCA was 30. Bucketing method permits the spectra complexity reduction (i.e., data points), thereby generating a more manageable data set. For example, a 1H NMR spectrum acquired with 65,536 data points distributed over a spectral width of 10 ppm can be reduced to 200 buckets of 0.05 ppm width. This approach has the advantage of eliminating the need for phase and baseline corrections, and minimizing drifts in the 1H NMR chemical shifts due to differences in pH or concentration.31 The segment areas were then normalized and scaled to the total spectrum area.
RESULTS AND DISCUSSION The presence of ethanol in grape juice samples is indicative of the fermentation process caused by microorganisms, which is a consequence of either inefficient sterilization in raw production or later contamination. Moreover, high ethanol contents can be harmful to abstemious individuals. Therefore, in this work, commercial and homemade grape juices were initially evaluated for the presence of ethanol by means of 1H NMR spectroscopy. Note that the samples were obtained directly without any pre-treatment. The commercial samples were divided into four groups based on the varying levels of sucrose (sweetened) additive and/or preservatives to evaluate its influences on the fermentative process. Homemade samples had no added sucrose or preservatives. Most of 1H NMR spectra from commercial samples showed a triplet at 1.18 ppm (Figure 1) from methyl group of ethanol. High ethanol contents were observed mainly in those with addition of sucrose (sweetened) and without preservatives. This finding is the first indication that sugar (as an additive) from sugarcane (i.e., sucrose) promotes the fermentative process in grape juices. However, sweetened ones with preservatives showed lower ethanol contents, while ethanol was either insignificant or undetectable in unsweetened with preservatives. This indicates that preservatives can minimize fermentation in grape juice, and suggests that the fermentative process starts during the raw production stage due to microbial contamination before bottles are sealed or properly sterilized. These hypotheses were supported by the investigation of a commercial grape juice (sweetened and without preservatives) that showed higher ethanol contents in all the evaluated samples. High ethanol content, in some grape juice brands, may be due to in Brazil they are made in same facilities as wine, in which the fermentative process requires microorganisms. Therefore, addition of preservatives should be a standard practice, at least for sweetened grape juices.
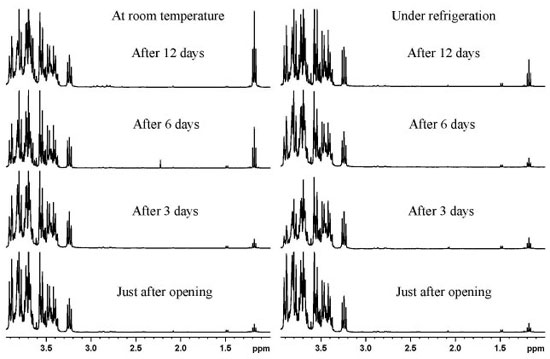 Figure 1. Representative 1H NMR spectra (3.85-1.0 ppm) showing ethanol production in a commercial grape juice brand with addition of sucrose without preservatives under refrigeration or at room temperature (∼20 ºC)
Instructions on the labels of commercial grape juice bottles distributed throughout Brazil revealed a lack of standardization regarding optimal storage conditions and duration of product viability after opening of the bottles. Labels, from brand to brand, reported considerably different optimal storage times that ranged from 5 to 15 days. Moreover, 40% of the commercial brands did not mention storage time, and few brands recommended refrigeration after opening the bottles. Therefore, ethanol production was evaluated by 1H NMR spectroscopy according to sample storage time and conditions. After the bottles were first opened, samples were stored either at room temperature or under refrigeration for 15 days to evaluate the influence of high temperatures on the fermentative process. A significant increase in ethanol content was observed in commercial samples stored at room temperature after 6 days, whereas those kept under refrigeration had an insignificant increase after 12 days (Figure 1). This result supports that warmer temperatures enhance the fermentative process in grape juices. The highest increment in ethanol content was observed in sweetened juices without preservatives, indicating that addition of sucrose enhances fermentation in grape juices. This finding is supported by a decrease of sucrose signals (doublets at 4.21 and 5.41 ppm)21 with a simultaneous increase in ethanol signal (triplet at 1.18 ppm) during storage (Figure 2). On the other hand, grape juice samples with no sucrose added showed no significant ethanol production during storage, either at room temperature or under refrigeration. Furthermore, sweetened and unsweetened juices with preservatives showed lower ethanol production than those without preservatives. A decrease in the signal of fructose (doublet at 4.11 ppm), a natural sugar in grapes, was also observed, which demonstrates that the fermentative process is slower without sucrose addition (Figure 2). These findings indicate that storage times for opened grape juice bottles need to be reduced. Recommendations for storing grape juices under refrigeration should be consistent, especially for sweetened ones.
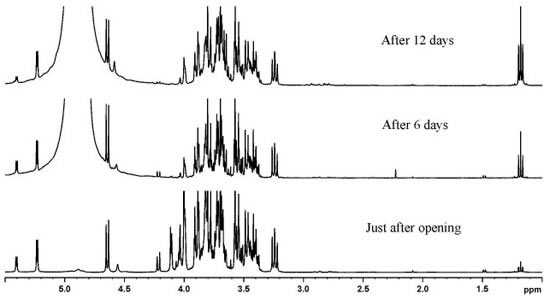 Figure 2. Representative 1H NMR spectra showing ethanol production (triplet at 1.18 ppm) with the consequent sucrose consumption (doublets at 4.21 and 5.41 ppm) in sweetened commercial grape juice. In the bottom spectrum, the H2O signal was eliminated by zgpr pulse sequence to allow a better visualization of the sucrose signals
In southern Brazil, the consumption of grape juice is considerable, and many traditional families make their own grape juice during harvest season and store it for the year. Therefore, homemade grape juices were evaluated for ethanol production by 1H NMR spectra during storage, prior to opening the bottles at room temperature, and under refrigeration after opening the bottles. The 1H NMR spectra of unopened homemade grape juices stored for five months at room temperature revealed no increase in ethanol content (Figure 3). After the bottles had been opened, homemade juice samples were stored under refrigeration for 15 days, similar to commercial ones. The 1H NMR analysis showed no increase in ethanol content during storage time. When homemade grape juices were compared to commercial samples without addition of sucrose and preservatives, the intensification of the ethanol signal in the 1H NMR spectra was observed for commercial juices but not for homemade juices (Figure 4). This shows that the sterilization process of homemade grape juice, as described in the experimental section, is very efficient in comparison with the industrial method. Therefore, it is possible to store homemade grape juices for a long time prior to consumption, both before and after the bottles are opened. These observations support the hypothesis of possible yeast contamination during production of commercial grape juices and/or failures in sterilization process.
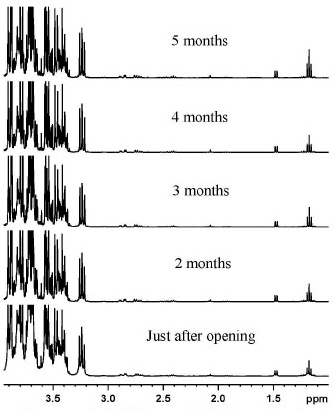 Figure 3. Representative 1H NMR spectra (3.85-1.00 ppm) showing ethanol production in homemade grape juice at room temperature
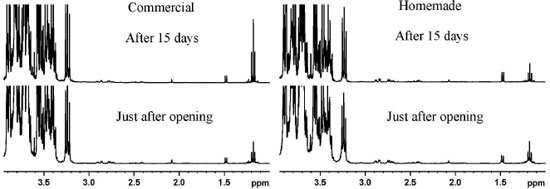 Figure 4. 1H NMR spectra for commercial and homemade grape juices just after the bottles had been opened and 15-day after storage time
The 1H NMR analyses allowed also to verify the occurrence of acetic fermentation in commercial and homemade grape juices, through acetate signal (singlet at 2.07 ppm). When the bottles were first opened, acetate content was very low in both commercial and homemade samples. No increase in acetate signal was observed during storage time, regardless of storage conditions. A slight increase was observed after several months of storage for one sample that was considerably manipulated (the bottle was repeatedly opened and closed). Thus, this result is likely due to contamination with acetic bacteria. The amino acid alanine was present in all grape juices investigated, as evidenced by the doublet at 1.48 ppm in the 1H NMR spectra. However, a high alanine concentration was found in a commercial brand. According to Gil and others,22 the fruit ripening process is accompanied by a significant increase in alanine content relative to the total sugar content. In that case, grapes in an advanced ripening stage may produce the specific juice. The 1H NMR spectra was also able to identify some inconsistencies between the chemical composition of some commercial grape juices brands and those provided in their respective labels. The first inconsistency was related to addition of citric acid as an acidifier. Only one of the commercial brands stated the presence of citric acid on the label (Figure 5, A). However, this substance was found in the 1H NMR spectra by the doublets at 2.77 and 2.96 ppm in other brands (Figure 5, B and C). This is evident by comparing their 1H NMR spectra with that from a homemade juice sample, in which only the malic acid signals (double doublets at 2.72 and 2.87 ppm), a natural compound from grapes, are observed (Figure 5, D).
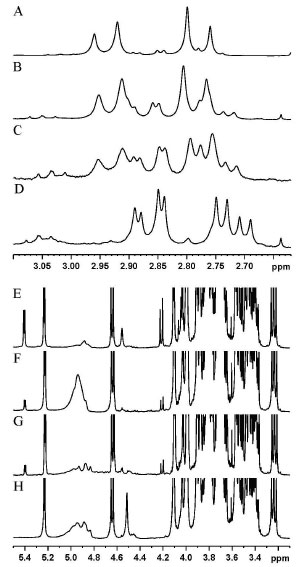 Figure 5. Representative 1H NMR spectra showing the inconsistencies between chemical compositions and the information provided on labels of commercial grape juices. A-D, Citric acid detection in samples B and C (with no specification of citric acid addition on the labels) in comparison with acidified commercial (A) and homemade (D) samples. E-H, Sucrose detection in samples F and G (specified as unsweetened on the labels) in comparison with sweetened commercial (E) and homemade (H) samples
The second inconsistency was the addition of sugar from sugarcane (i.e., sucrose), which carried the specification of "unsweetened" on the labels of some juices. However, the 1H NMR spectra of some samples (Figure 5, F and G) showed sucrose signals (doublets at 4.21 and 5.41 ppm), which were not present in homemade juices (Figure 5, H). A third inconsistency was related to the presence of preservatives. The presence of sodium benzoate was detected by the multiplets at 7.51-7.55, 7.66-7.70, and 8.01-8.04 ppm in their 1H NMR spectra, particularly in commercial brands whose labels specified absence of preservatives. Chemometric analyses Chemometric analyses have the advantage of considering all variables together and show high-correlation variables in few new components. Therefore, PCA was applied to 1H NMR spectra to reduce the number of variables (i.e., data points) without any information loss and to establish which samples had similar properties. Moreover, the results can be graphically represented with clear visualize patterns. The PCA was performed in the 1.5-3.0 ppm region of the 1H NMR spectra, corresponding to amino acid and acetate signals. This region was chosen because amino acids best represent the authenticity of grape juices, whereas any adulteration would introduce changes in their 1H NMR profile. Moreover, this region is free of intentional alterations, such as addition of sucrose and preservatives, or ethanol, which results only from the fermentation process and has no relationship with grape juice authenticity. PCA had allocated the two best commercial grape juices evaluated by consumers closer to those homemade (natural) than the others (Figure 6). This result shows that 1H NMR allied to chemometric analyses could be a useful tool for verifying the authenticity of commercial grape juices. Moreover, adulterations such as dilution will modify the composition, and a classification model can be developed to recognize authentic grape juices.
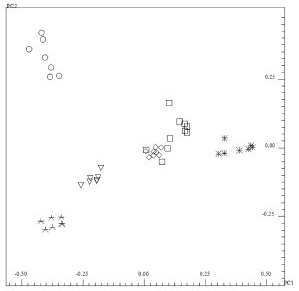 Figure 6. PC1 (64.61%) versus PC2 (20.45%) scores plot of the chemometric analysis over 1H NMR spectra of grape juice, showing in PC1 the similarity between the commercial (▽, ○, *, □ and ◊) and the homemade (*) grape juice samples
CONCLUSIONS This investigation showed that 1H NMR spectroscopy combined with chemometric, can be a valuable tool for quality control of grape juices, and it most likely could become a high-throughput push-button NMR tool. The main advantage is that the 1H NMR spectra can be easily obtained directly from the samples without the need for sample pre-treatment, making it possible to examine the entire spectrum and search for patterns emerging from the data.
ACKNOWLEDGMENTS The authors are grateful to CNPq, CAPES, Finep, Fundação Araucária and the UFPR for financial support and fellowships. We also thank E. P. Wendler and A. M. de Oliveira for providing homemade grape juices and Bruker Biospin for supplying the Amix software.
REFERENCES 1. O'Byrne, D. J.; Devaraj, S.; Grundy, S. M.; Jialal, I.; Am. J. Clin. Nutr. 2002, 76, 1367. 2. Rice-Evans, C. A.; Miller, N. J.; Paganda, G.; Free Radic. Biol. Med. 1996, 20, 933. 3. Coimbra, S. R.; Lage, S. H; Brandizzi, L.; Yoshida, V.; Luz, P. L.; Braz. J. Med. Biol. Res. 2005, 38, 1339. 4. Pace-Asciak, C. R.; Rounova, O; Hahn, S. E.; Diamandis, E. P. Goldberg, D.; M. Clin. Chim. Acta 1996, 246, 163. 5. Camargo, U. A.; Tonietto, J.; Hoffmann, A.; Rev. Bras. Frutic. 2011, E, 144-149. 6. Rizzon, L. A.; Miele, A.; Ciênc. Tecnol. Aliment. 2012, 32, 93. 7. Morgano, M. A.; Queiróz, S. C. N.; Ferreira, M. M. C.; Ciênc. Tecnol. Aliment. 1999, 19, 344. 8. Gil, A. M.; Duarte, I. F.; Godejohann, M.; Braumann, U.; Maraschin, M.; Spraul, M.; Anal. Chim. Acta 2003, 488, 35. 9. Gil, A. M.; Duarte, I.; Cabrita, E.; Goodfellow, B. J.; Spraul, M.; Kerssebaum, R.; Anal. Chim. Acta 2004, 506, 215. 10. Malacrida, C. R.; Motta, S.; Ciênc. Tecnol. Aliment. 2005, 25, 659. 11. Sautter, C. K.; Denardin, S.; Alve, A. O.; Mallmann, C. A.; Penna N. G.; Hecktheuer, L. H.; Ciênc. Tecnol. Aliment. 2005, 25, 437. 12. Santana, M. T. A.; Siqueira, H. H.; Reis, K. C.; Lima, L. C. O.; Silva, R. J. L.; Ciênc. Agrotec. 2008, 32, 882. 13. Rizzon, L. A.; Link, M.; Ciênc. Rural 2006, 36, 689. 14. Mato, I.; Suárez-Luque, S.; Huidobro, J. F.; Food Res. Int. 2005, 38, 1175. 15. Shundo, L.; Almeida, A. P.; Alaburda, J.; Ruvieri, V.; Navas, S. A.; Lamardo, L. C. A.; Sabino, M.; Braz. J. Microbiol. 2006, 37, 533. 16. Varga, J.; Kozakiewicz, Z.; Trends Food Sci. Technol. 2006, 17, 72. 17. Sacchi, R.; Addeo, F.; Paolillo, L.; Magn. Reson. Chem. 1997, 35, S133. 18. Sacchi, R.; Mannina, L.; Fiordoponti, P.; Barone, P.; Paolillo, L.; Patumi, M.; Segre, A.; J. Agric. Food Chem. 1998, 46, 3947. 19. Mannina, L.; Patumi, M.; Proietti, N.; Bassi, D.; Segre, A.; J. Agric. Food Chem. 2001, 49, 2687. 20. Belton, P. S.; Delgadillo, I.; Gil, A. M.; Roma, F.; Colquhoun, M.; Dennis, M.; Spraul, M.; Magn. Reson. Chem. 1997, 35, S52. 21. Belton, P. S.; Colquhoun, I. J.; Kemsley, K.; Delgadillo, I.; Roma, P.; Dennis, M. J.; Sharman, M.; Holmes, E.; Nicholson, J. K.; Spraul, M.; Food Chem. 1998, 61, 207. 22. Gil, A.M.; Duarte, I. F.; Delgadillo, I.; Colquhoun, I. J.; Casuscelli, F.; Humpfer, E.; Spraul, M.; J. Agric. Food Chem. 2000, 48, 1524. 23. Le Gall, G.; Puaud, M.; Colquhoun, I. J.; J. Agric. Food Chem. 2001, 49, 580. 24. Charlton, A. J.; Farrington, W. H. H.; Brereton, P.; J. Agric. Food Chem. 2002, 50, 3098. 25. Wei, F.; Furihata, K.; Koda, M.; Hu, F.; Miyakawa, T.; Tanokura, M.; J. Agric. Food Chem. 2012, 60, 1005. 26. Kosir, I. J.; Kidric, J.; J. Agric. Food Chem. 2001, 49, 50. 27. Brescia, M. A.; Caldarola, V.; De Giglio, A.; Benedetti, D.; Fanizzi, F. P.; Sacco, A.; Anal. Chim. Acta. 2002, 458, 177. 28. Duarte, I.; Barros, A.; Belton, P. S.; Righelato, R.; Spraul, M.; Humpfer, E.; Gil, A. M.; J. Agric. Food Chem. 2002, 50, 2475. 29. Duarte, I.; Barros, A.; Almeida, C.; Spraul, A. M.; J. Agric. Food Chem. 2004, 52, 1031. 30. Spraul, M.; Humpfer, E.; Keller, S.; Schafer, H.; Spin Report (Bruker) 2004, 154/155, 26. 31. Avenoza, A.; Busto, J. H.; Canal, N.; Peregrina, J. P.; J. Agric. Food Chem. 2006, 54, 4715. 32. Duarte, I. F.; Delgadillo, I.; Gil, A. M.; Food Chem. 2006, 96, 313. 33. Koda, M.; Furihata, K.; Wei, F.; Miyakawa, T.; Tanokura, M.; J. Agric. Food Chem. 2012, 60, 1158. 34. Caligiani, A.; Acquotti, D.; Palla, G.; Bocchi, V.; Anal. Chim. Acta 2007, 585, 110. 35. Vogels, J. T. W. E.; Terwel, L.; Tas, A. C.; Van Den Berg, F.; Dukel, F.; Van Der Greef, J.; J. Agric. Food Chem. 1996, 44, 175. 36. Clausen, M. R.; Pedersen, B. H.; Bertram, H. C.; Kidmose, U.; J. Agric. Food Chem. 2011, 59, 12124. 37. Fauhl, C.; Reniero, F.; Guillou, C.; Magn. Reson. Chem. 2000, 38, 436. 38. Vigli, G.; Philippidis, A.; Spyros, A.; Dais, P.; J. Agric. Food. Chem. 2003, 51, 5715. 39. Zamora, R.; Gómez, G.; Dobargenes, C.; Hidalgo, F. J.; J. Am. Oil Chem. Soc. 2002, 79, 261. 40. Zamora, R.; Gómez, G.; Hidalgo, F. J.; J. Am. Oil Chem. Soc. 2002, 79, 267. 41. Vlahov, G.; Del Re, P.; Simone, N.; J. Agric. Food Chem. 2003, 51, 5612. 42. Sacco, A.; Bolsi, I. N.; Massini, R.; Spraul, M.; Humpfer, E.; Ghelli, S.; J. Agric. Food Chem. 1998, 46, 4242. 43. Alves Filho, E. G.; Silva, L. M. A.; Choze, R. Lião, L. M.; Honda, N. K.; Alcantara, G. B.; J. Braz. Chem. Soc. 2012, 23, 273. 44. Ali, K.; Iqbal, M.; Korthout, H. A. A. J.; Maltese, F.; Fortes, A. M.; Pais, M. S.; Verpoorte, R.; Choi, Y. H.; Metabolomics 2012, 8, 1148. |
On-line version ISSN 1678-7064 Printed version ISSN 0100-4042
Qu�mica Nova
Publica��es da Sociedade Brasileira de Qu�mica
Caixa Postal: 26037
05513-970 S�o Paulo - SP
Tel/Fax: +55.11.3032.2299/+55.11.3814.3602
Free access


