Artigo
| Fe3+-selective enhanced fluorescence probe based on a rhodamine derivative |
|
Yongjun Lv
College of Material and Chemical Engineering, Sichuan University of Science and Engineering, Zigong, 643000, China Recebido em 09/05/2015 *e-mail: yongjunlv@qq.com A novel Fe3+-selective and turn-on fluorescent probe 1 incorporating a rhodamine fluorophore and quinoline subunit was synthesized. Probe 1 displayed high selectivity for Fe3+ in CH3CN-H2O (95:5 v/v) in the presence of other relevant metal cations. Interaction with Fe3+ in 1:1 stoichiometry could trigger a significant fluorescence enhancement due to the formation of the ring-open form. The fluorescent response images were investigated by a novel Euclidean distance method based on red, green, and blue values. A linear relationship was observed between fluorescence intensity changes and Fe3+ concentrations from 7.3 x 10⁻⁷ to 3.6 x 10⁻⁵ mol L-1. INTRODUCTION Iron is an essential metal that plays crucial roles from the core of the earth to animal living organisms.1 Either its deficiency or excess closely coincides with human health such as the prevention of certain diseases, the disturbances of glucose levels and the promote oxidation of lipids and proteins.2,3 In addition, iron deficiency chlorosis is a great matter of concern in agriculture.4 Thus, numerous conventional methods have been developed for the determination of Fe3+, such as voltammetry,5 atomic absorption spectroscopy,6 and flow injection spectroscopy.7,8 These standard techniques usually require complicated pretreatment procedures and necessitate the destruction of the sample. Thus, in recent years, fluorescent Fe3+ probes have attracted burgeoning interest mainly due to their sensitivity and non-destructive property.9-12 In general, the Fe3+ fluorescent probe displays fluorescence quenching owing to the paramagnetic nature of Fe3+.13 As an alternative, fluorescent "turn-on" probes have stimulated active research. Consequently, the rhodamine frame work is an ideal candidate because of their simplicity and excellent spectroscopic properties.14 Particularly, it undergoes non-fluorescent spirocyclic ("off" signal) and strongly fluorescent ring-open amide form ("on" signal). Heretofore, numerous rhodamine-based probes for Fe3+ have been reported.15-19 As an effort for achieving more excellent fluorescent probes for Fe3+, we herein designed and synthesized a new rhodamine derivative 1, with rhodamine B as the fluorophore and hydroxyquinoline as the ion acceptor. Apart from the typical fluorescence analysis, Euclidean Distance analytical method was also ingeniously introduced to study Fe3+ sensing properties in this paper. As results demonstrated, 1 suggested a selective enhanced fluorescent response to Fe3+ over other tested metal cations in CH3CN-H2O (95:5 v/v) solution.
EXPERIMENTAL Materials All reagents were purchased from commercial suppliers and used without further purification. Rhodamine B and 8-Hydroxyquinoline-2-carboxaldehyde were purchased from Alfa-Aesar. All metal salts were obtained from shanghai Chemical Reagent Corporation (Shanghai, China). Chromatographic CH3CN and de-ionized H2O were used throughout the experiments. The stock solutions (1 × 10⁻⁴ mol L-1) of the perchlorate salts of Ba2+, Cu2+, Ni2+, Mg2+, Ca2+, Na+, the nitrate salts of Pb2+, Ag+ and chloride salts of Fe3+,Co2+, Zn2+, Fe2+, Hg2+ in CH3CN were prepared, respectively. The solution (2 × 10⁻⁶ mol L-1) of compound 1 was prepared in CH3CN and then diluted by H2O to obtain aqueous solution CH3CN-H2O (95:5 v/v) of 1 (1 × 10⁻⁶ mol L-1). The fluorescence spectra were recorded on Perkin Elmer LS-55 spectrofluorometer. 1H NMR and 13C NMR spectra were determined on Varian INOVA spectrometer in CDCl3. IR spectra were performed with a Bruker Tensor 27 FT-IR spectrometer. ESI-MS were obtained using a Waters Micromass ZQ-4000 spectrometer. C, H, N elemental analysis was made on a Vario-EL. Under the UV lamb at 365 nm lighting, the fluorescence images were acquired before and after exposure of Fe3+ at different concentrations. The digital red (R), green (G), and blue (B) values were then subtracted to calculate the Euclidean Distance (ED) by the formula (1):20  Synthesis of probe 1 Rhodamine hydrazide (0.46 g, 1 mmol)21 was dissolved in ethanol (20 mL), 8-Hydroxyquinolin-2-carboxaldehyde (0.17 g, 1 mmol) in ethanol (10 mL) was added dropwise (Scheme 1). The mixture was refluxed in an oil bath overnight and then cooled to room temperature. The yellowish color precipitate obtained was filtered and washed by cold ethanol (3 × 10 mL). After drying under reduced pressure, the reaction afforded yellowish solid 1 0.31 g. Yield: 50%; m.p. 290 ºC. Its structure was characterized by IR, NMR, ESI-MS, and elemental analysis (Figure 1S - Figure 4S, supporting information). IR (KBr, cm-1): 3413 cm-1 (-OH), 1724 cm-1 (-C=O), 1697 cm-1 (-C=N-), 1613 cm-1 and 1513 cm-1 (-C=C-); 1H NMR (400 MHz, CDCl3, δ / ppm): 1.15 (12H, t, J = 6.8 Hz, -CH2-CH3), 3.35 (8H, q, J = 6.8 Hz, -CH2-CH3), 6.25 (2H, d, J = 7.6 Hz), 6.53 (4H, m), 7.09 (2H, d, J = 7.6 Hz), 7.16 (2H, d, J = 7.2 Hz), 7.24 (2H, d, J = 8.4 Hz),7.37 (1H, t, -N=CH-), 7.51 (2H, m), 8.04 (4H, m), 8.63 (1H, s, -OH). 13C NMR (100 MHz, CDCl3, δ / ppm): 12.63, 44.35, 66.18, 98.09, 105.69, 108.12, 110.05, 117.72, 118.82, 123.66, 124.00, 127.89, 128.09, 128.41, 133.84, 135.86, 137.54, 149.10, 152.19, 153.17, 165.52. ESI-MS: 612.5 (M+H+, 100). Anal. Calcd. For 1 (C38H37N5O3): C, 74.61; H, 6.10; N, 11.45. Found: C, 74.52; H, 6.15; N, 11.48.
 Scheme 1. The synthetic procedure for probe 1
RESULTS AND DISCUSSION Due to its relative insolubility in aqueous media, the metal cation sensing system of probe 1 can only tolerate 5% H2O in CH3CN (v/v) (Figure 5S, supporting information). Figure 1 showed fluorescence spectra of 1 in the absence and the presence of tested metal ions (Fe3+, Cu2+, Co2+, Zn2+, Fe2+, Hg2+, Pb2+, Ag+, Ba2+, Ni2+, Mg2+, Ca2+, Na+) in CH3CN-H2O (95:5 v/v). 1 itself was very weakly fluorescent, indicating the predominant ring-closed spirolactam. Upon addition of 36 equiv. of Fe3+, 1 exhibited approxiamtely 250-fold fluorescence enhancement at 582 nm, refering to the delocalization in the ring-open amide form.22 Correspondingly, pink colour and red fluorescence appeared. In contrast, other metal ions showed negligible change except that Cu2+ led to minor fluorescence response by 10-fold, suggesting the trace ring-open formation.
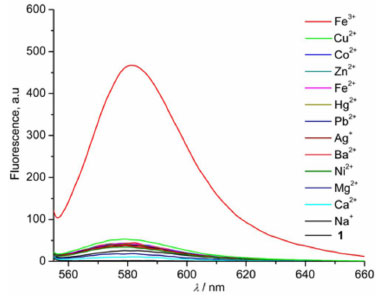 Figure 1. Fluorescence spectra of 1 (1 × 10⁻⁶ mol L-1, λex = 540 nm) in CH3CN-H2O (95:5 v/v) in the presence of various metal ions (3.6 × 10⁻⁵ mol L-1)
Furthermore, fluorescence titration of 1 (1 × 10⁻⁶ mol L-1) with Fe3+ was performed in Figure 2. Upon adding Fe3+, the maximum intensity at 582 nm gradually increased, which indicates the formation of ring-open amide form leading to turn-on fluorescence. Namely the formation of 1-Fe3+ complex might contribute to obvious fluorescence enhancement with emission quantum yield of 0.41 using rhodamine B (Φf = 0.49 in EtOH) as a standard.23 Besides, Job's plot demonstrates a 1:1 binding stoichiometry between 1 and Fe3+ (Figure 2 inset). According to this 1:1 model, the binding constant was calculated to be 8.20 × 10⁴ L mol-1 indicating a strong binding ability of 1 to Fe3+.24
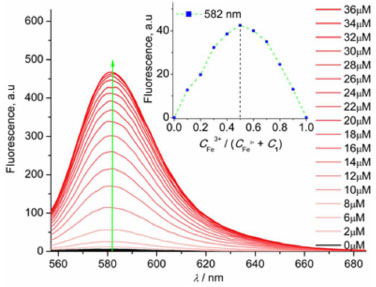 Figure 2. Fluorescence titration of probe 1 (1 × 10⁻⁶ mol L-1, λex = 540 nm) in CH3CN-H2O (95:5 v/v) upon the addition of Fe3+ from 0 to 3.6 × 10⁻⁵ mol L-1. Inset: Job plots of 1 with Fe3+ measured by fluorescence intensity at 582 nm (λex = 540 nm). [1] + [Fe3+] = 1 × 10⁻⁶ mol L-1
Meanwhile we examined the relations between ED values of the fluorescent changes of probe 1 as a function of Fe3+ concentrations. As shown in Figure 3, the ED tracks linearly with increasing Fe3+ concentration from 7.3 × 10⁻⁷ to 3.6 × 10⁻⁵ mol L-1, which generates a linear equation Y = 4.082 × 10⁵C - 0.131 with high coefficient of 0.9994. This monotonic behaviour in the response probably reflects a 1:1 stoichiometry between probe 1 and Fe3+.25 The detection limit could reach the 2.4 × 10⁻⁷ mol L-1 from 3 times signal to noise, which exhibits relative moderate sensitivity compared to other repoeted probes.26-28 This might be due to that ED data are acquired from simple fluorescence images rather than precise spectrofluorometer instrument.29 Among three colour channels, R channel contributed mostly to the total fluorescent response, and the corresponding intensity also displayed a linear response to the Fe3+ solution with the correlation coefficient of 0.9955. Thus, this can be responsible for the observation of red fluorescence of 1-Fe3+ complex by naked eyes. G and B channel did not show many changes relative to R channel. However, in these two channels the relative intensity illustrates a tolerable relationship to the concentration of Fe3+ with the correlation coefficient of 0.8988 and 0.9810, separately. The quantitative determination of Fe3+ is easily achieved by ED response and the concentration of Fe3+ ions. Base on ED data analysis, the control experiment was also carried out and showed in Figure 4. It can be found that the sensing of Fe3+ by probe 1 is hardly influenced by those co-existent metal ions.
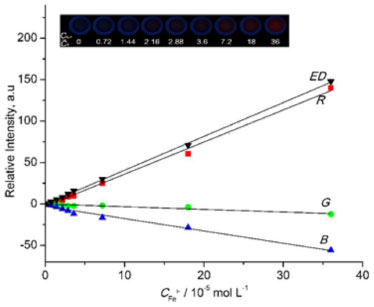 Figure 3. The fluorescence intensity responses of 1 (1 × 10⁻⁶ mol L-1) with the concentrations of Fe3+ from 0 to 3.6 × 10⁻⁵ mol L-1. Inset: The fluorescence images of 1 with various concentrations of Fe3+
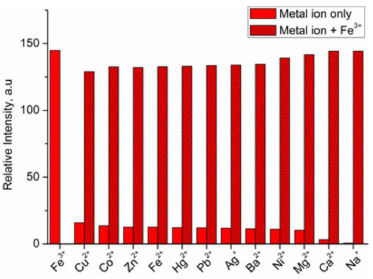 Figure 4. Fluorescence response of 1 upon addition of various metal ions under the absence and presence of background Fe3+ (in the same equivalence of Fe3+) at 582 nm (λex = 540 nm)
Based on above mentioned observations, we can safely propose the most possible binding mode of 1 and Fe3+ in Figure 5. The spirocyclic ring possibly opens to efficiently capture Fe3+, a highly delocalized p-conjugated structure develops and a significant fluorescence enhancement occurs. With this special coordinate mode, involving two O atoms and two sp2 N atoms, only Fe3+ can be allowed to enhance the fluorescence, though the other ions fail, indicating the coordinate moiety of 1 match perfect with Fe3+. This binding behavior can be definitely confirmed by the new peak at m/z = 671.3 for [1 + Fe3+ + 3H]+ instead of the original peak at 612.5 for [1 + H]+ in ESI-MS spectra. By maximizing the binding from 1, the 4-binding mode is consequently suggested.
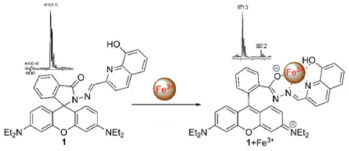 Figure 5. Proposed binding mode and ESI-MS data of probe 1 and Fe3+
CONCLUSIONS In summary, we have developed a novel rhodamine-based probe 1 for Fe3+ over other tested metal ions based on the enhanced fluorescence. 1 exhibits 250-fold fluorescence enhancement intensity in the presence of 36 equiv. of Fe3+, indicating the mild fluorescence response. ED analytical method was successfully employed to perform the relationship fluorometric changes of 1 and the concentration of Fe3+. The future efforts will be focused on the structural modification of rhodamine-based probe in order to elaborate special metal ion sensing applications in completely aqueous system.
SUPPLEMENTARY MATERIAL IR, 1H-NMR, 13C-NMR spectra of probe 1, as well as the evaluation of its fluorescence intensity can be found at http://quimicanova.sbq.org.br, in pdf format with free access.
ACKNOWLEDGEMENTS This work was supported by Scientific Research Fund of Sichuan University of Science and Engineering (No. 2012RC02), Key Laboratories of Fine Chemicals and Surfactants in Sichuan Provincial Universities (No. 2014JXY01) and Sichuan Province Science and Technology Innovation Talent Project (No. 2015026).
REFERENCES 1. Howard, J. B.; Rees, D. C.; Adv. Protein. Chem. 1991, 42, 199. PMID: 1793006 2. Galaris, D.; Skiada, V.; Barbouti, A.; Cancer Lett. 2008, 266, 21. DOI: http://dx.doi.org/10.1016/j.canlet.2008.02.038 PMID: 18374479 3. Que, E. L.; Domaille, D. W.; Chang, C. J.; Chem. Rev. 2008, 108, 1517. DOI: http://dx.doi.org/10.1021/cr078203u PMID: 18426241 4. Zayed, A. M.; Terry, N.; Plant Soil 2003, 249, 139. DOI: http://dx.doi.org/10.1023/A:1022504826342 5. Mudashiru, L. K.; Aplin, A. C.; Horrocks B. R.; Anal. Methods 2011, 3, 927. DOI: http://dx.doi.org/10.1039/c0ay00688b 6. Tautkus, S.; Steponeniene, L.; Kazlauskas, R.; J. Serb. Chem. Soc. 2004, 69, 393. DOI: http://dx.doi.org/10.2298/JSC0405393T 7. Chen, S.; Li, N.; Zhang, X.; Yang, D.; Jiang, H.; Spectrochim. Acta, Part A 2015, 3138, 75. 8. Asan, A.; Andac, M.; Isildak, I.; Chem. Pap. 2010, 64, 424. 9. Huang, D.; Gao, Z.; Yi, H.; Bing, Y.; Niu, C.; Guo, Q.; Lai, C.; Anal. Methods 2015, 7, 353. DOI: http://dx.doi.org/10.1039/C4AY02211D 10. Sui, B.; Tang, S.; Liu, T.; Kim, B.; Belfield, K. D.; ACS Appl. Mater. Interfaces 2014, 6, 18408. DOI: http://dx.doi.org/10.1021/am506262u PMID: 25337695 11. Ge, F.; Ye, H.; Zhang, H.; Zhao, B.; Dyes Pigm. 2013, 99, 661. DOI: http://dx.doi.org/10.1016/j.dyepig.2013.06.024 12. Chen, X.; Hong, H.; Han, R.; Zhang, D.; Ye, Y.; Zhao, Y.; J. Fluoresc. 2012, 22, 789 DOI: http://dx.doi.org/10.1007/s10895-011-1022-0 PMID: 22147022 13. Ma, Y. M.; Hider, R. C.; Bioorg. Med. Chem. 2009, 17, 8093. DOI: http://dx.doi.org/10.1016/j.bmc.2009.09.052 PMID: 19853460 14. Kim, H. N.; Lee, M. H.; Kim, H. J.; Kim, J. S.; Yoon, J.; Chem. Soc. Rev. 2008, 37, 1465. DOI: http://dx.doi.org/10.1039/b802497a PMID: 18648672 15. Xiang, Y.; Tong, A.; Org. Lett. 2006, 8, 1549. DOI: http://dx.doi.org/10.1021/ol060001h PMID: 16597107 16. Hu, Z.; Gu, Y.; Hu, W.; Sun, L.; Zhu, J.; Jiang, Y.; ChemistryOpen 2014, 3, 264. DOI: http://dx.doi.org/10.1002/open.201402065 PMID: 25558445 17. Ji, S.; Meng, X.; Ye, W.; Feng, Y.; Sheng, H.; Cai, Y.; Liu, J.; Zhu, X.; Guo, Q.; Dalton. Trans. 2014, 43, 1583. DOI: http://dx.doi.org/10.1039/C3DT52422A PMID: 24217856 18. Sahoo, S. K.; Sharma, D.; Bera, R. K.; Crisponi, G.; Callan, J. F.; Chem. Soc. Rev. 2012, 41, 7195. DOI: http://dx.doi.org/10.1039/c2cs35152h PMID: 22885471 19. Li, J.; Hu, Q.; Yu, X.; Zeng, Y.; Cao, C.; Liu, X.; Guo, J.; Pan, Z.; J. Fluoresc. 2011, 21, 2005. DOI: http://dx.doi.org/10.1007/s10895-011-0901-8 PMID: 21617999 20. Lin, H.; Suskick K. S.; J. Am. Chem. Soc. 2010, 132, 15519. DOI: http://dx.doi.org/10.1021/ja107419t PMID: 20949933 21. Zhao, M.; Yang, X.; He, S.; Wang, L.; Chem. Pap. 2009, 63, 261. 22. Moon, K. S.; Yang, Y. K.; Ji, S.; Tae, J.; Tetrahedron. Lett. 2010, 51, 3290. DOI: http://dx.doi.org/10.1016/j.tetlet.2010.04.068 23. Almonasy, N.; Neoras, M.; Hykova, S.; Lycka, A.; Cermak, J.; Dvorak, M.; Michl, M.; Dyes Pigm. 2009, 82, 164. DOI: http://dx.doi.org/10.1016/j.dyepig.2008.12.009 24. Benesi, H. A.; Hildebrand, J. H.; J. Am. Chem. Soc. 1949, 71, 2703. DOI: http://dx.doi.org/10.1021/ja01176a030 25. Palacios, M. A.; Wang, Z.; Montes, V. A.; Zyryanov, G. V.; Anzenbacher, J. P.; J. Am. Chem. Soc. 2008, 130, 10307. DOI: http://dx.doi.org/10.1021/ja802377k PMID: 18616249 26. Tang, L.; Li, F.; Liu, M.; Nandhakunar, R.; Bull. Korean Chem. Soc. 2011, 31, 3212. DOI: http://dx.doi.org/10.5012/bkcs.2010.31.11.3212 27. Jie, M,; Qun, H.; Weisheng, L.; Talanta 2010, 80, 2093. DOI: http://dx.doi.org/10.1016/j.talanta.2009.11.013 28. Min, H. L.; Thang, V. G.; Sang, H. K.; Young, H. L.; Chulhun, K.; Jong, S. K.; Chem. Commun. 2010, 46, 1407. DOI: http://dx.doi.org/10.1039/B921526C 29. Mayr, T.; Igel, C.; Liebsch, G.; Klimant, I.; Wolfbeis, O. S.; Anal. Chem. 2003, 75, 4389. DOI: http://dx.doi.org/10.1021/ac020774t PMID: 14632041 |
On-line version ISSN 1678-7064 Printed version ISSN 0100-4042
Qu�mica Nova
Publica��es da Sociedade Brasileira de Qu�mica
Caixa Postal: 26037
05513-970 S�o Paulo - SP
Tel/Fax: +55.11.3032.2299/+55.11.3814.3602
Free access


