Artigo
| ZnO and Ag-ZnO crystals: synthesis, characterization, and application in heterogeneous photocatalysis |
|
Adriana Campano LucilhaI; Marcelo Rodrigues da SilvaII; Rômulo Augusto AndoIII; Luiz Henrique Dall'AntoniaI; Keiko TakashimaI,*
IDepartamento de Química, Universidade Estadual de Londrina, 86057-970 Londrina - PR, Brasil Recebido em 28/07/2015 *e-mail: keiko@uel.br ZnO and Ag-ZnO were synthesized in a simple and efficient manner by thermal decomposition of zinc oxalate and silver/zinc mixed oxalate. The influence of the addition of metallic silver on ZnO particles and the effect of temperature in the thermal treatment were investigated. The samples were characterized by thermogravimetric analysis, Raman, X-ray diffraction, scanning electron microscopy, energy dispersive X-ray spectroscopy, specific surface area (Brunauer-Emmett-Teller) and diffuse reflectance spectroscopy. The photocatalytic activity of these materials in the decolorization of direct red 23 diazo dye was studied. The complete conversion into oxides from oxalates at lower temperatures was determinant in the photocatalytic efficiency of both the oxides. The presence of silver in zinc oxide, treated at 400 °C, more than doubled the rate constant of diazo dye decolorization (6.87x10⁻³ min-1) with respect to ZnO, treated at 600 °C, resulting in 3.07x10⁻³ min-1 under UV irradiation at 30 °C. INTRODUCTION The discharge of wastewaters with high concentration of dyes has created severe environmental pollution problems by releasing toxic and potential carcinogenic substances into the aquatic medium.1,2 It has been estimated that about 60% are azo dyes, characterized by one or more azo (-N=N-) groups bonded to the benzenic or naphtalenic rings.3 Among the advanced oxidation processes, the heterogeneous photocatalysis mediated by oxide semiconductors is regarded as a promising method for the effluent treatment.1,2 The semiconductor, under ultraviolet light irradiation, promotes electron from the valence band to the conduction band to give electron-hole pair in order to produce hydroxyl radical and to attack organics present at or near the surface. On the other hand, as the separation and recombination between these charge carriers are competitive, the photocatalytic activity becomes more effective when the recombination is hindered.4 In this context the zinc oxide, an n-type semiconductor, has been investigated for the photocatalytic application due to some interesting characteristics such as band gap energy of 3.37 eV,5 exciton binding energy of 60 meV, high electronic mobility, good transparency, environmental stability, low cost, in comparison to other metallic oxides and mainly by the possibility of simple synthesis.5 However, the ZnO efficiency can be lowered owing to the photogenerated charged carriers (h+/e-) recombination on the surface.6,7 Therefore, the ZnO surface modification, using metallic silver (Ag-ZnO) has been investigated with the aim to intensify the photocatalytic capacity of zinc oxide.7-10 Taking into place that silver can capture the photogenerated electrons from the semiconductor, the charge carriers recombination can be inhibited. So, the photogenerated hole (h+) can react with the adsorbed water molecule (or hydroxide anion) to generate hydroxyl radical, HO•.1 The hydroxyl radical is considered extremely strong oxidant agent with redox potential of +2.8 V,2 which can mineralize the azo dyes to innocuous compounds. Zhai et al.11 reported the meaningful enhancement of the ZnO photocatalytic activity in the presence of silver (Ag-ZnO) for the Rhodamine B dye degradation under solar light. Liang et al.12 also verified the photocatalytic activity increase for the Ag/ZnO in comparison to the ZnO and TiO2 commercial in order to degrade the Rhodamine B under UV irradiation. Bouzid et al.13 presented the ZnO photocatalytic activity in the presence of different silver percentages, whose best results for the methylene blue degradation took place to that containing 1% Ag after 150 min UV irradiation. This work had as objective to study the formation of pure ZnO and mixed with silver by oxalate decomposition at different temperatures in order to understand the temperature influence in the structures and interactions between ZnO and Ag. The photocatalytic activity of these semiconductors was investigated by means the direct red 23 diazo dye (DR23), Figure 1S, decolorization as a function of the irradiation time on the synthesized material surface under UV light exposure at 30 °C.
EXPERIMENTAL Materials All the reactants were of analytical purity and used without previous purification as zinc oxide (ZnO, Nuclear, PA), hexa-hydrated zinc nitrate (Zn(NO3)2.6H2O, Synth, 99.4%), dehydrated oxalic acid (H2C2O4.2H2O, Synth, 99.5%) and silver nitrate (AgNO3,Vetec, 99.8%). Direct red 23 diazo dye (C35H27N7S2O10Na2), C. I. 29160 (2.54x104 cm-1 mol-1 L, 0.999)14 was a gift from A. Chimical. All the solutions were prepared using purified water (Elga USF CE). Synthesis of zinc oxide pure and mixed with silver Zinc oxide was synthesized, taking 0.40 mol L-1 zinc nitrate and 0.60 mol L-1 oxalic acid of equal volume, 100 mL. These solutions were boiled separately until the boiling point.15 Zinc nitrate solution was added to oxalic acid solution in this temperature and the heating was immediately interrupted. The resulting mixture was maintained under stirring (300 rpm - Fisatom 752) until room temperature. The precipitated was filtered in a vacuum (Schleicher & Schuell, 47±0.5 mm diameter, 0.20 µm pore) and washed by several times with distilled water, overnight dried in air followed by heating at 100 °C for 3 h (Biopar S150SD).15 Approximately 2.0 g of the compound was introduced in the muffle (Marconi MA385) at 10 °C min-1 until reaching the desired temperature (200, 400, 600, 800, and 1000 °C) during 12 h. Similar procedure was followed to synthesize zinc oxide mixed with silver, adding 50 mL of the Zn(NO3)2.6H2O and 50 mL of the AgNO3 (17.9% Ag wt), both with 0.40 mol L-1, in 100 mL of the oxalic acid 0.60 mol L-1, and heated thermally at 400, 600, and 1000 °C during 12 h. Characterization The thermogravimetric and differential thermal analyses were carried out in a SEIKO 6300 thermal analyzer in air atmosphere ranging from 30 to 1200 °C with a heating rate of 10 °C min-1. Alumina was used as reference substance. The vibrational spectra were obtained from a Bruker FT-Raman RFS 100 spectrometer with excitation at 1064 nm, obtained through the Nd/YAG laser of 200 mW. The scanning system with accumulation of 256 scans and 2 cm-1 spectral resolution were used. The X-ray diffratogram were obtained from the powder method, using a Rigaku RINT 2000 Diffractometer with Cu-Kα1 radiation source (1.5418 Å) and collected with average of three successive scanning with 1° min-1 speed. The qualitative determination of the elements and its distribution were carried out by X-Ray dispersive energy spectrometry, EDS (Philips FEI Quanta 200). The morphology and structural organization were characterized by scanning electron microscopy, SEM (Philips FEI Quanta 200). The specific surface area and pore volume were determined by Brunauer-Emmett-Teller (BET) method, using a Quantachrome NovaWin version 10.01. The samples were pre-treated at 300 °C in a vacuum during 3 h. The band gap energy (Eg) was determined from the UV-Vis diffuse reflectance spectra in a Shimadzu UV-3101 PC, using the Kubelka-Munk model, which relates the sample reflectance (F(R)1/2) and the excitation energy of emitted photon.16 Photocatalytic activity The photocatalyst (2.0 g L-1) was introduced in a double wall borosilicate reactor, opened to the atmosphere, containing 150 mL of 7.5x10⁻⁵ mol L-1 direct red 23 diazo dye (DR23). This suspension was stirred at 600 rpm (Fisatom 752) during 60 min in the dark at 30.0±0.1 °C (Microquímica MQ8TC), inside a wooden box (50x50x50 cm) covered internally with aluminum foil. The suspension irradiation was carried out in the same reactor using Hg vapor lamp without bulb (125 W), positioned horizontally at 22 cm from the reactor. The irradiance (1600.0±20.0 µW cm-2) was measured through the radiometer (Topcon UVR-2). Aliquots (1.10 mL) of decolorized DR23 were removed at predetermined time intervals, filtered (Millipore - 0.22 µm), and monitored by UV-Vis spectrophotometry from 200 to 900 nm (Ocean Optics USB4000) at 503 nm. The decolorization rate constant, kobs, was determined graphically under pseudo-first order conditions17 at 30 °C.
RESULTS AND DISCUSSION Materials characterization The thermo-gravimetric and differential thermal analyses at air atmosphere for hydrated zinc oxalate (msample 10.4 mg), Figure 1a, showed that the thermal decomposition occurred at two well-defined steps of mass loss. The first one (16.4%) was an endothermic process and corresponded to a moisture (122 °C) and hydration (146 °C) of water molecules. The second mass loss (39.5%) was related to the exothermic decomposition of the zinc oxalate in CO2 and CO at 398 °C. The residual mass of ZnO was 44.1%. The zinc oxide formation is displayed in Reaction 1. 
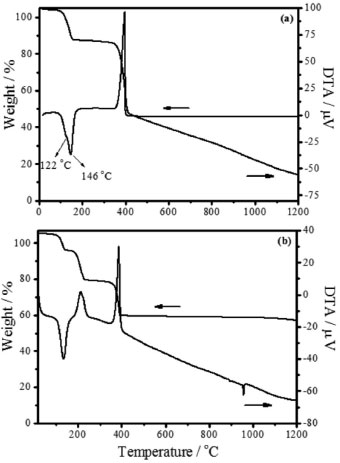 Figure 1. TGA/DTA curves of (a) ZnC2O4, and (b) Ag2C2O4 - ZnC2O4
Ahmad et al.18 verified similar behavior for the ZnO synthesis from ZnC2O4, whose uniform ZnO nanoparticles were found at 400 °C. The thermo-gravimetric curve of the zinc and silver mixed oxalate (Ag2C2O4-ZnC2O4) in air atmosphere (msample 10.5 mg), Figure 1b, shows that the thermal decomposition occurred in three steps. The initial loss, 9.1%, at 134 °C was an endothermic process with 5/2 mol dehydration. The second loss, 16.0%, at 212 °C was related to the exothermic decomposition of Ag2C2O4 in Ag2O. The third one of 18.6% at 387 °C corresponded to the exothermic decomposition of ZnC2O4 and Ag2O. The Ag-ZnO formation is represented in Reaction 2.  The last process, verified by differential thermal analyses at 957 °C, was relative to the endothermic process of metallic silver fusion (957 °C). As in the zinc oxide as well as zinc-silver oxide formation, there was not mass variation until 1200 °C and this indicates that the reaction was complete and no solid state reaction or phase transition occurred. Raman scattering spectra indicated that, when the ZnC2O4 was heated at 200 °C during 12 h was not enough in order to produce ZnO, considering that the sample spectrum is similar to zinc oxalate as shown in Figure 2a. At 400 °C, Figure 2a, the dominant spectrum was of ZnO with fluorescence, due to the incomplete burn of the zinc oxalate. On the other hand, the spectrum did not present fluorescence from 600 °C until 1000 °C, in which are shown only frequencies corresponding to the wurtzite structure at 437 cm-1 (E2high) and a large band from 1000 to 1200 cm-1. These bands were attributed respectively to the oxygen movement and to the ZnO multi-phonons modes.5,19
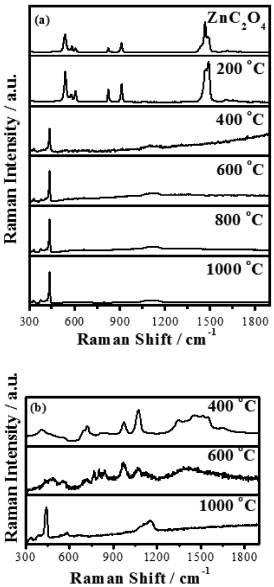 Figure 2. Raman spectra of (a) pure zinc oxalate and heated thermally (200, 400, 600, 800 and 1000 °C) for 12 h, and (b) synthesized Ag-ZnO at different temperatures (400, 600, and 1000 °C) for 12 h
The Raman spectra of Ag-ZnO sample, Figure 2b, presented the characteristic stretchings at 437 cm-1 and 1000-1200 cm-1 for ZnO only at 1000 °C, attributed to the larger silver amount on the oxide surface at 400 °C and 600 °C. The partial fusion of Ag at 957 °C justifies the appearing of the ZnO characteristic bands at 1000 °C. Figure 3 presents X-ray diffractograms of zinc oxalate, Figure 3a, and of samples treated thermally, Figure 3b-f. Only characteristic peaks of the zinc oxalate at 2θ as 23.4º (002), 30.2º (402), 35.1º (021), 48.3º (023), 40.5º, (022) and 43.4º(221) were observed at 200 °C, Figure 3b.18,20 The ZnO synthesis from ZnC2O4 occurred from 400 °C, presenting 2θ peaks at 31.7º(100), 34.4º(002), 36.3º(101), 47.5º(102), 56.6º(110), 62.8º(103), 66.3º(200), 67.9º(112) and 68.9º(201), Figure 3c-f, characterized by the crystalline structure of wurtzite.5 This structure belongs to the hexagonal system P63mc (186) crystallographic class 6mm, whose lattice parameters are a = b = 3.2562 Å and c = 5.2105 Å (PDF code 01-079-2205). All these results are consistent with respect to those obtained by thermogram, Figure 1, and by Raman scattering spectra, Figure 2. So, the samples treated at 400, 600, 800, and 1000 °C presented crystal structure of ZnO.
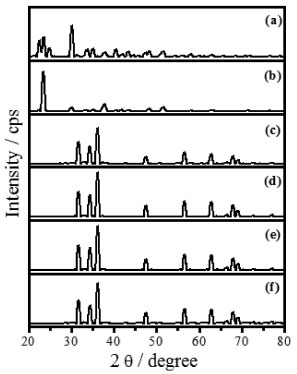 Figure 3. XRD patterns of (a) zinc oxalate and heated at (b) 200 °C, (c) 400 °C, (d) 600 °C, (e) 800 °C, and (f) 1000 °C for 12 h
The diffratograms of the unheated sample formed from the mixture of zinc nitrate and silver nitrate, Figure 4a, indicates the existence of silver oxalate and zinc oxalate (Ag2C2O4 - ZnC2O4) phases.
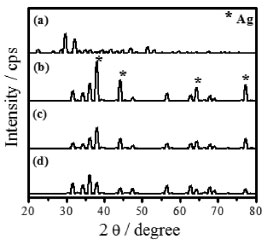 Figure 4. XRD patterns of (a) synthesized mixed oxalate (ZnC2O4 - Ag2C2O4) and heated thermally in (b) 400 °C, (c) 600 °C, and (d) 1000 °C for 12 h
The majority of the peaks belongs to the silver oxalate, that presents a primitive monoclinic crystalline system, spatial group P21/n (14) and estimates lattice parameters of a = 9.368 Å, b = 6.203 Å and c = 3.455 Å (JCPDFWIN 22-1335). According to the thermogram displayed in Figure 1b, the conversion from mixed oxalate (Ag2C2O4-ZnC2O4) to ZnO and Ag occurs at 400 °C. These results were confirmed by XRD, because as the wurtzite phase peaks of ZnO as fcc of metallic silver with peaks characteristics in 2θ at 38.1º (111), 44.2º (200), 64.4º (220) and 77.4º (311), JCPDS No. 04-783, were observed. The metallic silver was produced from the Ag2O decomposition in the ZnO environment at 387 °C, as shown in Reaction 3.  Then, this technique displayed the existence of phases mixture, that is, metallic silver and ZnO (Ag-ZnO). As the positions of the ZnO characteristic peaks did not alter, the ZnO and Ag mixture formation was attributed to the agglomeration of Ag on the ZnO surface. This justifies the alterations in the peak intensities of the diffractograms corresponding to the Ag and ZnO phases. The gradual decrease in the peaks intensity as well as the metallic silver amount at 600 °C and 1000 °C may be associated to the Ag agglomeration on ZnO surface, forming an amorphous species, from 350 °C to 957 °C, Reaction 4.  The Ag fusion was characterized at 957 °C, Reaction 5.  The images, obtained by SEM, with magnification of 3,000×, showed which material heated thermally at 200 °C during 12 h maintained the same morphological characteristics of zinc oxalate, Figure 5a and was not enough to ZnO synthesis, as verified previously from thermal analysis, Raman scattering, and X-ray diffraction. The fissure was observed at 400 °C (not shown), that became more evident when the temperature was raised from 600 °C to 1000 °C, Figure 5b-d. Besides of this, the particle sizes enhanced, as well as their sinterized aspect, inset Figure 5b-d with a magnification of 60,000×, decreasing the available surface area to catalytic reactions. In this way, the complete ZnO synthesis carried out at 600 °C, considering the incomplete burn at 400 °C, observed by Raman scattering.
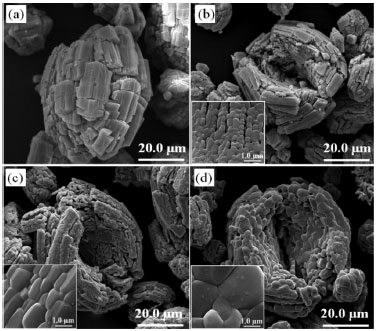 Figure 5. SEM images of (a) zinc oxalate heated thermally for 12 h at (b) 600 °C, (c) 800 °C, and (d) 1000 °C. Inset: (b), (c), and (d) SEM images with magnification of 60,000×
The SEM images with a magnification of 3,000× of the zinc and silver oxalate mixture (Ag2C2O4-ZnC2O4), displayed in Figure 6a, shows particles with morphology similar to the zinc oxalate, Figure 5a. Besides this, a morphologically different structure was verified and related to the silver oxalate (Figure 6a, inset 1), as verified by EDS. The morphological alterations of the particles, displayed in Figure 6b-d, were established when the heat treatment was raised from 400 °C to 1000 °C. The structure related to silver started to decompose from 400 °C and was distributed in two different ways: the first one, as an arrangement constituted by agglomerates, as verified from EDS, Figure 6b, inset. The second consisted of smaller spherical particles, also observed from EDS, Figure 6c, inset. The agglomeration increase of these structures with zinc oxide was verified at 1000 °C. The fissure opening was minimal at 400 °C and increased at higher temperatures. This means that the enhancement temperature favored the increase as in size as in the particles sintering.
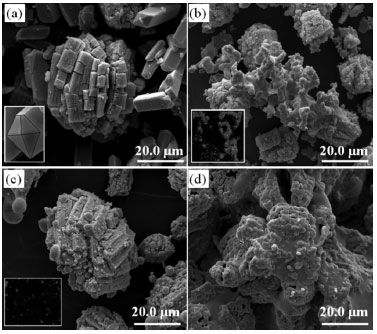 Figure 6. SEM image of (a) ZnC2O4 - Ag2C2O4 sample heated at (b) 400 °C, (c) 600 °C, and (d) 1000 °C for 12 h. Inset: (a) Ag2C2O4 morphology, (b) and (c) Ag distribution verified by EDS
Thermal treatments fulfill fundamental role in the properties of the materials during the synthesis.21 This can be justified, because at very high temperatures the sinterization facilitates the movement of atoms and molecules,22 resulting in the particle size growth and in the decrease of the available specific surface area and pore volume for adsorption. Taking into place the results obtained from TGA, Raman, and XRD, it is expected that the smallest temperature for the material formation (600 °C for ZnO and 400 °C for Ag-ZnO) allows the largest available surface area. Consequently, the specific surface area and pore volume of the materials, obtained from the BET method, were carried out with the aim to verify the influence of thermal treatment in the synthesized materials. From these results, shown in Table 1, the largest values for specific surface area and pore volume were obtained from Ag-ZnO heated thermally at 400 °C followed by ZnO at 600 °C. It was verified that the temperature enhancement decreased the pore volume for both ZnO (0.52 to 0.05 cm3 g-1) and Ag-ZnO (1.95 to 0.03 cm3 g-1), whereas the silver presence on the ZnO surface increased the oxide surface area (10.4 m2 g-1) in comparison to ZnO (5.49 m2 g-1). In this way, the temperature enhancement decreased the specific surface area and pore volume, due to the material sinterization. These results indicate that the surface modification of ZnO with silver was satisfactory, since the presence of this metal decreases the formation temperature to 400 °C and approximately doubles the surface area of the semiconductor oxide.
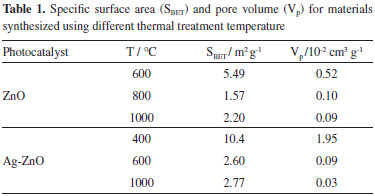
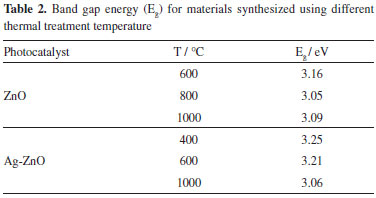
So, the presence of silver on the ZnO surface increased the specific surface area in this work, meanwhile Liang et al.12 observed a decrease of around 30% in the synthesis of porous 3D flower-like Ag/ZnO composites at 300 °C during 2 h. Our results using Ag-ZnO at 400 °C presented larger surface area in comparison to ZnO obtained at 600 °C (6.25 m2 g-1) by Cun et al.23 The band gap energy, calculated from UV-Vis spectra of diffuse reflectance, showed that the temperature increase delocalized the material absorption to higher wavelength.24 This means that there was a decrease of the band gap energy as presented in Table 2. This behavior was observed as for ZnO as for Ag-ZnO, which can be related to the crystallization process. Among these materials, ZnO synthesized at 600 °C, presented the band gap energy of 3.16 eV. Conversely, Ag-ZnO, treated at 400 °C, presented the largest value for band gap energy of 3.25 eV. The synthesized ZnO in this work, presented band gap energies lower than those obtained by Pardeshi and Patil25 about the ZnO preparation by mechanochemical synthesis, varying the temperature from 400 °C to 900 °C. On the other hand, Georgekutty et al.9 did not observe variation in the band gap energy among ZnO and modified by silver samples.
Photocatalytic activity The DR23 diazo dye decolorization by UV photolysis presented a kinetic behavior of first order with a rate constant of 0.13×10⁻³ min-1 (r = 0.898) at 30 °C, the DR23 solution does not have significant decolorization (3.12%). The photocatalytic activity of the synthesized oxides was investigated under pseudo-first order conditions, maintaining fixed DR23 concentration (7.5×10⁻⁵ mol L-1) in a suspension at 30 °C as displayed in Table 3.
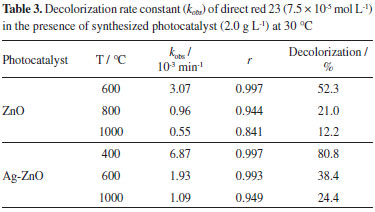
According to this table, the ZnO (2.0 g L-1), treated thermally at 600 °C for 12 h, presented the largest decolorization rate constant, kobs, of 3.07×10⁻³ min-1. This rate constant was more than three times larger in comparison to ZnO heated at 800 °C (0.96×10⁻³ min-1) and almost six-fold larger than at 1000 °C (0.55×10⁻³ min-1). Figure 7a displays the absorption spectra of DR23 decolorization, with maximum absorbance (Ao=1.316) at 503 nm, after the adsorption-desorption equilibrium time of 60 min, using ZnO under UV irradiation at 30 °C during 240 min.
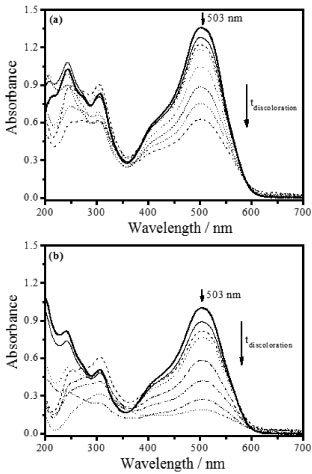 Figure 7. Direct red 23 diazo dye (7.5 × 10⁻⁵ mol L-1) decolorization in aqueous suspension using (a) ZnO synthesized thermally at 600 °C (2.0 g L-1) and (b) Ag-ZnO synthesized thermally at 400 °C (2.0 g L-1) as a function of irradiation time at 30 °C
On the other hand, when the Ag-ZnO composite thermally heated at 400 °C was irradiated, the diazo dye presented a larger decolorization rate constant of 6.87×10⁻³ min-1 as shown in Table 3. This value was about 3.6-fold larger with respect to 600 °C (1.93×10⁻³ min-1) and around 6.3-fold larger than 1000 °C (1.09×10⁻³ min-1). Moreover, when Ag-ZnO was used, the initial azo dye absorbance was lower than ZnO, decreasing to 1.001 (Figure 7b). This can be attributed to the larger specific surface area of Ag-ZnO, determined by BET. For this reason, as the rate constant as the decolorization percentage of the DR23 diazo dye were larger, when the irradiation was carried out by means of the ZnO in Ag presence (80.8%) in comparison to ZnO (52.3%). Therefore, the ZnO, synthesized and heated in silver medium, presented higher values of kobs due to the larger available surface area and the Ag presence that restrains the recombination of photogenerated charge carriers (hVB+/eCB-) on ZnO surface, because it is considered an efficient removal of electrons. This enables a larger formation of hydroxyl radicals (•OH) from the photogenerated holes (hVB+), Reaction 6, which are capable to oxidize DR23 diazo dye by means of the hydrogen abstraction, initiating the oxidation radical reactions and mineralizing completely the diazo dye,1,2 DR23, Reaction 7. The diffuse reflectance spectra showed that the band gap energy of ZnO and Ag-ZnO decreased with temperature increase, however the band gap energy decrease did not correspond to the photocatalytic efficiency of these oxides. Based on these evidences it can be inferred that the particles surface area was determinant in the photocatalytic efficiency of materials obtained at different temperatures. In according to Table 3, the photocatalytic efficiency of synthesized zinc oxide in presence of silver was larger than ZnO. This may be justified by the synergism that occurs between Ag and ZnO, considering that the metallic silver may behave as electron acceptor, hindering the charge carriers recombination,26 consequently favoring the pollutants degradation on the photocatalyst surface. Therefore, the modification of the ZnO surface with silver, Ag-ZnO, resulted in a viable material in comparison to ZnO for the application in heterogeneous photocatalysis for DR23 decolorization. 
CONCLUSION This work reported that the ZnO and Ag-ZnO syntheses were carried out satisfactorily from the transition metal oxalates at 600 °C and 400 °C, respectively. The temperature raise in the thermal treatment showed that the pore volume of the synthesized oxides decreased, owing to the particle sinterization, decreasing consequently the photocatalytic activity of these materials for decolorization of the direct red 23 diazo dye. Besides of this, the zinc oxide synthesized at silver medium, Ag-ZnO, more than doubled the decolorization rate constant (6.87×10⁻³ min-1) with respect to ZnO (3.07×10⁻³ min-1), attributed to the increase of available surface area, as well as the recombination decrease of the photogenerated charge carriers, by removal of electrons by silver, generating hydroxyl radical.
ACKNOWLEDGMENTS The authors are grateful to Fundaçao Araucária (22850/2011) for financial support. A. C. Lucilha is grateful to CAPES for the scholarship. The authors would like to thank LMEM-UEL for the SEM analysis.
REFERENCES 1. Legrini, O.; Oliveros, E.; Braun, A. M.; Chem. Rev. 1993, 93, 671. 2. Hoffman, M. R.; Martin, S. T.; Choi, W.; Bahnemann, D. T.; Chem. Rev. 1995, 95, 69. 3. Zollinger, H.; Color Chemistry: Synthesis, Properties and Applications of Organic Dyes and Pigments, 2nd ed., VCH: Weinheim, 1991. 4. Ohtani, B.; Catalysts 2013, 3, 942. 5. Özgür, Ü.; Alivov, Y. I.; Liu, C.; Teke, A.; Reshchikov, M. A.; Doan, S.; Avrutin, V.; Cho, S.-J.; Morkoç, H.; J. Appl. Phys. 2005, 98, 041301. 6. Kumar, S. G.; Rao, K. S. R. K.; RSC Adv. 2015, 5, 3306. 7. Tian, J. J.; Zhang, Q. F.; Zhang, L. L.; Gao, R.; Shen, L. F.; Zhang, S. G.; Qu, X. H.; Cao, G.; Nanoscale 2013, 5, 936. 8. Guo, X-H.; Ma, J-Q.; Ge, H-G.; J. Phys. Chem. Solids 2013, 74, 784. DOI: http://dx.doi.org/10.1016/j.jpcs.2013.01.024 9. Georgekutty, R.; Seery, M. K.; Pillai, S. C.; J. Phys. Chem. C 2008, 112, 13563. 10. Zheng, Y.; Zheng, L.; Zhan, Y.; Lin, X.; Zheng, Q.; Wei, K.; Inorg. Chem. 2007, 46, 6980. 11. Zhai, H.; Wang, L.; Sun, D.; Han, D.; Qi, B.; Li, X.; Chang, L.; Yang, J.; J. Phys. Chem. Solids 2015, 78, 35. DOI: http://dx.doi.org/10.1016/j.jpcs.2014.11.004 12. Liang, Y.; Guo, N.; Li, L.; Li, R.; Ji, G.; Gan, S.; Appl. Surf. Sci. 2015, 332, 32. DOI: http://dx.doi.org/10.1016/j.apsusc.2015.01.116 13. Bouzid, H.; Faisal, M.; Harraz, F. A.; Al-Sayari, S. A.; Ismail, A. A.; Catal. Today 2015, 252, 20. 14. Lucilha, A. C.; Bonancêa, C. E.; Barreto, W. J.; Takashima, K.; Spectrochim. Acta, Part A 2010, 75, 389. 15. Muruganandham, M.; Chen, I. S.; Wu, J. J.; J. Hazard. Mater. 2009, 172, 700. DOI: http://dx.doi.org/10.1016/j.jhazmat.2009.07.053 PMID: 19665842 16. Kubelka, P.; Munk-Aussig, F.; Tech. Phys. 1931, 12, 593. 17. Atkins, P.; de Paula, J.; Physical Chemistry, 7th ed., Oxford: Oxford, 2006. 18. Ahmad, T.; Vaidya, S.; Sarkar, N.; Ghosh, S.; Ganguli, A. K.; Nanotechnology 2006, 17, 1236. DOI: http://dx.doi.org/10.1088/0957-4484/17/5/012 19. Fazio, E.; Patanè, S.; Scibilia, S.; Mezzasalma, A. M.; Mondio, G.; Neri, F.; Trusso, S.; Curr. Appl. Phys. 2013, 13, 710. DOI: http://dx.doi.org/10.1016/j.cap.2012.11.010 20. Ni, L.; J. Mater. Sci. Technol. 2011, 27, 563. DOI: http://dx.doi.org/10.1016/S1005-0302(11)60109-6 21. Skoog, D. A.; Holler, F. J.; Nieman, T. A.; Princípios de análise instrumental, 5th ed., Bookman: Porto Alegre, 2002. 22. Ali, G. M.; Chakrabarti, P.; Appl. Phys. Lett. 2010, 97, 031116. 23. Cun, W.; Jincai, Z.; Xinming, W.; Bixian, M.; Guoying, S.; Ping'an, P.; Jiamo, F.; Appl. Catal., B 2002, 39, 269. 24. Rusdi, R.; Rahman, A. A.; Mohamed, N. S.; Kamarudin, N.; Kamarulzaman, N.; Powder Technol. 2011, 210, 18. 25. Pardeshi, S. K.; Patil, A. B.; J. Mol. Catal. A: Chem. 2009, 308, 32. DOI: http://dx.doi.org/10.1016/j.molcata.2009.03.023 26. Ida, Y.; Watase, S.; Shinagawa, T.; Watanabe, M.; Chigane, M.; Inaba, M.; Tasaka, A.; Izaki, M.; Chem. Mater. 2008, 20, 1254. |
On-line version ISSN 1678-7064 Printed version ISSN 0100-4042
Qu�mica Nova
Publica��es da Sociedade Brasileira de Qu�mica
Caixa Postal: 26037
05513-970 S�o Paulo - SP
Tel/Fax: +55.11.3032.2299/+55.11.3814.3602
Free access


