Nota Técnica
| Evaluation of cryolite from pitinga (Amazonas-Brazil) as a source of hydrogen fluoride |
|
Jéssica F. PaulinoI; Reiner NeumannII; Júlio C. AfonsoI,*
IDepartamento de Química Analítica, Instituto de Química, Universidade Federal do Rio de Janeiro, 21941-909 Rio de Janeiro - RJ, Brasil Recebido em 16/09/2015 *e-mail: julio@iq.ufrj.br This paper reports the use of cryolite from the Pitinga Mine (Amazonas state, Brazil) as raw material in hydrogen fluoride production. Samples were initially characterized by chemical and mineralogical analyses. They presented low silica content (< 4 wt.%). After milling, cryolite samples were digested with concentrated sulfuric acid under stirring (200 rpm) and variable temperature, time and liquid to solid ratio conditions. Under the best experimental conditions (140 °C, 3-5 h), 96 wt.% of fluorine was recovered as hydrogen fluoride. The application of a 23 full factorial design showed that temperature and reaction time were relevant parameters during leaching, whereas liquid to solid ratio was not statistically significant. INTRODUCTION Cryolite (Na3AlF6) is a fluorine-rich mineral (54.30 wt.% F). It used to be commercially exploited in Ivigtut (Greenland) until the reserve exhausted in 1986. The occurrence of this mineral is reported in few localities in the world.1 Nowadays, the only commercial cryolite deposit worldwide is found in Pitinga (Amazonas State, Brazil).2,3 Cryolite has been used as an insecticide and pesticide.4 However, its main use is in the electrolytic production of aluminum metal (the Hall-Héroult process) in which alumina (Al2O3) is dissolved in a bath consisting primarily of molten cryolite.5,6 Synthetic cryolite is manufactured from alumina, hydrofluoric acid and sodium hydroxide according to the following reaction:7  At present, Brazil imports all synthetic cryolite. Fluorite (CaF2, 48.66 wt.% F), also known as fluorspar, is the major source of fluorine. Brazil has about 1% of the world reserves of this mineral (2,086 million t). CaF2 content in fluorite ores varies from 27.6 to 44.9 wt.%. Fluorite mines are mainly located in southern Brazil (Santa Catarina and Paraná states). These deposits are, in general, underground mines and the production cost is usually high.6,8 Brazil produces about 0.4 wt.% of the fluorite consumed in the world.6 This mineral is the raw material in the manufacture of hydrogen fluoride (HF), the most important fluorine compound, with an annual production of 1 million t.9 Hydrogen fluoride is produced by reacting acid-grade fluorite (≥ 97 wt.% CaF2 and < 1.5 wt.% SiO2) with concentrated sulfuric acid or oleum.10 Calcium sulfate and anhydrous gaseous hydrogen fluoride are formed according to reaction 2.  Controlling the SiO2 content is an essential step, as HF dissolves silica and silicate minerals to produce gaseous silicon tetrafluoride (SiF4), thus implying in losses of the desired fluoride product (reaction 3). SiF4 may form fluorosilicic acid (H2SiF6) in contact with water (reaction 4) or may be even hydrolyzed, thus restoring HF. Silicon tetrafluoride (SiF4) increases the corrosiveness of the gaseous effluent, which may damage the reactor of the industrial plant.11  The gaseous effluent may contain other impurities such as sulfur dioxide and sulfuric acid.11,12 Therefore, the gas leaving the reactor must undergo purification steps, in order to obtain a technical grade product, containing approximately 99.9 wt.% HF.13 HF is highly soluble in water and the commercial product is an aqueous solution containing 40-70 wt.% HF.10,13 The main use of HF is in the manufacture of fluorocarbons, such as hydrofluorocarbons, hydrofluorochlorocarbons and fluoropolymers (e.g. Teflon®). Inorganic fluoride compounds are also produced, including aluminum fluoride (AlF3) and synthetic cryolite.5,6 Other uses include: as paraffin alkylation catalyst in the production of high octane fuels; obtainment of uranium hexafluoride (UF6), which is the chemical species involved in the uranium enrichment process, and removal of surface oxides from stainless steel.10,14 At present, all HF used by industries in Brazil is imported. The only HF and AlF3 manufacturing plant in Brazil (and also in South America) was closed down in 2009.15 The Pitinga mine is located at about 300 km north from Manaus, the Amazon State capital, in the northern Brazil. It is nowadays the largest producer of tin in the country. Niobium and tantalum are exploited as by-products. An iron-niobium-tantalum alloy is produced and exported. Fluorine, rare-earth elements (REE), zirconium, thorium, uranium and lithium are also potential by-products. Two types of cryolite mineralization occur: disseminated (317 million tons with an average grade of 4.15 wt.% Na3AlF6) and massive ore (9.97 million tons with an average grade of 31.9 wt.% Na3AlF6).16 The massive cryolite deposit (MCD) has two main ore bodies: Zone A and Zone B, up to 300 m long and 30 m thick. The cryolite bodies are made essentially of cryolite crystals (~87%) up to 15 mm in diameter, but also contain quartz, zircon and alkali feldspars. Fluorite was identified filling fractures and replacing cryolite on the borders of the bodies.2,3 REE are commonly associated with both cryolite mineralization types in variable amounts, reaching over 1 kg t-1.17,18 Taking into account the distance from the massive cryolite deposit in Pitinga to the main industrial Brazilian regions (Minas Gerais, Sao Paulo and Rio de Janeiro states), its commercial exploitation is still not economically viable.8 However, this deposit contains much more fluorine than the present known reserves of fluorite in Brazil.6,8,19 Its silica content is lower than in other fluorite ores (from 10-20 wt.% in Santa Catarina State to 50-60 wt.% in Rio de Janeiro State).2,18-21 These features justify the presently reported study, which aimed at investigating the possibility of the use of cryolite from Pitinga as a source of hydrogen fluoride by leaching with concentrated sulfuric acid. The factors affecting leachability (temperature, reaction time and liquid to solid ratio) were studied using a full factorial design with two levels and three factors.
EXPERIMENTAL Characterization of ore samples Cryolite samples collected from drill cores crossing the MCD (Zone B) of Pitinga mine were used in this study. After jaw-crushing, grinding and splitting the sample, the mineral phases were identified by X-ray diffraction (XRD). The XRD data were obtained with either a Bruker D4 Endeavor (Co Kα, λ = 1.7889 Å, 40 kV, 40 mA, LynxEye detector) or a Bruker D8 Advance Eco (Cu K α, λ = 1.5418 Å, 40 kV, 25 mA, LynxEye XE detector) diffractometer. The quantitative phase analysis by the Rietveld method was done with the Bruker-AXS TOPAS 4.2 software.22,23 This method is an important tool for quantitative phase analysis from X-ray powder diffraction. It is based on crystallographic information of the mineral sample. The results are fast and reliable.24 The elemental chemical composition was determined by X-ray fluorescence (Shimadzu XRF 800HS). Calibration curves (0.1-1000 mg kg-1) for fluorine, aluminum, sodium, silicon, iron, calcium, potassium, magnesium and zirconium were employed for the quantitative analyses of these elements. Rare earth elements (yttrium, lanthanum, cerium, samarium, neodymium, gadolinium, dysprosium and ytterbium) were determined by inductively coupled plasma optical emission spectroscopy (ICP-OES) (HORIBA Ultima 2 spectrometer). The occurrence of these elements has already been reported in several cryolite samples from Pitinga.2,3,17,18 The samples were digested in a mixture of hydrochloric, nitric, perchloric and hydrofluoric acids at ~60 ºC and the leachate was evaporated to dryness. The resulting solid was then dissolved in HNO3 for analysis by ICP-OES. Leaching by concentrated H2 SO4 Cryolite reacts with sulfuric acid according to the following reaction:  Samples were milled to particle size <106 µm. About 2.0 g of the sample and concentrated sulfuric acid (at different liquid to solid ratios) were transferred to a 50 mL Teflon® flask attached to polypropylene bottles to collect the gaseous effluent. This flask was immersed into an oil bath at variable temperatures and times. Leaching experiments were performed under magnetic stirring (200 rpm). After the experiment, the slurry was filtered and the insoluble residue was washed with water at 70 ºC until free of acid. Then it was dried at 110 ºC for 3 h and analyzed by XRF and XRD (Section 2.1). Quantitative data of mineral phases were obtained by the Rietveld method.22,23 The gaseous effluent was absorbed by distilled water cooled in an ice bath. The pH was determined by potentiometry (glass electrode). This solution was treated with 0.1 mol L-1 calcium chloride to precipitate fluoride as CaF2. The solid was filtered, washed with 0.1 mol L-1 ammonium acetate until free of chloride, dried at 110 ºC for 2 h and weighed on an analytical balance (± 0.01 mg). It was also analyzed by XRD. A screening test, based on full factorial design, was used to select the most important variables. The test was developed with three factors: temperature (80 or 120 ºC), time (1 or 4 h) and acid to ore ratio (1.6 mL g-1 or 2.4 mL g-1). The levels for each variable were defined based on exploratory experiments. Less than 50 wt.% of the sample was dissolved when experiments were performed below 80 ºC for less than 1 h. 80 wt.% was leached after 4 h at 80ºC. The maximum temperature was set at 120 ºC, which is somewhat higher than the boiling point of HF azeotrope (38 wt.%, b.p. 112 ºC). The amount of sulfuric acid was calculated according to reaction (5). The theoretical liquid to solid ratio is 0.8 mL acid/1.0 g ore. A stoichiometric excess of sulfuric acid was also used: 1.6 mL g-1 (100 wt.% excess) and 2.4 mL g-1 (200 wt.% excess). In a two-level full factorial design for three factors (23) each of the three variables is investigated at two levels. This experimental design requires eight runs.25 Experiments were run in two replicates and random order to avoid systematic error. Analysis of experimental data was performed by the software Statistica by StatSoft Inc. (2007, version 8.0) and Pareto analysis.26 Based on the screening test, the significant variables were optimized while the non-significant was fixed. Additional experiments were performed in a new experimental design with center point. This point was run in three replicates.
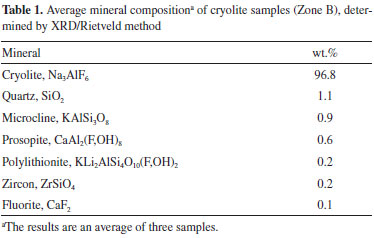
RESULTS AND DISCUSSION Characterization of the ore samples The data obtained through the Rietveld method (Table 1) indicates that the samples from MCD (Zone B) contain 96.8 wt.% Na3AlF6. This value is higher than that reported for the average cryolite grades by Bastos Neto et al.,2,3 which may be due to the more selective sampling of the drill cores. Samples consequently contain lower amounts of silicate minerals (1.3 wt.%) and quartz (1.1 wt.%). All minerals listed in Table 1 have already been identified in previously reported studies.2,3,17
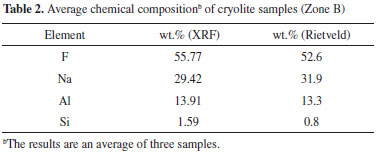
According to XRF data (Table 2), the samples contain ~55.8 wt.% F. XRF analyses of fluorine-rich minerals have rarely been reported in the literature.27,28 Table 2 presents the comparison of XRF data with quantification by the Rietveld method (converted into elemental concentrations). The results are close, except for silicon. The low content in silicates, however, tends to increase the uncertainties related to the quantification by the XRD/Rietveld method.24 Elemental analysis of fluorine in fluorine-rich minerals by XRF appears thus to be possible.
According to reported data from the scientific literature, total REE contents are low in the MCD, ranging from 6.66 ppm to 10.33 ppm.2,3,18 According to ICP-OES data only yttrium (7 mg kg-1) and ytterbium (5 mg kg-1) were identified and quantified. Screening of the most important variables A two-level three-factor (23) full factorial design was applied to select the most important variables. Table 3 shows the design matrix and response (average leached mass, wt.%) for the experimental conditions investigated. Figure 1 shows the effect of the three factors on leached mass (main effect). The main effects plots indicate that temperature and time had a positive effect on the response. The amount of leached mass increased from 50.12 to 91.66 wt.% as temperature and time increased. The acid to ore ratio had a weak effect on the response.
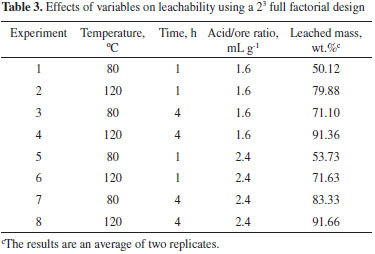
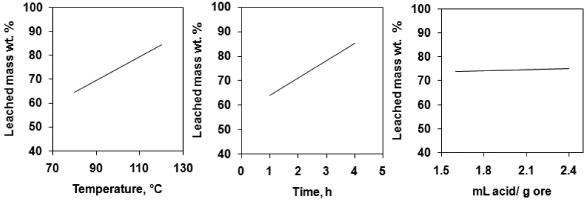 Figure 1. Main effects plots
Relationships between factors were exposed in Figure 2: an interaction effects plot. Parallel lines indicate that there is no interaction between variables. According to the plot there was interaction between time and temperature. Acid to ore ratio and temperature had weak interaction and so did acid to ore ratio and time. In both cases the leached mass increased for each level of acid to ore ratio.
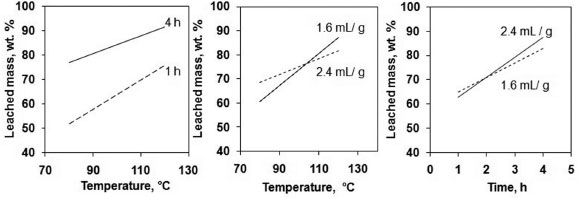 Figure 2. Interaction effects plot
Estimates of the effects (95% confidence level) are given in the Pareto diagram (Figure 3). This chart shows the statistically significant effects. The effects for which rectangles are on the right of the line (P = 0.05) were considered significant.26 Temperature, time and all second order interactions were significant. The acid to ore ratio was not a relevant factor. Temperature and time were the most important factors for leaching by concentrated H2SO4.
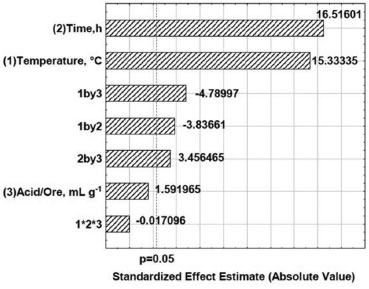 Figure 3. Pareto chart standardized effects
Optimization of leaching conditions The significant variables identified from the screening experiment were optimized. A two-level two-factor (22) full factorial design with center point was performed for optimization. Thus, time and temperature were investigated at intervals shown in Table 4. These factors were centered on the best experimental condition of the screening test, while liquid to solid ratio were fixed at 1.6 mL g-1 (lower level). Table 4 shows the design matrix and response (average leached mass, wt.%).
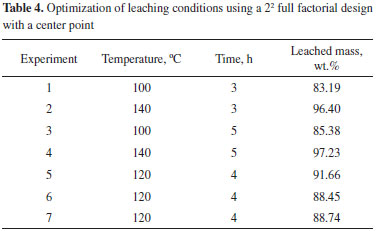
The results were fitted to a predictive linear polynomial equation as the correlation between the response variable and the independent variables. The coefficient of determination (R2) of the model was 0.9624. Figure 4 shows the two-dimensional contour lines. The leached mass wt.% increases when temperature increases while time seems to have little effect on the response in this interval. For each leaching time investigated (3-5 h), the recovery of hydrogen fluoride significantly increased with temperature. Additional experiments were not performed because in this time interval all cryolite was decomposed by sulfuric acid at 140 °C as shown in Table 4 and Figure 5. Leaching was maximum (97 wt.% of the sample) at these experimental conditions.
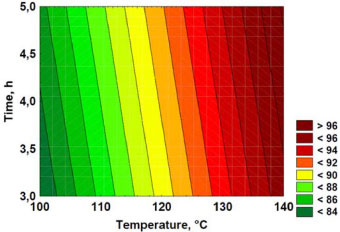 Figure 4. Two-dimensional contour lines (values in the legend representing wt.% leached mass)
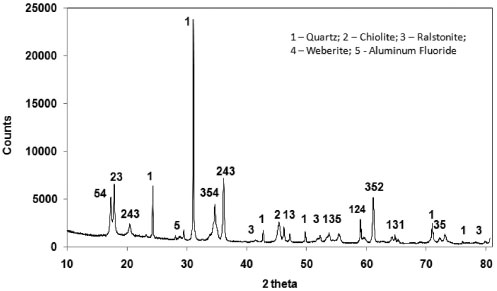 Figure 5. XRD pattern (Co Kα radiation) of the insoluble residue. The peaks represent quartz (SiO2), chiolite (Na5Al3F14), ralstonite (NaxMgxAl2−x(F,OH)6 •H2O), weberite (Na2MgAlF7) and aluminum fluoride (AlF3)
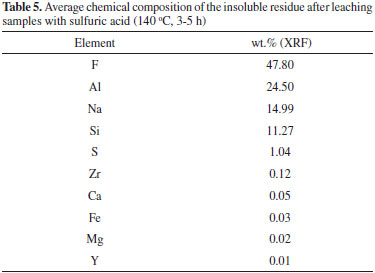
Characterization of the insoluble residue Figure 5 shows the XRD pattern of the insoluble residue obtained at 140 °C for 5 h. All cryolite was decomposed by sulfuric acid as attested by the absence of its peaks in the diffractogram. The insoluble residue is composed by quartz, aluminum fluoride and other minor fluorine-bearing complex minerals that were either not attacked by sulfuric acid under our experimental conditions or crystallized during the experiment. The scientific literature reports that cryolite ores usually contain also quartz, feldspar, fluorite and various aluminofluorides.1,29,30 Chiolite [Na5Al3F14], ralstonite [NaxMgxAl2−x(F,OH)6•H2O] and weberite [Na2MgAlF7] were identified in the insoluble residue. These aluminofluorides are rare minerals, but chiolite, prosopite and thomsenolite [NaCaAlF6.H2O] have already been identified in Pitinga.1,17 The presence of quartz as a definite crystalline phase in the diffractogram of the insoluble residue strongly suggests that silicon present in the sample was not fully converted into SiF4 by HF generated during cryolite reaction with sulfuric acid (reaction 3). This means that the generation and removal of HF from the vessel was faster than its reaction kinetics with SiO2 (reaction 3). Since microcline, polylithionite and zircon present in the original sample (Table 1) were not found in the insoluble residue (Figure 5), it is reasonable to conclude that such minerals were either decomposed by the sulfuric acid, e.g., for microcline:  or by the generated hydrogen fluoride:  Some of the AlF3 found in the diffractogram presented in Figure 5 may come from the above reaction. XRF data of the insoluble matter (Table 5) shows that fluorine comprises about 48 wt.% of the solid, thus agreeing with the fluorine-bearing minerals identified by XRD (Figure 5). Aluminum and sodium are also major components, once again in agreement with XRD data. The occurrence of calcium, iron, yttrium, magnesium and zirconium is in accordance with the average composition of the original samples (Table 1) and/or XRD data in Figure 5. Based on the SiO2 content in the insoluble matter (Table 5) and in the original samples (calculated from data in Table 1), it is possible to conclude that about 79% of silicon was converted into SiF4.
Fluoride recovery When the gaseous effluent was absorbed by cooled distilled water, a white deposit was formed at the outer edge of the flask. This solid corresponds to the SiO2 produced when SiF4 is hydrolyzed:  This reaction restores the fluorine lost (SiF4) as HF provided the white deposit is removed from the contact with aqueous HF in order to avoid production of soluble [SiF6]2- along time (reactions 3 and 4). As expected, pH is very acidic (1.5). After precipitation with CaCl2, the XRD pattern of the precipitate (Figure 6) shows a single crystalline phase corresponding to calcium fluoride. The amount recovered corresponds to 96 wt.% of the initial fluoride present in the samples (Table 2).
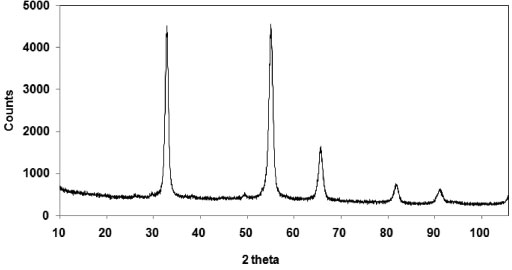 Figure 6. XRD pattern (Cu Kα radiation) of the solid after addition of CaCl2 to HF(aq.) after passing the gaseous effluent through distilled water cooled in an ice bath. The peaks represent calcium fluoride (CaF2)
CONCLUSION Cryolite samples from Pitinga MCD (Zone B) used in this study proved to be a convenient source of hydrogen fluoride upon leaching with sulfuric acid. 97 wt.% of the samples were leached under the best optimal conditions (140 ºC, 3-5 h). Fluorine was recovered as hydrogen fluoride with high yield (96 wt.%). The produced SiF4 was hydrolysable restoring fluorine in the aqueous HF solution. Temperature and time were found to be the most relevant reaction parameters during leaching. Liquid to solid ratio was not statistically significant in the investigated area. Further studies are in progress on the processing of the acidic leachate in order to recover REE, sodium sulfate and aluminum sulfate.
ACKNOWLEDGEMENT The authors thank Mineraçao Taboca S/A, particularly I. G. H. Dun and M. D. M. Garcia, for their support to visit Pitinga and supplying samples from the MCD. J. C. Afonso and R. Neumann acknowledge financial support by CNPq. J. F. Paulino acknowledges CAPES for a scholarship.
REFERENCES 1. Kahn, H.; Chaves, A. P.; Beneficiamento de Criolita Natural - Estado da Arte, Boletim Técnico da Escola Politécnica, Universidade de Sao Paulo, EPUSP: Sao Paulo, 1992. 2. Bastos Neto, A. C.; Pereira, V. P.; Ronchi, L. H.; Lima, E. F.; Frantz, J. C.; Can. Mineral. 2009, 47, 1329. DOI: http://dx.doi.org/10.3749/canmin.47.6.1329 3. Bastos Neto, A. C.; Ferron, J. T. M. M.; Chauvet, A.; Chemale Jr., Lima, E. F.; Barbanson, L.; Costa, C. F. M.; Precambrian Res. 2014, 243, 181. DOI: http://dx.doi.org/10.1016/j.precamres.2013.12.021 4. http://nepis.epa.gov/Exe/ZyPDF.cgi/200006B9.PDF?Dockey=200006B9.PDF, acessado em Março de 2016. 5. http://minerals.usgs.gov/minerals/pubs/commodity/fluorspar/myb1-2013-fluor.pdf, acessado em Março de 2016. 6. Brasil, Departamento Nacional de Produçao Mineral; Sumário Mineral 2014, DNPM: Brasília, 2014, p.74. 7. Aigueperse, J.; Mollard, P.; Devilliers, D.; Chemla, M.; Faron, R.; Romano, R.; Cuer, J. P.; Ullmann's Encyclopedia of Industrial Chemistry, Wiley-VCH: Weinheim, 2005, section 3.2. 8. Sampaio, J. A.; Baltar, C. A. M.; Andrade, M. C. Em Rochas e Minerais Industriais, usos e especificaçoes, 2ª ed; Luz, A. B., Lins, F. A. F., eds.; CETEM: Rio de Janeiro, 2008, cap.22. 9. http://www.essentialchemicalindustry.org/chemicals/hydrogen-fluoride.html, acessado em Março de 2016. 10. Genuino, H. C.; Opembe, N. N.; Njagi, E. C.; McClain, S.; Suib, S. L.; J. Ind. Eng. Chem. 2012, 18, 1529. DOI: http://dx.doi.org/10.1016/j.jiec.2012.03.001 11. Zanon, D.; Sperandio, C.; US pat. 3,199,952 1965. 12. Terase, N. K.; Hagita, S.; Yokoyama, K.; Sanada, Y.; Nagase, M.; Hirata, S.; US pat. 5,219,551 1993. 13. http://docslide.us/documents/hf-physical-properties.html, acessado em Março de 2016. 14. Mitchell, S. C. Em Molecules of Death, 2nd ed; Waring, H. R., Stevenson, B. G., Mitchell, S. C., eds.; Imperial College Press: London, 2007, cap. 7. 15. Brasil, Departamento Nacional de Produçao Mineral; Economia Mineral do Brasil, DNPM: Brasília, 2009, cap. 6. 16. Garcia, M. D. M.; V Brazilian Symposuim of Mineral Exploitation (SIMEXMIN), Ouro Preto, Brasil, 2012; www.adimb.com.br/simexmin2012/wp-content/themes/simexmin/palestras/06terras/VII_3_Garcia.pdf, acessado em Março de 2016. 17. Minuzzi, O. R. R.; Bastos Neto, A. C.; Formoso, M. L. L.; Andrade, S.; Janasi, V. A.; Flores, J. A.; An. Acad. Bras. Cienc. 2008, 80, 719. DOI: http://dx.doi.org/10.1590/S0001-37652008000400012 18. Pires, A. C.; Bastos Neto, A. C.; Pereira, V. P.; Botelho, N. F.; Minuzzi, O. R. R; Rev. Bras. Geocienc. 2006, 36, 155. 19. Bastos Neto, A. C.; Pereira, V. P.; Lima, E. F.; Ferron, J. M.; Minuzzi, O.; Prado, M.; Ronchi, L. H.; Flores, J.; Frantz, J. C.; Pires, A.; Pierosan, R.; Hoff, R.; Botelho, N. F.; Rolim, S. B.; Rocha, F. Em Caracterizaçao de depósitos minerais em distritos mineiros da Amazônia; Marini, O. J.; Queiroz, E. T.; Ramos, B. W., eds.; ADIMB/DNPM: Brasília, 2005, cap.VIII. 20. Aliaga, W.; Sampaio, C. H.; Brim, I. A. S.; Ferreira, K. R. S.; Batistella, M. A.; Miner. Eng. 2006, 19, 1393. DOI: http://dx.doi.org/10.1016/j.mineng.2006.02.002 21. Motoki, A.; Sichel, S. E.; Vargas, T.; Aires, J. R.; Iwanuch, W.; Mello, S. L. M.; Motoki, K. F.; Silva, S.; Balmant, A.; Gonçalves, J.; Geociências (Sao Paulo) 2010, 29, 291. 22. Cheary, R. W.; Coelho, A.; J. Appl. Crystallogr. 1992, 25, 109. DOI: http://dx.doi.org/10.1107/S0021889891010804 23. Rietveld, H. M.; J. Appl. Crystallogr. 1969, 2, 65. DOI: http://dx.doi.org/10.1107/S0021889869006558 24. Knorr, K.; Neumann, R.; Proceedings of the 10th International Congress for Applied Mineralogy, Berlin-Heidelberg, Germany, 2012. 25. Dejaegher, B.; Heyden, Y. V.; J. Pharm. Biomed. Anal. 2011, 56, 141. DOI: http://dx.doi.org/10.1016/j.jpba.2011.04.023 PMID: 21632194 26. Surhone, L. M.; Timpledon, M. T.; Marseken, S. F.; Pareto Analysis, VDM Publishing: Saarbrücken, 2010. 27. Guimaraes, F. M. G.; Bravo, P. S.; Ferreira, J. A.; Piedade, A. P.; Vieira, M. T. F.; IOP Conf. Ser.: Mater. Sci. Eng. (2014), doi: 10.1088/1757-899X/55/1/012006. DOI: http://dx.doi.org/10.1088/1757-899X/55/1/012006 28. Nagatsuka, K.; Ohtsuki, M.; Saito, M.; Yoshida, K.; Kawabe, K.; US pat. 4,988,872 1991. 29. Antipin, V. S.; Savina, E. A.; Mitichkin, M. A.; Geochem. Int. 2006, 44, 965. DOI: http://dx.doi.org/10.1134/S0016702906100028 30. Shchekina, T. I.; Gramenitskiy, E. N.; Alferyeva, Y. O.; Petrology 2013, 21, 454. DOI: http://dx.doi.org/10.1134/S0869591113040061 |
On-line version ISSN 1678-7064 Printed version ISSN 0100-4042
Qu�mica Nova
Publica��es da Sociedade Brasileira de Qu�mica
Caixa Postal: 26037
05513-970 S�o Paulo - SP
Tel/Fax: +55.11.3032.2299/+55.11.3814.3602
Free access


