Artigo
| High pressure behavior of crystalline dihydroxylammonium 5,5'-bistetrazole-1,1'-diolate: first-principles study |
|
Guozheng ZhaoI,II; Xilin YanIII,*
IKey Laboratory of Magnetic Information Materials Ministry of Education, Shanxi Normal University, Linfen 041004, PR China Recebido em 30/03/2017 *e-mail: linyxl_306@sina.com Density functional theory (DFT) periodic calculations were performed to study the geometrical and electronic structures of energetic compound dihydroxylammonium 5,5'-bistetrazole-1,1'-diolate (TKX-50) under the pressure ranging from 0 to 400 GPa. The optimized crystal structure by the local density approximation (LDA) with CA-PZ functional matches well with the experimental values under the ambient pressure. When the structural transformations occur under the pressure of 126, 288, and 334 GPa, with the pressure increasing, the lattice constants, unit cell volume, total energy, interatomic distances, bond angles, atomic charges, and bond populations of TKX-50 change gradually. First of all, TKX-50 is rearranged in the crystal and the improvement of the molecular planarity occurs. Next, structural transformation appears with the distortion of the tetrazole rings. Finally, the rotation of molecular conformation occurs. The results of the band gap and density of states show that TKX-50 crystal, with the increase of pressure, undergoes an electronic transition from the semiconductor to the metallic system. These results provide basic information for the high pressure behavior of crystalline TKX-50. INTRODUCTION High energetic compounds have been widely used in military and civilian applications.1-4 To meet the continuing need for novel high energetic compounds with high explosive performance and insensitivity, many scientists have paid considerable attention to the compounds' designing and synthesizing over several decades.5-7 Among various types of high energetic compounds, energetic ionic salts come to be a unique class of energetic compound and have received a substantial amount of interests due to their merits, such as low vapor pressures, favorable insensitivity, excellent explosive performance, and environmental acceptability.8,9 The energetic ionic salts of azoles, which are composed of high-nitrogen cations and anions, possess a large number of energetic N=N, N-N, C=N and C-N bonds. Therefore, they exhibit high energy and positive heats of formation.10-12 Compared with the others, the tetrazole cations or anions are more energetic owing to their higher nitrogen content.13 Klapötke et al.,14 detailed the preparation of a new explosive dihydroxylammonium 5,5'-bistetrazole-1,1'-diolate (TKX-50), which is not only easily prepared and exceedingly powerful (detonation velocity 9.70 km×s-1, detonation pressure 42.4GPa), but also possessing the required thermal insensitivity (decomposition onset 222 °C), low toxicity, and handling safety. Dreger et al.,15 presented vibrational and symmetry assignments and pressure-induced changes of the TKX-50's Raman modes. Luo et al.,16 investigated the structures, mechanical properties, and mechanical responses of TKX-50 and TKX-50 based PBX with molecular dynamics. Sinditskii et al.,17 reported the physico-chemical characterization (thermal decomposition under non- and isothermal conditions, enthalpy of formation, burning behavior and flame structure) of TKX-50. Goddard et al.,18 developed a flexible classical force field for TKX-50, which reproduces the cell parameters, densities, lattice energy and mechanical properties derived from quantum mechanics (QM) and experiments. Bernstein et al.,19 explored the decomposition of the energetic salts TKX-50 and MAD-X1 (dihydroxylammonium 3,3'-dinitro-5,5'-bis-1,2,4-triazole-1,1'-diol) following electronic excitation via nanosecond energy resolved spectroscopy. As a complex chemical behavior, it is challengable to investigate the microscopic properties of high energetic compounds. Meanwhile, the research of high energetic compounds under high pressures is an important part of experimental measurements. It is an effective way that theoretical calculation models the properties of energetic compounds in physical and chemical aspects to supplement experimental work.20,21 On the basis of the establishment of density functional theory method with pseudopotentials and a planewave of basis set, it has been applied successfully to investigate the structures and properties of energetic compounds under hydrostatic compression.22-24 Detailed information on the behavior of TKX-50 under high pressures is of great significance for the understanding of its chemical reactivity, detonation process, structural stabilities, and sensitivity. In the present work, the first principle periodic calculations were performed to study the crystal structure and properties of TKX-50 under hydrostatic pressure of 0-400 GPa.
COMPUTATIONAL METHODS The first-principle calculations were performed by using the DFT method in combination with the Vanderbilt-type ultrasoft pseudopotential and a plane-wave expansion of the wave functions.25 The self-consistent ground state of the system was determined by using a band-by-band conjugated gradient technique to minimize the total energy of the system with respect to the plane-wave coefficients. The electronic wave functions were obtained in a density-mixing minimization method26 for the self-consistent field calculation and the structures were relaxed using the Broyden, Fletcher, Goldfarb, and Shannon (BFGS)27 method. The local density approximation (LDA) with the Ceperley-Alder exchange-correlation potential parametrized by Perdew and Zunger (CA-PZ)28,29 implemented in the CASTEP30 module of Materials Studio 6.031 were used to perform the test calculations on crystalline TKX-50. The cutoff energy of plane waves was set to 340 eV. Brillouin zones sampling was performed by using the Monkhost−Pack scheme with a k-point grid of 3 × 1 × 2. The values of the kinetic energy cutoff and the k-point grid were determined to ensure the convergence of total energies. The initial crystal was taken from Klapötke et al. (CCDC 872232)14 and used for the computations. The TKX-50 crystallizes in monoclinic space group P21/c with a = 5.4260 Å, b = 11.6597 Å, and c = 6.5013 Å. Figure 1 displays crystal structure and atomic numbering of TKX-50. All the calculations are based on the same experimental crystal structure of TKX-50. The total energy of the system was converged less than 1.0 × 10⁻⁶ eV, the residual force less than 0.03 eV×Å-1, the displacement of atoms less than 0.001 Å, and the residual bulk stress less than 0.05 GPa. The experimental crystal structure of TKX-50 was first relaxed to allow the ionic configurations, cell shape, and volume to change at ambient pressure. The hydrostatic pressures of 1−400 GPa have been exerted on the unit cell without any symmetry constraints, and the pressure is applied equally in all directions to study the pressure effect on the geometrical and electronic structures of TKX-50.
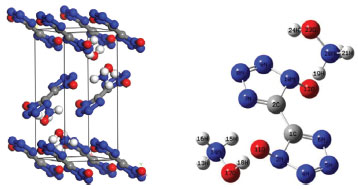 Figure 1. Crystal and molecular structures of TKX-50
RESULTS AND DISCUSSION Two different functionals, local density approximation (LDA) and generalized gradient approximation (GGA) were applied to the computation of crystalline TKX-50 as a test. To benchmark the performance of the theoretical approach, LDA/CA-PZ, GGA/PW91(Perdew−Wang-91),32 GGA/RPBE (Revised Perdew−Burke−Ernzerhof),33 and GGA/PBE (Perdew−Burke−Ernzerhof)34 were selected to fully relax the TKX-50 at ambient pressure without any constraint. Table 1 lists the experimental and relaxed cell parameters of TKX-50 crystal.
The relative errors of the calculated values to the experimental ones show that the calculated values of LDA/CA-PZ agree better with the experimental ones than those of GGA. The mean relative errors of relaxed lattice constants (a, b, and c) for the LDA/CA-PZ, GGA/PW91, GGA/RPBE, and GGA/PBE are -3.15%, 4.37%, 8.41%, and 4.30%, respectively. It shows that the accuracy of LDA is better than that of the GGA functional. Table 2 presents the bond lengths and bond angles along with the corresponding experimental data. Analysis of the results shows that the bond lengths and bond angles are consistent with the experimental values. The LDA/CA-PZ method is reasonably satisfactory for studying TKX-50 crystal. Thus, LDA/CA-PZ method has been employed in the present study.
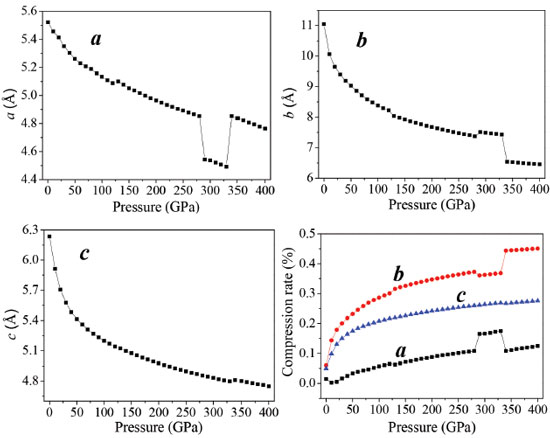
Crystal structure While the binding forces, which integrate molecules and atoms together, are changing, the external pressure will lead to structural changes in crystal materials. In general, compared with chemical bonds, intermolecular interactions are weaker and more compressible, hence it is the first structural response for an applied pressure to reduce structural voids in the crystal. Due to the conformational flexibility of molecule, phase transitions and the formation of denser packed materials are caused by the changes of the molecular conformation or structural transformation under higher pressure. The relaxed lattice constants (a, b, c) and compression rates in the pressure range of 0−400 GPa are depicted in Figure 2. The calculated lattice constants approximate the experimental values at ambient pressure. With the pressure increasing, the lattice constants (a, b, c) and unit cell volume decrease gradually. It is because the external pressure is large enough to overcome the intermolecular repulsion along the crystallographic directions and makes the crystal structure shrink. Consequently, the density and total energy increase correspondingly.35-37
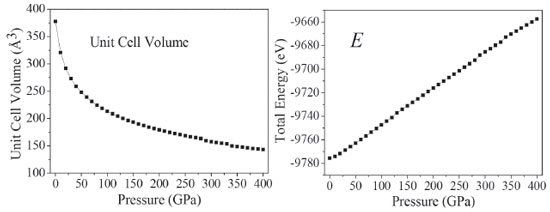
The curves a, b, and c have sudden changes in magnitudes at about 126, 288, and 334 GPa, which suggest large changes have taken place. The value of a at 126 GPa is anomalously larger than that at 125 GPa, and increases abnormally again at 334 GPa. At 126 GPa, b value is much smaller than that at 125 GPa, and decreases sharply at 334 GPa. During 150-250 GPa, the lattice constants (a, b, c) decrease steadily, while at 334 GPa c increases dramatically. The variations of crystal structure are presented in Figure 2S. It is found that molecular structure transformation occurs at 126, 288, and 334 GPa. Therefore, it results in large changes in crystal parameters. As is noted in Figure 1S, the largest compression of the unit cell takes place in the pressure region below 50 GPa. With the pressure increasing from 50 to 125 GPa, and from 130 to 280 GPa, the lattice parameters decrease slowly. In the pressure range of 0-280 GPa, the compression ratios along three directions are not tantamount. The one in b-direction is significantly greater than those in a- and c-directions in a sequence of b > c > a. At 80 GPa, the total compression ratios along the directions of a, b, and c are 6.9%, 28.8%, and 26.4%, respectively, which indicates that the compressibility of TKX-50 crystal is anisotropic and the structure is much stiffer in a direction than those in b and c directions. Figure 1S shows the perspective view of crystalline TKX-50 along three directions. In the pressure range of 280-400 GPa, in three directions the mutual repulsions are all strong and the unit cell is difficult to be compressed. Figure 3 presents the variations of the unit cell volume, and total energy of TKX-50 with the change of pressure. From Figure 3, the unit cell volume decreases gradually and correspondingly the crystal density increases as the pressure increases, and its ratio of total compression in the pressure range 0-400 GPa is 62.13%. The total energy (E) of the unit cell rises obviously with the pressure increasing. The closer molecules get with each other, the more the increment of intermolecular interaction is. Hypothesized explosion products are in the same normal condition, the E of an explosive is getting higher, the blasting energy emits more as well as explosive holds more power. It can be concluded that the pressure has positive correlation with density. Furthermore, detonation properties are intensified by the increment of density.
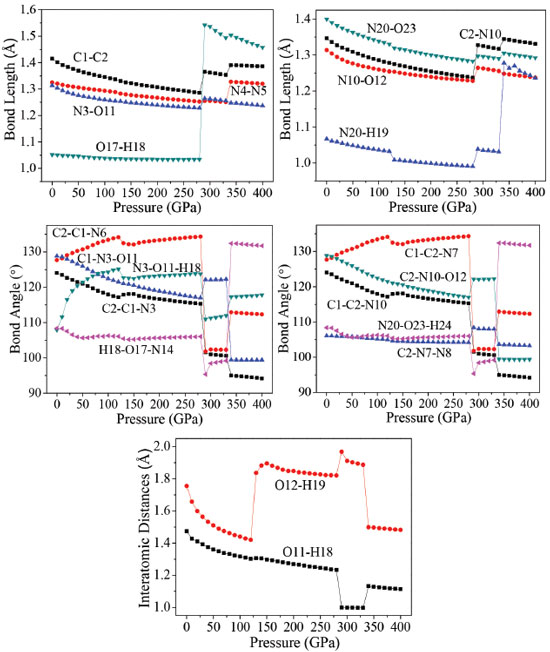
Molecular structure The effects of pressure on the main geometrical parameters are investigated in this section. Figure 4 presents the bond lengths, bond angles, and interatomic distance of O11-H18, and O12-H19 at different pressures. It is obvious that when the hydrostatic pressure increases from 0 to 120 GPa, the applied compression mainly squeezes out the intermolecular space and causes only a little change in intramolecular geometry. It is seen that the bond lengths of N4-N5, N3-O11, N20-H19, and N20-O23 decrease by 0.036, 0.059, 0.034, and 0.070 Å, respectively. Bonds C1-C2, N4-N5, N3-O11, C2-N10, N10-O12, N20-H19, N20-O23, and interatomic distances of O11-H18, O12-H19 shorten gradually, and O17-H18 bond is basically unchanged. However, when the pressure increases from 120 to 130 GPa, the interatomic distances O11-H18, and O12-H19 increases 0.0036 and 0.4166 Å, respectively. It can be seen easily that there is a change happened in a position of each crystal molecule. Figure 2S shows that how the trend of the unimolecular changes with the changing of pressures. The molecule is planar at 0 GPa. When the pressure increases to 200 GPa, the two tetrazole rings are approximately coplanar. However, at 288 GPa, the planarity of the ring is destroyed completely, and the molecular conformation is distorted. In addition, it is found in Figure 2S that the positions of the hydrogen atoms in amino group changed more obviously at both 126 and 288 GPa than at 100 and 200 GPa.
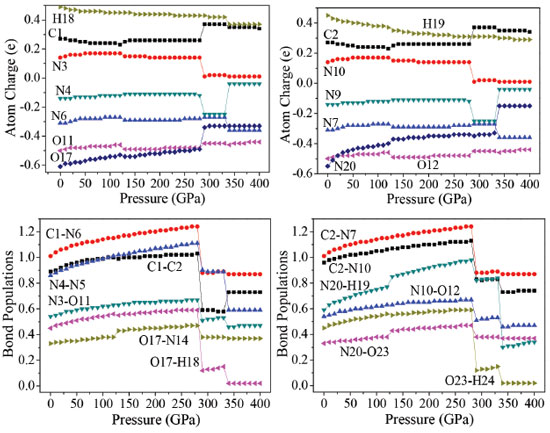
It is seen that the interatomic distances between O23 and H25 decreases from 0 to 126 GPa. This shows that the intramolecular H-bond strengthens with the increasing pressure. The length of intermolecular H-bond O12-H19 increases obviously at both 126 and 288 GPa, but decreases at 334 GPa. This indicates that the structural transformations which occurred at the former two pressures, weaken the intermolecular H-bond. For the latter pressure, the case is quite versa. At the same time, the length of H-bond O11-H18 increases at both 126 and 334 GPa, but decreases at 288 GPa, while the bond length of O17-H18 increases by 0.508 Å suddenly at 288 GPa, suggesting that the positions of oxygen atoms or the molecules in the crystal have changed abnormally here. When at 288 GPa, the bond lengths of C1-C2, O17-H18, C2-N10, and N20-H19 bonds increase significantly. The bond length of O17-H18 increases very obviously at 288 GPa which is caused by the distortion of the tetrazole rings. In addition, at 334 GPa, because of the rotation of molecular conformation, the bond lengths of N4-N5, and N20-H19 increase very obviously. That the C2−C1−N6, C2−C1−N3, N3−O11−H18, H18−O17−N14, C1−C2−N7, C1−C2−N10, and N20−O23−H24 angles change irregularly below 280 GPa is mainly caused by the structural transformations. For example, the N3−O11−H18 bond angle decreases by 2.5° from 125 to 126 GPa, suggesting that the positions of the molecules in the crystal are changed obviously. This is in agreement with the result observed from the bond lengths. From the change trend of bond angles, it is found that the C2−C1−N6, N3−O11−H18, and C1−C2−N7 bond angles increase gradually until 125 GPa, but decrease by 1.6°, 2.5°, and 1.6° at 126 GPa, respectively. This indicates that the position of each molecule in the crystal has changed with the pressure increasing to 125 GPa, but they improved much significantly at 126 GPa. In the pressure range of 130−280 GPa, they increase around 1.5° but change unexpectedly at 288 GPa from 134.3°, 123.7°, and 134.3° to 101.8°, 111.0°, and 101.8°, respectively. It is because the structural transformation occurs. When the pressure increases from 330 to 334 GPa, they change from 102.3°, 112.0°, and 102.3° to 112.9°, 117.3°, and 112.9°, respectively, which are caused by the distortion of the tetrazole rings. Overall, TKX-50 undergoes three structural transformations in the pressure range of 0−400 GPa. The first one occurs at 126 GPa with the rearrangement of the molecules in the crystal and the improvement of the molecular planarity. The second one occurs at 288 GPa with the distortion of the tetrazole rings. The last one occurs at 334 GPa with the rotation of the molecular conformation. The bond lengths and bond angles change irregularly at the three pressures. Electronic structure In order to have a better understanding of pressure's influence on electron density redistribution in the structural transformation, there will be a study on the variations of atom charges and bond populations with the increasing pressure.38-41 Figure 5 depicts the variation trends of several bonds' atomic charges and bond populations with pressure for crystalline TKX-50. When the pressure is below 120 GPa, the positive charges on N3, and N10 as well as the negative charges on N4, N6, N7, N9, N20, O11, O12, and O17 increase gradually, while the positive charges on C1, C2, H18, and H19 decrease with the increase of pressure. From 120 to 270 GPa, the atom charges change slightly and tend to be more delocalized. The biggest changes occur on N4 and N9. The negative charge on N4 and N9 at 288 GPa decrease abruptly by about 0.13 e, and at 334 GPa increase significantly about by 0.21 e. It is obvious that they undergo sudden changes at the pressure of 288, and 334 GPa, respectively, which suggests that large changes may take place.
With the pressure increasing, the bond populations of bonds C1-C2, C1-N6, C2-N7, C2-N10, N4-N5, N3-O11, N10-O12, O17-N14, O17-H18, N20-H19, N20-O23, and O23-H24 increase gradually. It is noteworthy that the value of bond populations of bonds O17-N14, N20-H19, and N20-O23 at 126 GPa increase abnormally; in the range of 127-280 GPa, the bond populations of these bonds increase steadily; at 288 GPa, the bond populations decrease markedly due to the significant changes; the biggest changes occur on C2-N10, N4-N5, O17-H18, N20-H19, and O23-H24. At 288 and 334 GPa, the bond populations of bonds C2-N10, N4-N5, O17-H18, N20-H19, and O23-H24 all have an abrupt decrease, while C1-C2 bond increase suddenly. For example, from 330 to 334 GPa, the bond population of C1-C2 rises from 0.58 to 0.73 and that of C1-N3 reduces from 0.83 to 0.73, which indicates that C1 transfers from N3 to C2. These suggest that large changes in crystalline form or molecular structure have happened at 126, 288, and 334 GPa, which is totally consistent with the illustration of the following section. The electronic band structure of a solid material plays an important role in its crystal structure and physical properties.42-44 On the basis of the equilibrium crystal structures obtained under different pressures, the self-consistent band structures along different symmetry directions of the Brillouin zone have been calculated and are shown in Figure 3S. In order to have a visualized view, there is merely a presentation of range from -2.0 to 5.0 eV. It is clear that as the pressure is raised, the energy bands of valence and conduction bands change in an obvious way. For example, if the pressure is less than 200 GPa, energy bands will be in a stable state and the intermolecular interactions are not obvious. Some important changes in the electronic properties can be got on the basis of the transformation in configuration of TKX-50 at 288 GPa. As is shown, the energy bands get to a higher energy region. That is to say, the conduction bands become wider, while the valence bands become narrower in comparison with the ones in lower pressures. Figure 6 displays the band gaps of TKX-50 under different pressures. As can be seen in Figure 6, with the pressure increasing from 0 to 285 GPa, the band gaps decrease sharply from 3.502 to 1.205 eV. TKX-50 crystal experienced an electronic transition from the semiconductor to the metallic system under compression, which means that the electrons are more likely to transfer from occupied valence bands to empty conduction bands under pressure. A significant reduction of band gap (0.430 eV) at 288 GPa is caused by the structural transformation. The tendency of band gap reduction is related to the decrease in intermolecular space, which leads to an increase of electron overlap between molecules in the system under compression. In a certain extent, with the pressure increasing, the decreasing gap will contribute to the increasing sensitivity on the basis of principle of the easiest transition of electrons.45 In the pressure range 290−330 GPa, their decreases are small (0.489−0.230 eV), indicating that the electron transitions are still very easy from occupied valence bands to empty conduction bands. When the pressure reaches 334 GPa, the band gap augments dramatically to 3.600 eV once again, even higher than that at 0 GPa, due to the deformation of tetrazole rings.
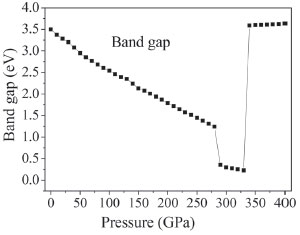 Figure 6. Band gap of crystalline TKX-50 as a function of pressure
In order to understand the bond nature and electronic structure of TKX-50 crystal at different pressures, we investigate its total density of states (DOS) and partial density of states (PDOS). DOS analysis may help us to better understand the change in electronic structure caused by external pressure.46 Figure 7 depicts the calculated DOS for TKX-50 crystal at different pressures. From Figure 7, as the pressure grows higher, the peaks becomes lower and wider. The curves of DOS have obvious peaks under low pressure, while the peaks become wider under higher pressure. The electrons present better mobility and moving freedom between the valence and conduction bands, hence, the TKX-50 crystal turns into metal under high pressure. That the conduction bands shift to the lower energy, not only reduces the band gap but also reveals a fact that the probability of electronic excitations are augmented by the crystal compression. On account of some broadening effect in DOS curves, they are confined at the Fermi energy level. In the lower pressure range, it can be easily drawn that the p states is the main character in the sharp peaks of valence and conduction band close to the Fermi level. That means p states possess an irreplaceable effect on the chemical reaction of TKX-50. As the pressure increases, s states become strengthened and also exert a great significance together with p states.
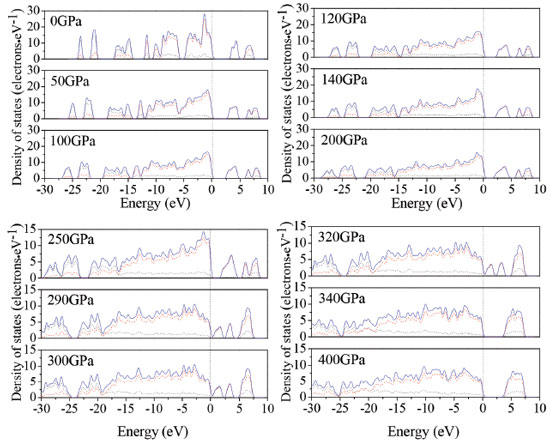 Figure 7. Calculated total DOS for TKX-50 at different pressures: s, p, and total states are shown as dotted, dashed, and solid curves, respectively
The atom-resolved DOS and PDOS of TKX-50 under pressure relate closely to the structural transformation. The DOS and PDOS at 126 and 288 GPa are shown in Figure 4S. At 126 GPa, the upper valence bands and the lower conduction bands are predominated by the p states of N atoms in tetrazole rings. While at 288 GPa, the upper valence bands and the lower conduction bands are mainly contributed to the N states in tetrazole rings. Furthermore, the N states in tetrazole rings move toward the Fermi level. The structural transformations occur due to the deformation of tetrazole rings.
CONCLUSIONS In this work, periodic first-principle calculations have been performed to study the effect of high pressure on the geometrical and electronic structures of the energetic salt TKX-50 under hydrostatic pressure of 0−400 GPa. The LDA/CA-PZ method has been employed in the present study. The optimized crystal structure by the LDA/CA-PZ method at ambient pressure, agrees better with the experimental constants than the other functionals. Pressure-induced molecular structure transformations occur at 126, 288, and 334 GPa. At 126 GPa, TKX-50 molecules in crystal are rearranged, and the molecular planarity are improved by the high pressure. With the pressure increasing, the molecular structure and unit cell parameters change gradually. The second structural transformation occurs at 288 GPa with the distortion of the tetrazole rings. When the pressure reaches as high as 334 GPa, the tetrazole ring is severely distorted, and a new structure appeared with the rotation of the molecular conformation. There are regular changes of the unit cell volumes, total energies, atomic charges, bond populations, band structures, band gaps, and density of states with the pressure increasing. While an abnormal change occurs at 126, 288, and 334 GPa, the structural transformations happen. The impact sensitivity of TKX-50 becomes much higher with the increment of pressure. An analysis of density of states shows that the interactions between electrons, especially for the valence electrons, are strengthened under the influence of pressure. This work will provide useful information in understanding the high-pressure's effect on the structural transformation.
SUPPLEMENTARY MATERIAL Figures 1S to 4S can be found at http://quimicanova.sbq.org.br in pdf format, with free access.
ACKNOWLEDGMENTS This work was supported by Scientific and Technologial Innovation Programs of Higher Education Institutions in Shanxi (No. 2016157), and National Natural Science Foundation of China (No. 11302198).
REFERENCES 1. Forquet, V.; Sabate, C. M.; Chermette, H.; Jacob, G.; Labarthe, E.; Delalu, H.; Darwich, C.; Chem-Asian J. 2016, 11, 730. 2. Kirchhof, E.; Rocha, R. J.; Nakamura, N. M.; Lapa, C. M.; Pinheiro, G. F. M.; Goncalves, R. F. B.; Rocco, J. A. F. F.; Iha, K.; Quim. Nova 2016, 39, 661. 3. Zhao, G. Z.; Lu, M.; J. Energ. Mater. 2017, 35, 63. 4. Keshavarz, M. H.; Esmaeilpour, K.; Oftadeh, M.; Abad, Y. H.; RSC Adv. 2015, 5, 87392. 5. Meng, L. Y.; Lu, Z. P.; Wei, X. F.; Xue, X. G.; Ma, Y.; Zeng, Q.; Fan, G. J.; Nie, F. D.; Zhang, C. Y.; CrystEngComm 2016, 18, 2258. 6. He, P. A.; Zhang, J. G.; Wang, K.; Yin, X.; Zhang, T. L.; J. Org. Chem. 2015, 80, 5643. 7. Myers, T. W.; Bjorgaard, J. A.; Brown, K. E.; Chavez, D. E.; Hanson, S. K.; Scharff, R. J.; Tretiak, S.; Veauthier, J. M.; J. Am. Chem. Soc. 2016, 138, 4685. 8. Yin, P.; He, C. L.; Shreeve, J. M.; Chem. Eur. J. 2016, 22, 2108. 9. Ghosh, J.; Bhattacharya, A.; Chem. Phys. 2016, 464, 26. 10. Yin, P.; Parrish, D. A.; Shreeve, J. M.; J. Am. Chem. Soc. 2015, 137, 4778. 11. Abe, T.; Tao, G. H.; Joo, Y. H.; Winter, R. W.; Gard, G. L.; Shreeve, J. M.; Chem. Eur. J. 2009, 15, 9897. 12. Klapötke, T. M.; Sabate, C. M.; Eur. J. Inorg. Chem. 2008, 34, 5350. 13. Fischer, D.; Klapötke, T. M.; Stierstorfer, J.; Angew. Chem. Int. Ed. 2015, 54, 10299. 14. Fischer, N.; Fischer, D.; Klapötke, T. M.; Piercey, D. G.; Stierstorfer, J.; J. Mater. Chem. 2012, 22, 20418. 15. Dreger, Z. A.; Tao, Y. C.; Averkiev, B. B.; Gupta, Y. M.; Klapötke, T. M.; J. Phys. Chem. B 2015, 119, 6836. 16. Ma, S.; Li, Y. J.; Li, Y.; Luo, Y. J.; J. Mol. Model. 2016, 22, 43. 17. Sinditskii, V. P.; Filatov, S. A.; Kolesov, V. I.; Kapranov, K. O.; Asachenko, A. F.; Nechaev, M. S.; Lunin, V. V.; Shishov, N. I.; Thermochim. Acta. 2015, 614, 85. 18. An, Q.; Cheng, T.; Goddard, W. A.; Zybin, S. V.; J. Phys. Chem. C 2015, 119, 2196. 19. Yuan, B.; Yu, Z. J.; Bernstein, E. R.; J. Phys. Chem. A 2015, 119, 2965. 20. Chen, P. Y.; Zhang, L.; Zhu, S. G.; Cheng, G. B.; Def. Technol. 2015, 11, 132. 21. Liu, Y.; Zhan, L.; Wang, G. X.; Wang, L. J.; Gong, X. D.; J. Phys. Chem. C 2012, 116, 16144. 22. Wu, Q.; Chen, H.; Xiong, G. L.; Zhu, W. H.; Xiao, H. M.; J. Phys. Chem. C 2015, 119, 16500. 23. Xiang, F.; Wu, Q.; Zhu, W. H.; Xiao, H. M.; Struct. Chem. 2014, 25, 1625. 24. Liu, Y.; Gong, X. D.; Wang, L. J.; Wang, G. X.; J. Phys. Chem. C 2011, 115, 11738. 25. Vanderbilt, D.; Phys. Rev. B 1990, 41, 7892. 26. Kresse, G.; Furthmuller, J.; Phys. Rev. B 1996, 54, 11169. 27. Fletcher, R.; Practical Methods of Optimization, Wiley: New York, 1980. 28. Ceperley, D. M.; Alder, B. J.; Phys. Rev. Lett. 1980, 45, 566. 29. Perdew, J. P.; Zunger, A.; Phys. Rev. B 1981, 23, 5048. 30. Clark, S. J.; Segall, M. D.; Pickard, C. J.; Hasnip, P. J.; Probert, M. J.; Refson, K.; Payne, M. C.; Z. Kristallogr. 2005, 220, 567. 31. Materials Studio 6.0, Accelrys, 2012. 32. Perdew, J. P.; Wang, Y.; Phys. Rev. B 1992, 45, 13244. 33. Hammer, B.; Hansen, L. B.; Norskov, J. K.; Phys. Rev. B 1999, 59, 7413. 34. Perdew, J. P.; Burke, K.; Ernzerhof, M.; Phys. Rev. Lett. 1996, 77, 3865. 35. Kamlet, M. J.; Jacobs, S. J.; J. Chem. Phys. 1968, 48, 23. 36. Keshavarz, M. H.; Esmailpour, K.; Zamani, M.; Roknabadi, A. G.; Propellants, Explos., Pyrotech. 2015, 40, 886. 37. Yu, Q.; Wang, Z. X.; Wu, B.; Yang, H. W.; Ju, X. H.; Lv, C. X.; Cheng, G. B.; J. Mater. Chem. A 2015, 3, 8156. 38. Davidson, E. R.; Chakravorty, S.; Theor. Chim. Acta. 1992, 83, 319. 39. Segall, M. D.; Pickard, C. J.; Shah, R.; Payne, M. C.; Mol. Phys. 1996, 89, 571. 40. Segall, M. D.; Shah, R.; Pickard, C. J.; Payne, M. C.; Phys. Rev. B 1996, 54, 16317. 41. Winkler, B.; Pickard, C. J.; Segall, M. D.; Milman, V.; Phys. Rev. B 2001, 63, 214103. 42. Bag, P.; Itkis, M. E.; Stekovic, D.; Pal, S. K.; Tham, F. S.; Haddon, R. C.; J. Am. Chem. Soc. 2015, 137, 10000. 43. Konyk, M.; Romaka, L.; Demchenko, P.; Romaka, V. V.; Stadnyk, Y.; Horyn, A.; J. Alloy Compd. 2014, 589, 200. 44. Hatcher, P. V.; Reibenspies, J. H.; Haddon, R. C.; Li, D. W.; Lopez, N.; Chi, X. L.; CrystEngComm 2015, 17, 4172. 45. Xiao, H. M.; Li, Y. F.; Sci. China: Chem. 1995, 38, 538. 46. Saoud, F. S.; Plenet, J. C.; Henini. M.; J. Alloy Compd. 2015, 619, 812. |
On-line version ISSN 1678-7064 Printed version ISSN 0100-4042
Qu�mica Nova
Publica��es da Sociedade Brasileira de Qu�mica
Caixa Postal: 26037
05513-970 S�o Paulo - SP
Tel/Fax: +55.11.3032.2299/+55.11.3814.3602
Free access


