Artigo
| Alternative source apportionment in the surrounding region of a large steel industry applying Tillandsia usneoides as biomonitor |
|
Laura Benevides dos Santos; Ana Cristina Almeida; Jose Marcus Godoy*
Departamento de Química, Pontifícia Universidade Católica do Rio de Janeiro, Rua Marques de São Vicente 225, Gávea, 22451-900 Rio de Janeiro - RJ, Brasil Recebido em 11/05/2017 *e-mail: jmgodoy@puc-rio.br From the beginning of its operation, this large steel industrial complex in the Santa Cruz Industrial District, Rio de Janeiro, Brazil, with an annual capacity of 5 million tons, has been at the center of controversy related to its atmospheric emissions. Since the air filter used for its routine air particulate monitoring network is not appropriate for a source apportionment study, biomonitoring was tested as an alternative way to carry out this evaluation. Thus, the bromeliad species Tillandsia usneoides was used as a bioindicator in the Santa Cruz Industrial District, Rio de Janeiro, Brazil. Six samplings were performed over a period of approximately one year. The results showed that the sampling point located inside the industrial complex presented higher elemental concentration values for all samples. Among the quantifiable elements found in the biomonitor samples, iron seems to be the element that best represents the emissions from the steelwork complex, which was corroborated based on the analysis of dust jar samples collected inside the complex area. INTRODUCTION Over time, atmospheric pollution has intensified due to increased industrialization, vehicle traffic, forest fires and other factors of anthropogenic influence. Air pollution is a critical problem that can affect human health and well-being, especially in more urbanized areas.1 Thus, constant monitoring of such emissions in order to ensure that air quality is within acceptable standards is required. Biomonitors (or bioindicators) can be defined as organisms (a part of an organism or a population of organisms) that are able to provide information on environmental quality. Biomonitoring is the continuous observation of an area or region with the help of bioindicators. Bioindicators can be very useful due to their sensitivity to a wide range of substances, either because of their tolerance for high levels of an accumulated substance in their tissues over an extended time period or to integrate their influence in an area of known and relevant size.2 The species of bromeliad (Bromeliaceae ) Tillandsia usneoides L., also known as Spanish moss, is an aerial epiphyte, meaning that it has the ability to get water and nutrients directly from the air. Root development in this species is sporadic or virtually nonexistent. Usually, this species inhabits the treetops or is found on some type of inert substrate, using these as physical supports. Due to its structural features, this species has the ability to accumulate pollutants present in the atmosphere. It adapts easily to hot and dry regions and has been widely used as a bioindicator in South America, mainly Argentina, Brazil and Mexico.2-6 Biomonitoring using moss bags has been successfully applied for the environmental monitoring of several industrial sites, such as a chlor-alkali plant,7 a cement plant,8 petrochemical facilities,9 industrial sites,10 a solid waste incinerator,11 steelworks,12 and a highway.13 After its installation, the steelwork complex has been at the center of environmental concerns related to the release of particulate material. The communities around it often complain about large deposition of particulate material in their yards. The existing environmental monitoring program involves the measurement of the PM10 concentration but not of its chemical composition. The steelwork`s air particulate samplers use glass fiber filters which contain several other materials in order to improve the physical resistance and, as a consequence, have a very high content of elements such as aluminum, iron and zinc.14 Consequently, an alternative was needed in order to evaluate the composition of the particulate material and its eventual correlation with the steelwork`s particulate emissions. Therefore, this study aimed to evaluate the applicability of the bromeliad Tillandsia usneoides L. as a bioindicator for air quality in the region surrounding the steelwork complex and as an alternative for aerosol source apportionment.
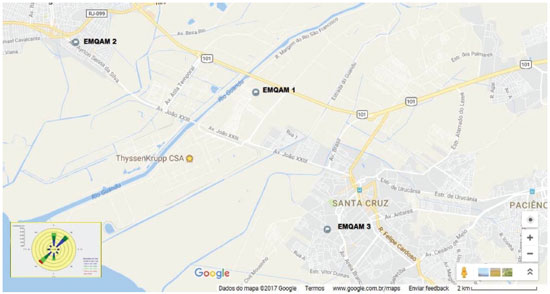
EXPERIMENTAL The study was carried out in the region around the steelwork complex, which is an export oriented steel complex with a nominal annual capacity of 5 million tons of steel that began operating in 2010. In addition to the steel plant itself, the complex also contains a 490 MW coal power plant. The complex is located in the Santa Cruz Industrial District, which belongs to Rio de Janeiro County, and is situated on the border area between Rio de Janeiro and Itaguaí counties. In its vicinity are the Condominium João XXIII, which is a residential complex, and the center of Santa Cruz, which is characterized by the presence of residences and a commercial area. The area also has roads with heavy car, bus, and truck traffic, such as the Rio-Santos highway and Brasil Avenue. Monitoring was done at the locations where steelwork company had installed stations for its air quality monitoring program. The coordinates and spatial locations can be seen in Table S1 and Figure 1.
The specimens of Tillandsia usneoides L. were collected on the campus of the Pontifical Catholic University of Rio de Janeiro (PUC-Rio), located in the neighborhood of Gávea in Rio de Janeiro, where there are remains of Atlantic Forest vegetation. This point was considered the control point. At the laboratory, the specimens were washed with deionized water and, soon after, were dried with paper towels. Subsequently, portions were weighed, and these were placed in nylon mesh bags, where each net contained five (5) grams of the plant. The washing procedure was carried out only at this step, which means, before the sampling period. At each monitoring point and the control point, a bamboo tripod system was installed, with the upper end of the tripod having two rods. A nylon mesh bag with Tillandsia usneoides L was placed in each rod, for a total of six (6) bags per monitoring point (Figure 2). These samples were exposed for approximately eight to twelve weeks (Table 2). In general, the sampling procedure and sample treatment followed those described by Ares et al.15 and Capozzi et al.16 After this period, new bags were installed and the old bags were taken to the laboratory where they passed through the drying process in a desiccator for two weeks to reach a constant weight. The next step was the grinding process, in which the content of the nylon bags present on each tripod tip were crushed in pairs. The product of this step was a composite sample, with each monitoring point providing three (3) composite samples.
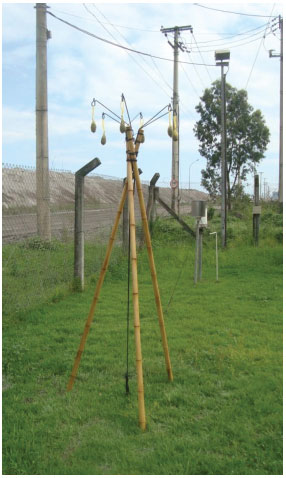 Figure 2. Sampler installed at the Steelwork`s Meteorological Station
From each composite sample, three (3) aliquots of 0.5 gram were weighed out, with a total of nine (9) aliquots per monitoring point. These aliquots were treated with 5 mL sub-distilled concentrated nitric acid for a period of 24 hours at room temperature and further heated at 80 ºC during 3 hours. After cooling, it was added 0.5 mL H2O2 30% (pro analysis Merck) and heated during 1 hour. The residue was removed by centrifugation and added water quality Milli-Q® up to a final volume of 20 mL. The trace elements determination was carried out using Inductively Coupled Plasma Mass Spectrometry (ICP-MS) Agilent, model 7500ce, equipped with an octopole reaction system (ORS), a low-flow nebulizer (MicroMist) connected to a quartz nebulizer chamber (Scott) mounted on a Peltier block, which was kept at 2 ºC, and a quartz torch with a 2.5 mm diameter injector. Nickel sampler and skimmer cones were utilized. For those elements presented at higher concentration, as Al and Fe, it was applied a 1:1000 dilution, whereas for those elements presented at lower concentration, as V and Cr, the dilution factor applied was 1:100. Additional operational conditions are given in Table 2S. The result for each monitoring point and exposure period was calculated based on the median of the nine aliquots for that monitoring point. Aliquots of certified reference materials Peach Leaves (NIST SRM 1547) and Tomato Leaves (NIST SRM 1573a) were simultaneously analyzed and are presented on Table 3S, in general, recoveries above 90% were obtained. However, for iron, in particular, the recovery was 75% but, as it was quite constant, it should have no effect for source apportionment purposes. With the results obtained after each exposure period, the Enrichment Factor (EF) was calculated for each monitoring point and for each element. For this study, we considered enrichment factors with values above 100 as significant, meaning a concentration twice that of the control point. The enrichment factor was obtained using the following formula.  where: EFE = Enrichment Factor of the Element (E); CEA = Concentration of the Element (E) in the sample; CEC = Concentration of the Element (E) in the control sample The results of the elemental analyses of approximately 80 monthly samples of dust collected with deposition jars installed inside the steelwork complex were obtained directly from the company and were used to obtain a comparison with the biomonitoring results. The correlation between the elemental and sampling sites was tested using cluster analysis. Figure 1S shows the daily precipitation and sampling periods (red bars), it can be observed that rainfall occurred in all the sampling periods.
RESULTS AND DISCUSSION The results obtained for the samples from the four monitoring stations and the control station (PUC-Rio) are presented in Tables 4S-9S of the Supplementary Material, and the calculated enrichment factors are shown in Tables 10S-15S, where the bold values represent those higher than 100. Taking the values obtained for EMTKCSA 4, the meteorological station sampling point installed inside steelwork and close to its slag deposition area, as a reference, the elements V, Cr, Mn and Fe were those which systematically showed the highest enrichment factors. Figure 3 shows the variations in the enrichment factor (EF) values obtained for these four elements during the six sampling periods. Considering the distance from the steelwork and the main wind direction (Figure 1), the expected sequence in terms of EF to the stations located outside the steelwork complex should be EMQAM 1> EMQAM 2> EMQAM 3. In general, only points 1 and 3 presented EF (%) greater than 100, and the observed sequence, EMQAM 3> EMQAM 1> EMQAM 2, did not follow the expected one, indicating that for the stations located outside the steelwork complex others sources must be taken into account as vehicular traffic and soil resuspension.
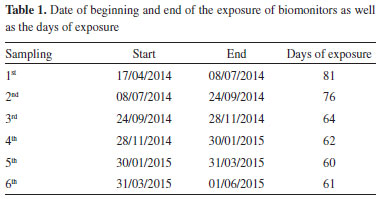
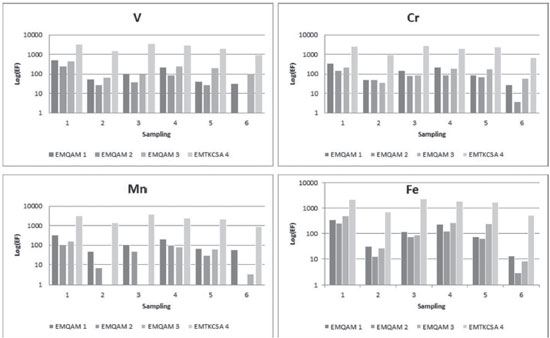 Figure 3. Variations in Enrichment Factor (EF) for the elements V, Cr, Mn and Fe at the four sampling stations over the present study
The 1st sampling campaign enrichment factor (EF) was much higher than the five others for all studied elements. Figure 2S exemplify for two elements, iron and lead, that, while the elemental concentration on the samples from the control point, PUC-Rio, were relatively constant, large variation were observed on the samples from the steelwork monitoring network and, as the elemental concentration during the first campaign were the highest obtained, large variation were also observed with the EF. A Pearson correlation analysis between the elemental concentrations of the samples of the three points of the steelwork monitoring network and of the meteorological station was performed (Table 16S). It is possible to verify the existence of several correlations such as Fe-Mn, as well as others also involving trace-elements, e.g., V-Cr-Ni-Cu. The cluster analysis shows iron as a separate variable, which is consistent with the fact that iron is a key element emitted by steelwork complex, and all the other elements together form another cluster (Figure 4). When data of the PUC-Rio station (control station) is included in the cluster analysis, a higher resolution is observed among the clusters, with a cluster of crustal elements, Fe, Mn and some trace elements; a cluster of trace elements as Zn, Pb and Ni; and another cluster with Al and Ti, and Ba and Cu as isolate elements (Figure 5). Cluster analysis by element was also carried out using the results of the dust jars samples (Figure 6), showing iron forming as a separate group but associated with Ni, as well as the existence of other groups, e.g., Na-Cl-K indicating the influence of sea aerosols, Ca-Mg-Al-Ti derived from the slag material and V-Cr from vehicular sources.
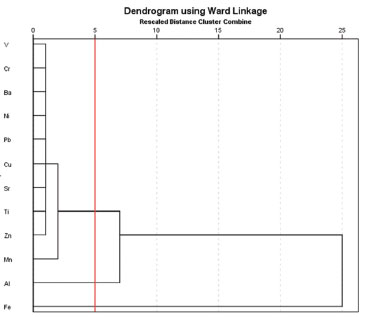 Figure 4. Dendrogram representing the grouping of elements based on the results of the three monitoring stations and meteorological station
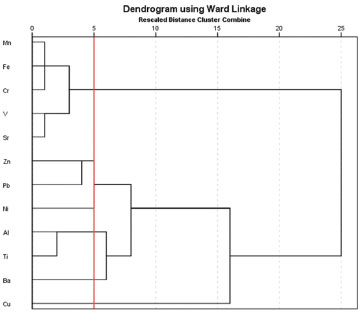 Figure 5. Dendrogram representing the grouping of elements based on the results of the three monitoring stations, the meteorological station and the control station (PUC-Rio)
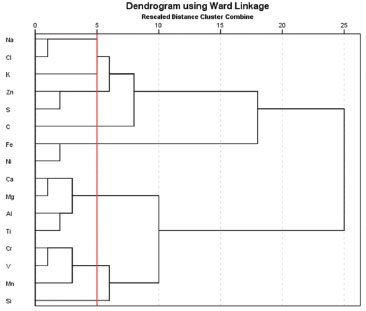 Figure 6. Dendrogram representing the grouping of elements based on the results of dust collectors installed inside the steelwork complex
When the clustering is performed by samples, it was verified that the samples of the meteorological station formed a separate cluster from the one that contained the samples of the three steelwork environmental monitoring stations combined with the control station samples (PUC-Rio). It was also observed that this second cluster is sub-divided according to the sampling period, with a "subcluster" involving, mainly, the 1st sampling campaign results of the steelwork monitoring stations (Figure 7), when the highest concentrations were observed for these stations. It was not verified a correlation between precipitation and the concentration, since the 2nd highest concentrations were observed during the 5th sampling campaign when the highest accumulate precipitation was verified.
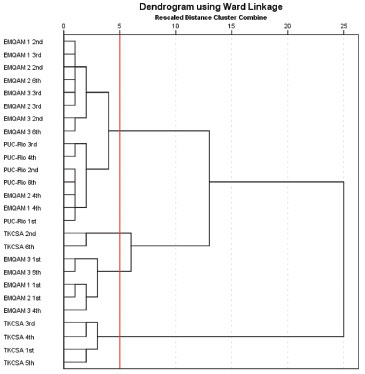 Figure 7. Dendrogram representing the grouping sample based on the results of the three monitoring stations, the meteorological station and control station (PUC-Rio)
The difference between the correlations for the biomonitoring samples and dust collectors can be seen in Figures 8 a-d, showing the Fe-Mn and Cr-V plots for these two types of samples. A different behavior for Fe-Mn in the dust samples collected inside the steelwork complex area and the biomonitors can be seen that contrasts to the behavior observed for V-Cr. Iron and manganese, which represent more localized sources, such as soil resuspension and the ore stock piles inside the plant, did not present a general trend, indicating the existence of more than one source, while V-Cr, related to vehicular traffic, had one common source for dust collectors and biomonitoring samples and also for all sampling stations.
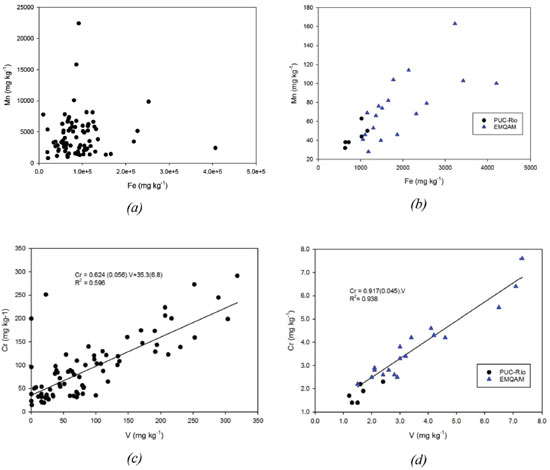 Figure 8. Fe-Mn and V-Cr relationship in the dust jars samples (a) and (c) and biomonitors (b) and (d), respectively
CONCLUSION This study evaluated the biomonitoring of air quality in a region surrounding a large steelwork industrial complex, located in the neighborhood of Rio de Janeiro. The bromeliad Tillandsia usneoides L. was used as a bioindicator for metal determination. Six sampling campaigns were carried out between April 2014 and June 2015, involving four monitoring points, of which three matched the stations of the steelwork`s network for monitoring air quality and another one was inside the complex, and a control point located on the campus of PUC-Rio. The results showed that the meteorological station sampling point, located inside the steelwork complex, presented percent enrichment factors above 100 for all samples. The expected sequence, in terms of Enrichment Factor, for the stations located outside the steelwork complex was EMQAM 1> EMQAM 2> EMQAM 3. However, the observed sequence, EMQAM 3> EMQAM 1> EMQAM 2, did not follow the expected one. The cluster analysis by sampling station showed a similarity between the results obtained for the three steelwork complex network stations and the control station, whereas the samples from to the meteorological station formed a separate group. Among the quantifiable elements found in the bioindicator samples, iron seems to be the element that best represents the emissions from the steelwork complex. This conclusion is supported by the results obtained for dust jars from inside the steelwork complex, where iron appears as an isolated element associated only with nickel. Based on the obtained results, it was possible to observe the potential of Tillandsia usneoides L. species as a bioindicator for air quality in the vicinity of a steel industrial complex. The results demonstrated that this species responded positively to exposure in an industrial area subject to atmospheric emissions. It can be considered a good alternative monitoring method due to its metal accumulation capacity, easy adaptation to the environment, means of obtaining nutrients, and low cost of deployment compared to traditional techniques for monitoring air quality.
SUPPLEMENTARY MATERIAL Additional tables and figures are free available, as PDF file, at http://www.quimicanova.sbq.org.br.
ACKNOWLEDGMENT The authors would like to acknowledge the Conselho Nacional de Desenvolvimento Científico e Tecnológico (CNPq) for the first author's scholarship and the Thyssenkrupp Companhia Siderúrgica do Atlântico (TKCSA) for support allowing access to its installations. The authors would like also to acknowledge the anonymous reviewers who have helped to improve the initial manuscript.
REFERENCES 1. Vianna, N. A.; Gonçalves, D.; Brandão, F.; Barros, R. P.; Amado Filho, G. M.; Meire, R. O.; Torres, J. P. M.; Malm, O.; D'Oliveira Junior, A.; Andrade L. R. ; Environ. Sci. Pollut. Res. 2011, 18, 416. 2. Figueiredo, A. M. G.; Nogueira, C.A.; Saiki, M.; Milian, F. M.; Domingos, M.; Environ. Pollut. 2007, 145, 279. 3. Figueiredo, A. M. G.; Alcalá, A. L.; Ticianelli, R. B.; Domingos, M.; Saiki, M.; J. Radioanal. Nucl. Chem. 2001, 259, 59. 4. Alves, E. S.; Moura, B. B.; Domingos, M.; Water Air Soil Pollut. 2008, 189, 61. 5. Martinez-Carrillo, M. A.; Solís, C.; Andrade, E.; Isaac-Olivé, K.; Rocha, M.; Murillo, G.; Beltrán-Hernández, R. I.; Lucho-Constantino, C. A.; Microchem. J. 2010, 96, 386. 6. Giampoli, P.; Wannaz, E. D.; Tavares, A. R.; Domingos, M.; Chemosphere 2016, 149, 14. 7. Calasans, C. F.; Malm, O.; Sci. Total Environ. 1997, 208, 165. 8. Alves, E. S.; Moura, B. B.; Domingos, M.; Water Air Soil Pollut. 2008, 189, 61. 9. Cortis, P.; Vannini, C.; Cogoni, A. S.; Mattia, F.; Bracale, M.; Mezzasalma, V.; Labra, M.; Environ. Sci. Pollut. Res. 2016, 23, 2288. 10. Culicov, O. A.; Zinicovscaia, I.; Duliu, O. G.; Environ. Contam. Toxicol. 2016, 96, 650. 11. Ventura, L. M. B.; Amaral, B. S.; Wanderley, K. B.; Godoy, J. M.; Gioda, A.; J. Braz. Chem. Soc. 2014, 25, 1571. 12. Lage, J.; Wolterbeek, H. Th.;Reis, M. A.; Chaves, P. C.; Garcia, S.; Almeida, S. M.; J. Radioanal. Nucl. Chem. 2016, 309, 397. 13. Cardoso-Gustavson, P.; Fernandes, F. F.; Alves, E. S.; Victorio, M. P.; Moura, B. B.; Domingos, M.; Rodrigues, C. A.; Ribeiro, A. P.; Nievola, C. C.; Figueiredo, A. M. G.; Environ Sci Pollut. Res. 2016, 23, 1779. 14. Paoli, L.; Munzi, S.; Guttová, A.; Senko, D.; Sardella, G.; Loppi, S.; Ecol. Indic. 2015, 52, 362. 15. Ares; A.; Aboal; J. R.; Carballeira, A.; Giordano, S.; Adamo, P.; Férnandez, J. A.; Sci. Total Environ. 2012, 432, 143. 16. Capozzi, F.; Giordano, S.; Aboal, J. R.; Adamo, P.; Bargagli, R.; Boquete, T.; Di Palma, A.; Real, C.; Reski, R.; Spagnuolo, V.; Steinbauer, K.; Tretiach, M.; Varela, Z.; Environ. Pollut. 2016, 214, 362. |
On-line version ISSN 1678-7064 Printed version ISSN 0100-4042
Qu�mica Nova
Publica��es da Sociedade Brasileira de Qu�mica
Caixa Postal: 26037
05513-970 S�o Paulo - SP
Tel/Fax: +55.11.3032.2299/+55.11.3814.3602
Free access


