Artigo
| Evaluating the accumulation trend of L-DOPA in dark-germinated seeds and suspension cultures of Phaseolus vulgaris L. by an efficient UV-spectrophotometric method |
|
Samira Rahmani-NezhadI; Shima DianatI; Mina SaeediI,II; Maliheh Barazandeh TehraniIII; Adel GhadiriIV; Abbas HadjiakhoondiI,V,*
I. Medicinal Plants Research Center, Faculty of Pharmacy, Tehran University of Medical Sciences, Tehran, Iran Recebido em 30/08/2017 *e-mail: drabbhadji@gmail.com Seed germination and plant cell cultures provide an alternative mean for producing secondary metabolites. The present study is an attempt to evaluate the effect of seed dark germination and some elicitors and precursors on the production of L-DOPA in Phaseolus vulgaris L. Callus cultured on Murashige and Skoog medium supplemented with various concentrations of different plant growth regulators. L-DOPA produced was quantified by UV-spectrophotometric method. In this study, a user-friendly, quick, and economical UV-spectrophotometric method was described to determine L-DOPA content in extracts from 33 biotypes of Phaseolus vulgaris L. The method is based on the nitrosation of L-DOPA to form a yellow solution and then formation of a red solution by adding base which is measurable at 470 nm. According to our statistical studies, this method showed high efficiency and selectivity for quantitative determination of L-DOPA in herbal extracts from dried plant seeds, dark-germinated seeds and callus cultures. L-DOPA content in dark-germinated seeds and suspension cultures increased significantly to approximately several-fold compared to the control. The implication from this study is that elicitor treatment and precursor feeding of Phaseolus vulgaris L. can significantly improve the parkinson's relevant L-DOPA content. INTRODUCTION Parkinson's disease is a chronic central nervous system disorder caused by the progressive death of dopamine-producing nerve cells in the basal ganglia of the brain. This leads to an imbalance between dopamine and acetylcholine with probable decrease of dopamine in the brain.1 L-DOPA or levodopa (3,4-dihydroxy-L-phenylalanine) is an effective and standard drug therapy for the control of symptoms in patients with Parkinson's disease. It is orally administered amino acid that passes through the blood brain barrier (BBB) easily and converts to dopamine.2 L-DOPA, as a secondary metabolite, was first isolated from the fruit of Vicia faba.3 Stizolobium deeringianum and Mucuna pruriens have also been reported as natural sources of levodopa, besides broad bean. Mucuna pruriens beans have been used as an efficacious herbal drug for PD treatment in India for many years.4 L-DOPA is accumulated in large amounts in some legumes which has led to use various techniques to enhance it; for example seed germination, UV or microwave treatment of dry seeds, solidstate bioconversion system using the food grade fungus Rhizopus oligosporus and plant cell as well as tissue culture.5 Each of these conditions can significantly improve the phenolic antioxidant activity and L-DOPA content. Quantitative determination of L-DOPA in its dosage form has been continuously considered in the literature, since L-DOPA can be oxidized rapidly in the presence of moisture or atmospheric oxygen and reduce its activity. In this regard, various analytical methods such as HPLC technique with diode-array, fluorescence, electrochemical and UV-detection,6-17 1H-NMR analysis,18 chemiluminescence,19 spectrofluorimetry,20 ion-exchange column chromatography,21 HPTLC,22 gas chromatography,23 radioimmunoassay,24 titrimetric,25 voltametric determination,26 electrochemistry methods,27 potentiometry,28 LC-MS-MS,29 and TLC have been developed.30 However, most of these methods are complex and hence lack the simplicity needed for routine applications. They usually need cumbersome, expensive or sophisticated instruments, and precise control through the experimet. The use of UV-Vis spectrophotometry and colorimetric assay has been highly developed over the last few years especially in the field of pharmaceutical analysis since they provide instantaneous, rapid, available, cost-effective and high precision methods.31 Considering the fact that L-DOPA obtained from natural resources specially Mucuna pruriens L. has shown more potency comparing with synthetic product,32 development of efficient methods for detection of L-DOPA in herbal extracts is highly in demand. Up to now, several spectroscopic methods using various chromogenic reagents have been provided for detection of L-DOPA or other catecholamines in non herbal sources. They mainly are based on oxidation of hydroxyl groups or interaction of amino acid moeity with the corresponding reagent.33 However, there is a few reports on the evaluation of L-DOPA in herbal extracts using chromatophic and spectrofluorimetric procedures.34 In this regard, we developed a user-friendly, simple, rapid, and economical UV-spectrophotometric method for the estimation of L-DOPA in a wide range of biotypes of Phaseolus vulgaris L. This method is based on the nitrosation reaction of L-DOPA in precence of sodium nitrate solution in acidic medium which forms an unstable yellow solution, the solution then turns to a stable red one by adding base which is measurable at 470 nm. It is worth noting that, one of the most prominent features of this method is its high selectivity against L-DOPA compared to other phenolic compounds which is characterized by the formation of a deep red color in the reaction solution. We have also studied accumulation trend of L-DOPA in seed dark germination and callus culture of Phaseolus vulgaris L. in different conditions to obtain insight into their effects on L-DOPA production. As there are no reports available to date on the enhancement of L-DOPA by elicitors or precursors in the Phaseolus vulgaris L., this study represents the first successful seeds dark germination and cell culture based approach for the production of L-DOPA and determination of it in Phaseolus vulgaris L.
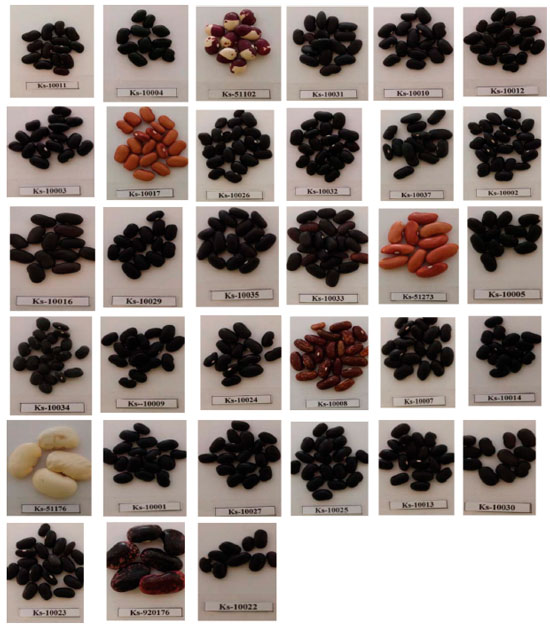
EXPERIMENTAL SECTION Chemicals and reagents All chemicals and reagents used were of analytical grade and obtained from Merck. All solutions including sodium nitrite (3%), hydrochloric acid (1 mol L-1), and sodium hydroxide (1 mol L-1) were freshly prepared. Standard L-DOPA (purity > 99.5%) was a gift sample from Ramopharmin Co, Tehran, Iran. Instrumentation Absorption measurements were performed on a double beam UV-Vis spectrophotometer (160A, Shimadzu, Japan) with a fixed 2 nm bandwidth and 1.0 cm matching quartz cell was utilized for measuring absorbance. Spectra were recorded over the wavelength range 200-800 nm. Plant material and preparation of extract 33 Iranian biotypes of Phaseolus vulgaris L. were obtained from National Research Station of Khomein, Markazi province, Iran; most of the seeds were black. M. pruriens seeds were purchased from Indian market. It was identified at Khomein National Bean Research Station (Figure 1). To prepare the extract, at first, one gram of each plant sample (dried seed, seeding and callus) was grounded to powder and soaked in solution (10 mL) containing 0.1 N HCl-Ethanol (1:1) in darkness. After five days, each solution was filtered using whatman filter paper (No. 1) and centrifuged at 3500 rpm for 10 min. The resulting solution was concentrated under vacuum and freeze-dried. L-DOPA content was estimated in each sample using spectrophotometric method.
Calibration curve of standard L-DOPA A stock solution of L-DOPA was prepared by dissolving 10 mg of L-DOPA in a 100 mL volumetric flask. A series of nine 25-mL volumetric flasks respectively containing 1, 2, 3, 4, 5, 6, 7, 8, and 9 mL of stock solution were prepared. Then, sodium nitrite (3%, 2 mL) and hydrochloric acid (1 mol L-1, 1 mL) were added to those volumetric flasks, left to stand 5 min (turned yellow), rendered alkaline with sodium hydroxide (1 mol L-1, 3 mL), left to stand 5 min (turned red), and finally was diluted to the corresponding volume with distilled water. Next, λmax was determined by scanning one of the solutions in the range of 400-800 nm using a blank (containing the same components without analyte) and λmax = 470 nm was obtained. Finally, the absorbance of all the solutions was measured at 470 nm and the related calibration curve was plotted to determine the linearity in the concentration range of 4-36 µg/mL and regression value of 0.9978. Estimation of L-DOPA in the herbal extract To determine the L-DOPA content of herbs, at least 400 mg of freeze-dried powders made from extracts of dried seeds, dried germinated seeds and dried calluses were transferred to 25-mL volumetric flask separately and distilled water (5 mL) was added to the flask. It was sonicated for 5 min and the mixture was filtered using whatman filter paper (No. 1). L-DOPA content of each concentrate was estimated using the above validated spectrophotometric method. Seed dark germination Seeds (Ks10001, Ks10008, Ks10017, Ks10023, Ks10025, Ks10032, and Ks 51273) were soaked individually in distilled water for 24 h with slow shaking on an orbital shaker and then they were germinated in flats which were lined with moist paper towels. The flats were covered with aluminum foil and the seeds were germinated in the dark. The germinating seeds were kept moist with distilled water and the assays were performed daily for the next 12 days. After 12 days of germination, signs of growth were appeared and the first pair of leaves emerged. The L-DOPA content of the dark germinating sprouts was determined in the 3th, 6th, 9th, and 12th days. Culture medium and conditions MS basal medium supplemented with 3% (w/v) sucrose was used for all in vitro culture studies. The pH of the medium was adjusted to 5.8 prior to adding 0.8% (w/v) agar and autoclaved at 121 °C for 20 min. Cultures were incubated with a16 h photoperiod by cool white fluorescent lamps (25 µ mol m-2s-1) at 25 °C. Callus induction and suspension cell cultures The seeds of Phaseolus vulgaris L. with Ks51102 sample's code were chosen randomly and sterilized with water for 20 min, 70% ethanol for 1 min and 0.1% mercuric chloride (HgCl2) for 5 min, followed by washing with sterile distilled water 5-6 times to remove traces of HgCl2. They were germinated on basal Murashige and Skoog (MS) medium.35 Callus was induced from in vitro leaf tissue explants cultured on MS medium supplemented with various concentrations of 2,4-dichlorophenoxyacetic acid (2,4-D) (0.50, 1.50, 2.00, 4.50, 11.00, 22.50 and 45.00 µmol L-1); indole acetic acid (IAA) (0.50, 1.50, 3.00, 5.50, 14.00, 28.00, and 57.50 µmol L-1), 6-benzylaminopurine BA (0.40, 1.50, 2.00, 4.50, 11.00, 22.50, and 44.00 µmol L-1), and 2-isopentenyl adenine (2-iP) (0.60, 1.50, 3.00, 4.50, 12.00, 24.50, and 50.00 µmol L-1). Callus growth The growth of the callus and its biomass was measured in fresh (FW g L-1) and dry weight (DW g L-1) by standard method.36 FW of callus was measured after removing the excess moisture and agar adhering to the callus surface using blotting paper. DW of callus was determined by drying the callus in hot air oven at 60 °C for 24 h and was expressed in g L-1 DW culture. Preparation and application of elicitors and precursors to cell cultures Methyl jasmonate (MJ) (50, 100, 150, 200 and 250 µmol L-1) was dissolved in sterile distilled water, and L-tyrosine (50, 100, 150, 200 and 250 mmol L-1) was prepared by dissolving initially with 1 or 2 drops of NaOH (1 N) then diluted with sterile double distilled water to get the final concentrations, pH was adjusted to 5.8.
RESULTS AND DISCUSSION Preliminary studies by thin layer chromatography The presence of L-DOPA in the test samples was confirmed by comparing the TLC pattern of testing seeds and the standard L-DOPA using optimized solvent system; butanol: acetic acid: water (4:1:1). After elution with appropriate solvent, the TLC plate was air dried for 10 min, sprayed with a 0.1% solution of ninhydrin in methanol, and dried at 105 °C for 5 min. The Rf values and brownish-pink spots revealed similar profiles (Figure 2).
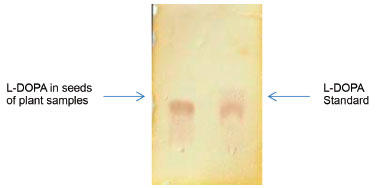 Figure 2. TLC analysis of standard L-DOPA and L-DOPA in seeds of plant samples
Selected spectrophotometric method Although various spectrophotometric methods have been developed for the detection of L-DOPA, they suffer from different disadvantages such as using expensive reagents, non-aqueous media (leading to precipitation), multi-steps and time consuming procedures, need to heat, instability of the colored species and poor detection limit. Herein, looking for an efficiennt and practical L-DOPA detection particularly in herbal extracts, we have developed a spectrophotometric method based on the nitrosation of L-DOPA profiting from availability, safety, low cost materials and deep color changes with no precipitated product through the experiment. This method consists of two short steps. In the first step, nitrosation reaction of L-DOPA occurs in the presence of sodium nitrite and HCl which leads to the formation of unstable yellow color (compound I). In the next step, by adding NaOH solution, a stable red (compound II), measurable at 470, is created (Scheme 1, compounds I, II). Stability of compound II is probably due to the contribution of an extra pair of unshared electrons in the interaction with the aromatic nucleus.
The most significant result for this method is the formation of a deep reddish color after adding sodium hydroxide solution, which only has a maximum absorption for the catechol at 470 nm. Absorption curve of nitroso derivative of catechol in alkaline medium is shown in Figure 3.
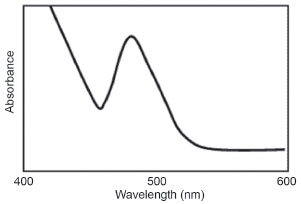 Figure 3. Absorption curve of nitroso derivative of levodopa in alkaline medium
Another important point is the selectivity of this method for the detection of L-DOPA comparing with phenolic compounds such as resorcinol, pyrogallol, phenol, and tyrosine. As can be seen in Figure 4, formation of deep red solution by L-DOPA makes the method rapid, easy, efficient and selective which can be easily developed for the detection of various catecholic compounds as tested by our group.
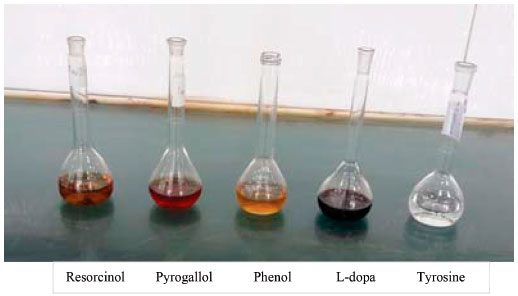 Figure 4. Selectivity of the method for L-DOPA detection
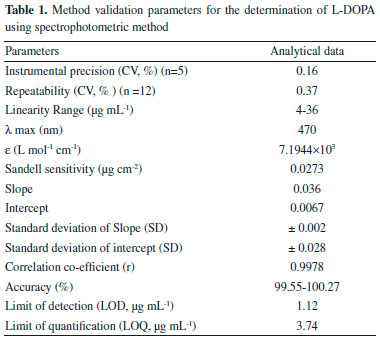
Method validation (linearity, detection and quantification limits) The spectrophotometric method was validated by evaluating linearity, precision, accuracy, limit of detection (LOD), limit of quantitation (LOQ), and sensitivity of parameters such as molar absorptivity. The linear relationship between absorbance and concentration was indicated by graph obtained using nine standard solutions containing 4, 8, 12, 16, 20, 24, 28, 32, and 36 µg mL-1 of L-DOPA. Calibration curve and correlation coefficient were obtained by fitting a proper equation using a conventional linear least-squares treatment. It was found that linearity was obeyed in the concentration range of 4-36 µg mL-1 with an excellent coefficient of determination 0.9978. The absorbance values for this concentration range were adjusted by the regression equation line: A = 0.036 c + 0.0067 (A = mc + b), where c is the concentration of L-DOPA (µg mL-1). It was observed that the intercept (b) is close to zero. Therefore, the linearity is satisfactory in each instance and Beer's law is obeyed in the concentration range with λmax = 470 nm (Figure 5).
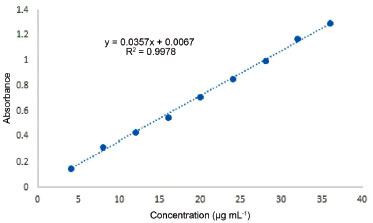 Figure 5. Calibration curve of standard L-DOPA
The LOD (3x[SDblank /slope of curve]), LOQ (10x[SDblank/slope of curve]) and molar absorptivity (ε) (L mol-1 cm-1) were 1.12 µg mL-1, 3.74 µg mL-1 and 7.19 x 10³ respectively (Table 1).
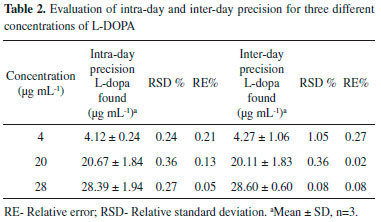
Intra-day and inter-day precision The precision of the method was described by determining within-day and between-day precisions, expressed in percent and obtained by relative standard deviation RSD or coefficient of variation (CV). Three standard solutions containing 4, 20 and 28 µg mL-1 of L-DOPA were analyzed in three replicates during the same day (intra-day precision) and three consecutive days (inter-day precision). To assess the day-to-day precision of the method, fresh standard solutions were prepared each day since the L-DOPA is not sufficiently stable to allow use over a number of days. The intra-day and inter-day precision studies confirmed appropriate sample stability and method reliability. %RSD values of intra and inter-day were found between 0.24-0.36% and 0.08-0.36%, respectively indicating satisfactory precision since all the RSDs were < 2.0%. In addition, in all cases, errors were calculated lower than 0.27% (Table 2).
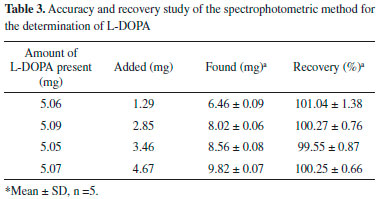
Accuracy/recovery and repeatability studies Accuracy of an analytical method is ascertained by the closeness between the reference value and the found value; it is confirmed by high accuracy of the corresponding method. The accuracy of our method was examined by performing recovery experiments at four concentrations by addition of different known amount of standard to approximately 5.1 mg of L-DOPA. The results obtained for the accuracy of the method were summarized in Table 3. The recovery was found to be 101.04%, 100.27%, 99.55%, and 100.25%, respectively and the mean recovery values for all samples is 100.28% and RSD is within 0.66-1.38%.
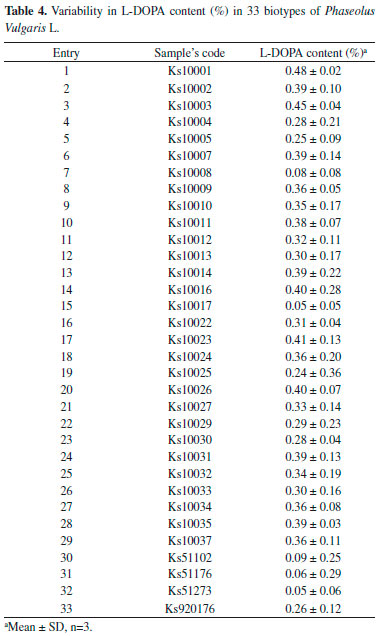
L-DOPA content in the herbal extracts As shown in Table 4, all seeds contain L-DOPA. The amount of L-DOPA varies in different seeds. The lowest amounts belong to Ks51273 and Ks51176 with value of 0.05% and 0.06% and the highest amounts are related to Ks10001 and Ks10003 with the values of 0.48%, 0.45% respectively. The average value of L-DOPA content in the 33 tested biotypes of Phaseolus vulgaris L. is approximately 0.30% and black seeds possess higher amounts of L-DOPA in comparison to yellow and brown types.
Accuracy of the method was also confirmed by the good recovery of added L-DOPA to the plant extracts of five randomLy selected Samples (Ks10001, Ks10014, Ks10033, Ks10025, Ks51176) (Table 5).The recovery and RSD values for these samples were obtained within the 99.57-100.92% and 0.460-1.397% which confirmed accuracy of the method for the detection of L-DOPA in herbal extracts. It also shows that there is no interference for the detection of L-DOPA in the presence of excipients in the herbal extracts.
The results of this method were compared with the results obtained with the HPLC method for seven random selected seeds and also for M. prurience L. as a reference plant. The statistical comparison is presented in Table 6. The calculated t-values at the 95% confidence level did not exceed the theoretical values indicating no significant difference between this proposed method and a reference method (HPLC).
Dark germination effect on the content of levodopa Seven seeds with variable range of L-DOPA which was measured by spectrophotometric method in previous section were selected. These seeds included Ks51273, Ks10017 and Ks10008 with the lowest value of L-DOPA, Ks10025 and Ks10032 with the average value of L-DOPA as well as Ks10023 and Ks10001 with the highest value of L-DOPA. The results of the present study showed that the L-DOPA value was improved during dark germination of the seeds, in all cases the L-DOPA content of the germinated sprouts increased comparing with control on day 0. The increase in L-DOPA content was observed during days 3-9 in Ks10001, Ks10008, Ks10017, Ks10023, and Ks10032; however, Ks10025 and Ks51273 showed similar results by day 6. Further, from day 9 to day 12, accumulation of L-DOPA was found to be decreased in all seeds studied (Table 7).
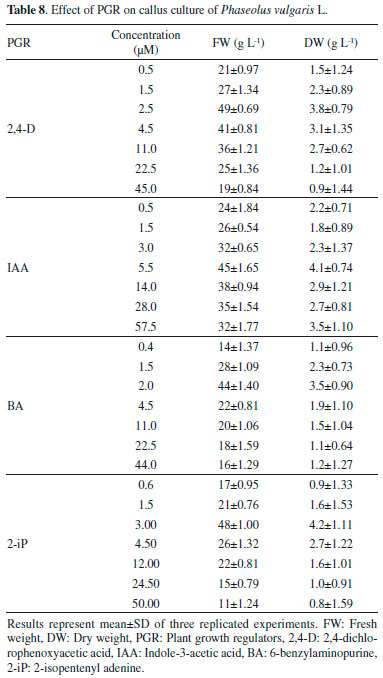
Effect of the plant growth regulators (PGR) on cell growth of Phaseolus vulgaris L. Maximum growth of callus was obtained in MS medium supplemented with 2,4-D at 2.50 µmol L-1, IAA at 5.50 µmol L-1, 2-ip at 3.00 µM, and BA at 2.00 µmol L-1 (Table 8). Callus grown on medium supplemented with 2,4-D and IAA was pale yellowish. While callus grown on medium supplemented with BA and 2-iP was green and more compact. The maximum callus growth was found with cytokinins such as 2-iP and auxin (2,4-D). These findings conform to the reported results about Mucuna Pruriens L. by Janarthanam.37 The Remarkable thing is that, in all cases increasing PGR leads to reduced growth of callus.
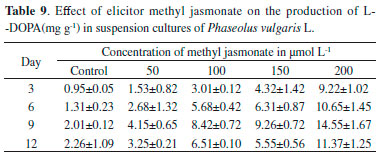
Effect of elicitors and precursor on the accumulation of L-DOPA Both the elicitors and precursors (methyl jasmonate and L-tyrosine) increased the accumulation of L-DOPA in the cell suspension cultures compared to the control of cultures from day 3 to day 12. Methyl jasmonate, caused to increase L-DOPA several folds during day 3 to day 9, from day 9 to day 12, accumulation of L-DOPA was observed to be decreased (Table 9).
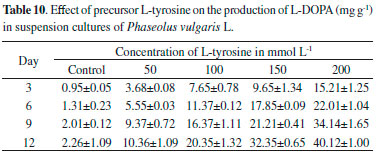
Accumulation of L-DOPA under the influence of precursor L-tyrosine was rather different comparing with methyl jasmonate used in the present study. L-tyrosine increased the L- DOPA production from day 3 to day 12 at all the concentrations tested (Table 10). The highest concentration of L-DOPA was obtained (40.124 ± 1.00 mg g-1) on day 12 at 200 mg L-1 with a 17.75-fold increase. Results showed that L-tyrosine can be used as natural and effective precursor for the synthesis of L-DOPA.38
CONCLUSION In conclusion, practical, efficient, environmentally-friendly, accurate and rapid spectrophotometric determination of L-DOPA obtained from different biotypes of Phaseolus vulgaris was reported. The method is also economic since expensive instrumentations such as HPLC and HPTLC are not involved. It is based on the reaction of L-DOPA with NaNO2 in acidic medium to form an unstable yellow solution which converted to stabilized red soution by addition of sodium hydroxide which is measurable at 470 nm. It should be noted that the method is highly selective toward L-DOPA in the presence of other phenolic compounds such as phenol, resorcinol, and tyrosine. Validation of this method was applied succesfully by comparision with the HPLC method. The calculated t-values showed that, there is no significant difference between the two methods. Our results revealed that amoung the tested 33 biotypes of P. vulgaris, black seeds possessed higher amounts of L-DOPA in comparison to yellow and brown types. They may be more efficient for the therapeutic purposes and preparation of herbal supplement. Considering the fact that L-DOPA is still the gold standard for treating Parkinson's disease, the method can play an important role in determination of L-DOPA in herbal formulations. We also determined L-DOPA content in seed dark germination and callus culture of Phaseolus vulgaris L. in different conditions. Seeds dark germination and plant tissue cultures have been proposed as useful techniques to increase production of L-DOPA. Our results confirmed that tyrosine significantly increased the concentration of L-DOPA and thus it could be applied successfully to large-scale production of L-DOPA.
ACKNOWLEDGEMENTS Authors acknowledge finacial support from Reseach Council of Tehran University Medical Sciences and Iran National Science Foundation (INSF).
REFERENCES 1. Lang, A.; Lozano, A.; N. Engl. J. Med. 1998, 339, 1044. 2. Kofman, O.; Can. Med. Assoc. J. 1971, 104, 483. 3. Guggenheim, M.; Z. Physiol. Chem. 1913, 88, 276. 4. Apaydin, H.; Ertan, S.; Ozekmekci, S.; Mov. Disord. 2000, 15, 164. 5. Randhir, R.; Shetty, P.; Shetty, K.; Process Biochem. 2002, 37, 1247; Shetty, P.; Atallah, M. T.; Shetty, K.; Process Biochem. 2002, 37, 1285; Randhir, R.; Shetty, K.; Process Biochem. 2004, 39, 1775; Randhir, R.; Vattem, D; Shetty, K.; Innovations Food Sci. Emerging Technol. 2004, 5,235; Raghavendra, S.; Ramesh, C. K.; Kumar Vand Moinuddin Khan, M. H.; Front. Life Sci. 2011, 5, 127. 6. Betto, P.; Ricciarello, G.; Giabenedetti, M.; Lucarelli, C.; Ruggeri, S.; Stocchi, F.; J. Chromatogr. A. 1988, 459, 341. 7. British Pharmacopoeia, HMSO Publication Centre, London, Vol. I and II. 1980, 781:254, 535. 8. Cannazza, G.; Stefano, A.D.; Mosciatti, B.; Braghiroli, D.; Baraldi, M.; Pinnen, F.; Sozio, P.; Benatti, C.; Parenti, C.; J. Pharm. Biomed. Anal. 2005, 36, 1079. 9. Husain, S.; Sekar, R.; Nageswara Rao, R.; J. Chromatogr. A. 1994, 687, 351. 10. Issa, Y. M., Hassoun, M. E. M.; Zayed, A. G.; J. Liq. Chromatogr. Relat. Technol. 2011, 34, 2433. 11. Kafil, J. B.; Dhingra, B. S.; J. Chromatogr. A. 1994, 667, 175. 12. Li, S. F.; Wu, H. L.; Yu, Y. J.; Li, Y. N.; Nie, J. F.; Fu, H. Y.; Yu, R. Q.; Talanta 2010, 81, 805. 13. Michotte, Y.; Moors, M.; Deleu, D.; Herregodts, P.; Ebinger, G.; J. Pharm. Biomed. Anal. 1987, 5, 659. 14. Raut, P. P.; Charde, S. Y.; Luminescence 2014, 29, 762. 15. Sravanthi, D.; Anusha, M.; Madhavi, S.; Firdose, S.; Nalluri, B. N.; J. Chem. Pharm. Res. 2013, 5, 422. 16. Titus, C. D.; August, F. T.; Yeh, C. K.; Eisenhandler, R.; Bayne, F. W.; Musson, G. D.; J. Chromatogr. B 1990, 99, 87. 17. The United State Pharmacopoeia, XXI, 21st revision, The US Pharmaceutical Convention Inc., Rockville. 1987, pp. 585-586. 18. Bo-Young, C.; Hyun-Man, B.; Byung-Chul, S.; Moon-Chan, K.; Euy-Neyng, K.; Tae-Suk, S.; Hyoung-Koo, L.; Kyung-Sub, S.; J. Korean. Soc. Magn. Reson. Med. 2000, 4, 19; Talebpour, Z.; Haghgoo, S.; Shamsipur, M.; Anal. Chim. Acta. 2004, 506, 97. 19. Alam, S. M.; Karim, M. M.; Lee, S. H.; Wabaidur, S. M.; Chung, H. Y.; Choi, J. H.; Kang, M.; Luminescence 2008, 23, 327; Deftereos, N. T.; Calokerinos, A. C.; Efstathiou, C. E.; Analyst 1993, 118, 627; Nozaki, O.; Iwaeda, T.; Moriyama, H.; Kato, Y.; Luminescence 1999, 14, 123; Zhao, S.; Wenling, B.; Bing, W.; Min, H.; Talanta 2007, 15, 142. 20. Bell, C. E.; Somerville, A. R.; Biochem. J. 1966, 98, 1; Kazuhizo, I.; J. Chromatogr. A. 1975, 105, 135 21. Seki, T.; Wada, H.; J. Chromatogr. A. 1975, 114, 227. 22. Mennickent, S.; Nail, M.; Vega, M.; de Diego, M.; J. Sep. Sci. 2007, 30, 1893. 23. Doshi, P. S.; Edwards, D. J.; J. Chromatogr. A. 1981, 210, 505; Satoshi, K.; Zenzo, T.; Chem. Pharm. Bull. 1968, 16, 1091. 24. Ricebery, L. J.; Vunakis, H. V.; Levin, L.; Anal. Biochem. 1974, 60, 551. 25. Amin, D.; Analyst 1986, 111, 255; Salem, F. B.; Anal. Lett. 1993, 26, 1959. 26. Bishop, E.; Houssein, W.; Analyst. 1984, 109, 627; Ensafi, A. A.; Arabzadeh, A.; Karimi-Maleh, H.; J. Braz. Chem. Soc. 2010, 21, 1572; Kozminski, K. D.; Gutman, D. A.; Davilla, V.; Sulzer, D.; Ewing, A. G.; Anal. Chem. 1998, 70, 3123; Teixeira, M. F. S.; Bergamini, M. F.; Marques, C. M. P.; Bocchi, N.; Talanta. 2004, 63, 1083. 27. Zhang, L.; Chen, G.; Hu, Q.; Fang, Y.; Anal. Chim. Acta. 2001, 431, 287. 28. Badawy, S. S.; Issa, Y. M.; Tag-Eldin, A. S.; Electroanalysis 1996, 8, 1060. 29. Lv, L.; Jiang, W.; Zhou, S.; Huang, X.; Shi, X.; Lv, C.; Wu, L.; Xu, C.; Chromatographia. 2010, 2, 751. 30. Unendi, G.; Pamuk, F.; Turk. J. Chem. 1999, 23, 269. 31. Siddiqui, M. R.; AlOthman, Z. A.; Rahman, N.; Arabian J. Chem. 2017, 10 (S1), S1409. 32. Ramya, K. B.; Thaakur, S.; Ancient Science of Life 2007,27, 50. 33. Afkhami, A.; Khatami, H.; Anal. Chem. 2003, 58, 135; Chamsaz, M.; Safavi, A.; Fadaee, J.; Anal. Chim. Acta. 2007, 603, 140; Gowda, B. G.; Melwanki, M. B.; Seetharamappa, J.; Anal. Sci. 2001, 17, 533; Madrakian, T.; Afkhami, A.; Borazjani, M.; Bahram, M.; Bull. Mater. Sci. 2004, 25, 1764; Helaleh, M. I. H.; Abu-Nameh, E. S. M.; Chem. Analityczna. 1998, 43, 225; Madrakian, T.; Afkhami, A.; Khalafi, L.; Mohammadnejad, M.; J. Braz. Chem. Soc. 2006, 17, 1259; Nagaraja, P.; Shrestha, A. K.; Shivakumar, A.; Saeed Al-Tayar, N. G.; Gowda, A. K.; Quim. Nova 2011, 34, 373; Patil, V. P.; Devdhe, S. J.; Kawde, R.; Kulkarni, V. S.; Nagmoti, V. J.; Patil, R. D.; Kale, S. H.; Int. J. Pharm. Sci. 2012, 4, 711. 34. Pieris, N.; Jansz, E. R.; Dharmadara, H. M.; J. Natl. Sci. Found. Sri. 1980, 8, 35; Upadhyay, V.; Tiwari, A. K.; Sharma, N.; Joshi, H. M.; Singh, B. P.; Kalakoti, B. S.; Int. J. Pharma. Sci. Drug Res. 2012, 1, 135; Khozaei, M.; Ghorbani, F.; Mardani, G.; Emamzadeh, R.; J. HerbMed Pharmacol. 2014, 3, 61; Modi, K. P.; Patel, N. M.; Goyal, R. K.; Chem. Pharm. Bull. 2008, 56, 357; MohSeni Mehran, S. M.; GolShani, B., J. Clin. Diagn. Res. 2013, 7, 1004 35. Murashige, T.; Skoog, F.; Physiol. Plant. 1962, 15, 473. 36. Janarthanam, B.; Gopalkrishnan, M.; Sekar, T.; J. Sci. Ind. Res. 2010, 45, 243. 37. Janarthanam, B.; Sumathi, E.; Asian J. Pharm. Clin. Res. 2015, 8, 282. 38. Pattison, D. I.; Dean, R. T.; Davis, M. J.; Toxicology. 2002, 177, 23. |
On-line version ISSN 1678-7064 Printed version ISSN 0100-4042
Qu�mica Nova
Publica��es da Sociedade Brasileira de Qu�mica
Caixa Postal: 26037
05513-970 S�o Paulo - SP
Tel/Fax: +55.11.3032.2299/+55.11.3814.3602
Free access


