Educação
| Measuring the conductivity of very dilute electrolyte solutions, drop by drop |
|
Leandro MartínezI,II
I. Instituto de Química, Universidade Estadual de Campinas, R. Josué de Castro, 126 - Cidade Universitária, 13083-861 Campinas – SP, Brasil Recebido em 04/12/2017 *e-mail: leandro@iqm.unicamp.br Undergraduate experiments on ionic conductivity are common practice in general chemistry and advanced physical chemistry laboratories. Often, the conductivities are measured for solutions prepared for various salts, in a range of concentrations, and the relationship between solution conductivity and concentration is interpreted in terms of the Kohlrausch law. Contaminations can dominate the conductivity of the solutions such that students might obtain unsatisfactory results for analysis. Here, the experience of using a simple experimental procedure to obtain the concentration dependence of ionic conductivities for very dilute (sub-millimolar) electrolyte solutions in undergraduate laboratories is described. The experiment consists of measuring the conductivity of solutions of increasing concentration prepared by dropping the electrolyte solution into an initial vessel of deionized water. The range of concentrations achieved is one in which the conductivities vary linearly with the concentrations, such that the molar conductivities can be obtained directly without the use of the Kohlrausch equation. The simplicity of the experimental procedure leads the students to obtain good quality results using minimal amounts of materials. Examples are presented for the conductivities of strong electrolytes, and for the weak acetic acid electrolyte, for which the conductivity is dependent on the degree of dissociation also for dilute solutions. INTRODUCTION The study of the conductivity of electrolyte solutions is important for the development of electrochemical devices,1,2 for the characterization of the dissociation equilibrium of weak electrolytes,2–4 and for the fundamental understanding of charge transport by ions.5 Therefore, experiments in general chemistry and physical chemistry laboratories are widespread in undergraduate chemistry courses, and are subject to many educational developments, from the development of conductivity measuring apparatus to the preparation and study of specific electrolytes.1,2 Typically, the conductivity of electrolyte solutions is measured for electrolyte solutions with concentrations in the range of 10-3 to 10-1 mol L-1, as solutions in this range of concentrations can be easily prepared.2,5,6 The molar conductivity (Λm) of strong electrolyte solutions can be nicely fit by the Kohlrausch equation, 7  where Λ°m is the molar conductivity at infinite dilution and c is the concentration of the solution. K is an empirical proportionality constant to be obtained from the experiment. The molar conductivity of weak electrolytes, on the other hand, is dependent on the degree of dissociation of the electrolyte. At the limit of very dilute solutions, the Ostwald dilution law is expected to be followed,  where CA is the analytical concentration of the electrolyte and Kd is the dissociation constant. The molar conductivity at infinite dilution can be decomposed into the contributions of each ion,  where λ+ and λ– are the ionic conductivities of the positive and negative ions, respectively, and ν+ and ν– are their stoichiometric coefficients in the salt molecular formula. From the concentration dependence of the molar conductivity of each salt, it is possible to obtain the molar conductivities at infinite dilution through Equation 1. If salts sharing the same type of ions are studied, it is possible to obtain ionic conductivities, which are intrinsic properties of the transport of each ion in the solvent studied. Currently, portable conductivity meters with µS cm-1 sensitivity are accessible to undergraduate laboratories and are robust enough to be manipulated by students of any level. In principle, this sensitivity would allow the study of electrolyte solutions with concentrations in the micromolar to millimolar range. The difficulty in obtaining good quality conductivity measurements is associated mainly to the preparation of the solutions, manipulation, and cleaning of the apparatus, because small contaminants of concentrated solutions of electrolytes can dominate the conductivity measurements of more dilute solutions. In the dynamics of an undergraduate laboratory experiment, with limited time available, our experience is that many students fail to obtain conductivity measurements which fit the expected equations and the discussion of the results becomes impaired. Here, we describe the use of a simple experimental procedure to perform a laboratory experiment on the conductivity of electrolyte solutions at sub-millimolar concentrations. The procedure consists of dropping the electrolyte solution to an initial volume of deionized water. Measurements of the nearly linear increase of conductivity with the number of drops of a strong electrolyte solution added to water were proposed previously,8 but not exploited and detailed as a simple and practical strategy for the quantitative determination of molar conductivities in undergraduate courses. The method saves significant quantities of material and the results obtained are robust and reproducible.
EXPERIMENTAL PROCEDURE In brief, the procedure consists in measuring the conductivity of solutions of electrolytes with increasing concentration, which are prepared simply using a pipette to drop the stock electrolyte solution into a sample of initially deionized water of known volume. The volume of the drop was determined previously by weighing samples of 20 drops and averaging. The conductivity was measured after each drop addition, after a proper stabilization time, associated with the mixing of the solution. All the measurements were performed with solutions at the desired temperature (298 ± 1 K), by coupling to a thermal bath, as shown in Figure 1. Magnetic stirring was used to homogenize the solution after the addition of each drop. Additional experimental details, involving the careful cleaning and calibration of the conductivity meter, are similar to other procedures proposed for the study of electrolyte conductivities in general chemistry and physical chemistry undergraduate laboratories and are described in the Supplementary Information.2,5
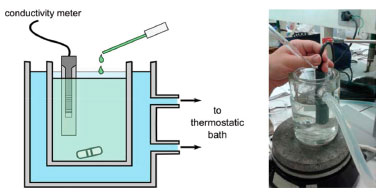 Figure 1. Experimental arrangement for conductivity measurements. The conductivity meter is placed inside a vessel containing deionized water. Drops of an electrolyte solution are added to the system under constant stirring. The conductivity is measured after the addition of each drop, after a proper delay for the homogenization of the solution and stabilization of the measured conductivity
HAZARDS The solutions used are usually very dilute and do not have a significant hazard. Leftover solutions can be disposed of down the drain.
RESULTS AND DATA ANALYSIS Drop volume and error The drop volume was estimated by measuring the mass of 20 drops and averaging for a single drop. The densities of the solutions were considered to be the same of that of water at the same temperature. Alternatively, they could be determined by the students. Five estimates of the drop volume were obtained to compute an average, using each electrolyte solution studied. The students are informed that the drop volume depends on many factors, such as the internal and external diameters of the dropping tip, dropping angle, density, velocity of extrusion, and vibrations. Thus, the students are oriented to be systematic in every aspect of the dropping procedure, and consistent within experiments. A typical drop volume was 0.05 mL. The initial volume of water was proposed to be of 150 mL, such that the addition of 100 drops represented less than 4% of the total volume of the solution. The students used a spreadsheet to compute the total volume of the solution after the addition of each drop for computing the concentrations. At the same time, the error associated with ignoring the volume of the solution added was discussed: If the electrolyte solution has a concentration of 0.05 mol L-1, the concentration of the solution after the addition of the first drop is ~1.7 × 10⁻⁵ mol L-1. After the addition of 100 drops, the concentration rises to ~1.7 × 10⁻³ mol L-1. Thus, most of the experiment was performed in the sub-millimolar concentration range. As an advanced topic, the teacher might want to discuss how to estimate the variation in the volume of a single drop from the standard deviation of the means measured. Indeed, each volume estimate was obtained by averaging the volume of 20 drops. Therefore, the standard deviation obtained between the estimates was the standard deviation of a mean. The standard deviation of individual estimates (SD) is related to the standard deviation of the mean Alternatively, it is possible to obtain similar results, with increased accuracy, using micropipettes or automatic drop counters, if available. However, these are not necessary for the qualitative analysis of the results, as will be shown. Strong electrolytes The molar conductivity of strong electrolytes is expected to follow the Kohlrausch law (Equation 1). For sufficiently dilute solutions, however, In Figure 2 we display the results obtained by students at the regular course "QF632 -Experimental Physical Chemistry – I" of the Institute of Chemistry of the University of Campinas (UNICAMP), for strong electrolytes. The range of concentrations achieved was within 10-5 and 0.5×10⁻³ mol L-1 for the addition of up to 100 drops of 0.05 mol L-1 electrolyte solutions into initial deionized water volumes varying between 150 and 250 mL, depending on the student's solution preparation details. All experiments were performed at 298 K, within the precision of the thermostatic bath available (±1 K). We plot here the conductivity as a function of the number of drops added or concentrations, up to 0.5×10⁻³ mol L-1. The conductivity of the initial deionized water was smaller than 2 µS in all cases, and those of the solutions increased to at most 200 µS. Each electrolyte-solution drop increased the conductivities by about 2 µS. In the range of concentrations probed, the linearity of the conductivity with the concentration is clear, as shown in Figure 2, and suggests that the approximation that
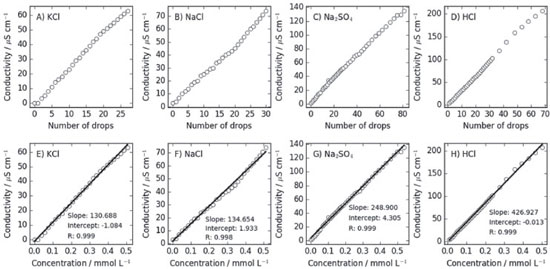 Figure 2. Conductivity as a function of the number of drops of electrolyte solution added or concentrations, for strong electrolytes. At the sub-millimolar range of concentrations probed, the conductivity is clearly linearly dependent on the concentration, and the molar conductivities at infinite dilutions can be obtained directly from the slopes of the linear fits
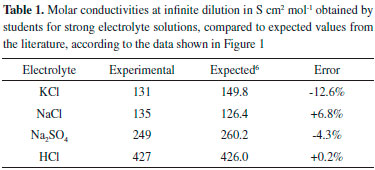
Table 1 displays the molar conductivities at infinite dilution obtained from the linear fits of Figure 2 and the expected results from the literature. The greatest absolute error in this set is observed for KCl and is 12.6% of the tabulated value. It is not possible to attribute the imprecision of the obtained data to the conductivity measurements, as the remarkable linearity of the plots in Figure 1 indicate that no random error was associated with the estimate of the slopes. The errors are, therefore, systematic for each experiment, and can be attributed to the preparation of the solutions, or the improper control of temperature or calibration of the conductivity meter. For example, a 1 °C error in temperature is associated to a conductivity variation of ~3% for NaCl.3 These errors are acceptable for an undergraduate laboratory experiment and are similar to those obtained using more concentrated solutions and the use of the Kohlrausch equation, as reported by Eslek and Tulpar.5
Weak electrolytes The use of the drop by drop strategy was also employed for the study of the conductivity of acetic acid (HAc). At the range of concentrations achieved by the present experimental procedure, the degree of dissociation of HAc varies between 0.8 and 0.1, as shown in Figure 3A. The degree of dissociation is computed from 
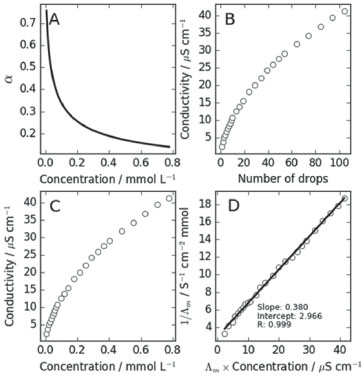 Figure 3. Study of the conductivity of weak electrolyte solutions: acetic acid as an example. (A) Degree of dissociation, α, as a function of the concentration in the range of concentrations probed by the dropping procedure. (B) Conductivity as a function of the number of drops added. (C) Conductivity as a function of the concentration of the solution. (D) The inverse of the molar conductivity as a function of the molar conductivity times the concentration, which corresponds to the Ostwald dilution law plot. From the intercept and slope of the linear fit, it is possible to obtain the limiting molar conductivity and the dissociation constant of the electrolyte
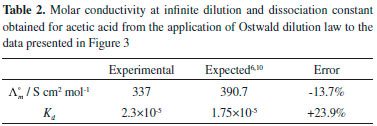
where CA is the analytical concentration, and Kd = 1.75×10⁻⁵ is the expected value for T=298 K.10 Because of the range of dissociation degrees probed, the conductivity varies non-linearly with the concentration of the acid. Figures 3B and 3C show the conductivities obtained by students as a function of the number of drops added to the solution and as a function of the concentration of the acid. Clearly, the conductivity increases less than linearly with concentration, because of the decreasing degree of dissociation. The analysis of the conductivity of weak electrolytes, taking into account the degree of dissociation, was performed with Ostwald dilution law (Equation 2). A plot of the inverse of the molar conductivity as a function of the product between the molar conductivity and the concentration is expected to be linear, with intercept 1/Λ°m and slope 1/[(Λ°m)2Kd]. From the intercept, the molar conductivity at infinite dilution was computed and from that the dissociation constant using the slope of the linear fit. Figure 3D shows results obtained by students for the application of the Ostwald dilution law to the conductivity measurements of acetic acid. The linearity of the plot is clear, and the intercept and the slope of the plots can be used to compute the limiting molar conductivity and dissociation constant of the acid. Table 2 shows the final results obtained. The limiting molar conductivity was obtained within 14% of the expected value, and the dissociation constant was obtained with a 24% error, nicely within the expected order of magnitude.
SUMMARY In this article, we describe the implementation a simple method to prepare solutions of very low (sub-millimolar) concentration, to be used in the study of the conductivity of electrolyte solutions in general chemistry or physical chemistry undergraduate laboratories. The method consists in preparing solutions with increasing concentration by dropping the electrolyte solution into an initial sample of deionized water. The procedure saves material and is robust in the sense that the manipulation of the solutions is minimal, such that the students frequently obtain satisfactory results. The range of concentrations obtained is such that the limiting molar conductivities of strong electrolytes can be obtained with good accuracy without the use of Kohlrausch law, directly from the molar conductivity of the solutions, which is essentially constant at the concentration ranges sampled. The method can be used also to study the dissociation equilibrium of weak electrolytes by means of the Ostwald dilution law. The method was satisfactorily applied in first-year General Chemistry and second-year Physical Chemistry laboratories.
SUPPLEMENTARY MATERIAL Supporting Information can be freely accessed at http://quimicanova.sbq.org.br, in pdf format: Curriculum Context, Detailed Experimental Procedure, Laboratory Organization and Data Sharing, Data Analysis; Units Analysis.
ACKNOWLEDGEMENTS The author thanks the financial support of FAPESP (Grants 2010/16947-9, 2013/05475-7, and 2013/08293-7).
REFERENCES 1. Set, S.; Kita, M.; J. Chem. Educ. 2014, 91, 892. 2. Nyasulu, F.; Moehring, M.; Arthasery, P.; Barlag, R.; J. Chem. Educ. 2011, 88, 640 3. Nyasulu, F.; Stevanov, K.; Barlag, R.; J. Chem. Educ. 2010, 87, 1364. 4. Eslek, Z.; Tulpar, A.; J. Chem. Educ. 2013, 90, 1668. 5. Eslek, Z.; Tulpar, A.; J. Chem. Educ. 2013, 90, 1665. 6. Atkins, P. W.; Physical Chemistry, 5th ed., Oxford University Press: Oxford, 1994. 7. Garland, C. W.; Nibler, J. W.; Shoemaker, D. P.; Experiments in Physical Chemistry, 8th ed., McGraw-Hill: New York, 2009. 8. Holmquist, D. D.; Randall, J.; Volz, D. L.; Chemistry with Vernier, 4th ed., Version 4.2, Vernier: Beaverton, 2017. 9. Altman, D. G.; Bland, J. M.; BMJ 2005, 331, 903. 10. Cohn, E. J.; Heyroth, F. F.; Menkin, M. F.; J. Am. Chem. Soc. 1928, 50, 696. |
On-line version ISSN 1678-7064 Printed version ISSN 0100-4042
Qu�mica Nova
Publica��es da Sociedade Brasileira de Qu�mica
Caixa Postal: 26037
05513-970 S�o Paulo - SP
Tel/Fax: +55.11.3032.2299/+55.11.3814.3602
Free access


 through
  , where N is the number of samples used to compute the mean.9 A typical result was to obtain a standard deviation of the mean of the weights of 20 drops of 1-2%, such that the variation in the volume of a single drop was of the order of 4-8%. The volume, and thus the concentration, error after the addition of N drops was estimated as the standard error of the mean of N drops, and was of the order of
  . The greatest error in the concentration estimate is associated with the addition of the first drop, and was reasonably estimated to be below 10%, not compromising the overall quality of the results.
 , and thus the molar conductivity is expected to be approximately constant and equal to the molar conductivity at infinite dilution (Λm≈ Λ°m). In other words, since κ = Λmc, if one plots the conductivity κ as a function of the concentration, a linear correlation with slope Λ°m is expected.
 can be used. The data obtained can be fitted by linear equations with correlation coefficients greater than 0.997 in all cases. The slopes provide directly the molar conductivity in this range of concentrations, which is constant and expected to be a good approximation of the molar conductivity at infinite dilution. The drop addition can be continued until the effect of ion concentration becomes noticeable and the increase in conductivity ceases to be linear. In this case, it is suggested that the number of drops added increases progressively based on the relative variation of the conductivity. Students, particularly from physical chemistry laboratories, are then oriented to use de Kohlrausch law to fit the data.