Artigo
| Determination of antioxidant potential and quantitation of phenolic compounds by hplc in accession of capsicum baccatum var. pendulum |
|
Maria Lucy de AssisI; Marco Antônio G. B. GomesII; Larissa L. da CruzI; Michel de S. PassosII; Silvia M. F. PereiraI; Mariana B. S. ArantesI; Daniela B. OliveiraI; Ivo J. C. VieiraII,*
I. Laboratório de Tecnologia de Alimentos, Centro de Ciências e Tecnologias Agropecuárias, Universidade Estadual do Norte Fluminense Darcy Ribeiro, Campos dos Goytacazes - RJ, Brasil Recebido em: 11/05/2018 *e-mail: curcinovieira@gmail.com The need to increase the product's shelf life and the growing concern to minimize the use of synthetic products encouraged the researchers to evaluate the antioxidant activity and quantify phenolic compounds as chlorogenic acid, caffeic acid, rutin, quercetin and apigenin through the use of HPLC, in 29 accesses of Capsicum baccatum. Capsicum baccatum var. pendulum is one species of the Capsicum genus widely consumed in Brazil. It is the second largest pepper produced in the world. However, its chemical composition and mainly its extract antioxidant activity have been poorly reported in literature. In order to deepen the study of the access properties relating the antioxidant activity versus content of phenolic compounds. It is suggested that the BRS, 1643a, 1611 and 1613, accession could be used as natural antioxidants in the food industry. INTRODUCTION Human beings are concerned with developing effective methods of food preservation since the earliest times. This growing concern extended to the present days due to the demands of food industry customers on food safety , hygienic-sanitary and nutritional quality and appearance. Hence, the food industry is always aiming at developing effective means and techniques to increase the product shelf life.1 Food is constantly transforming due to natural processes, undergoing chemical changes, such as lipid peroxidation by reactive oxygen species (ROS), which causes unpleasant flavors and odors, changes in nutritional value and a reduction of shelf life. In order to delay such processes, the industry uses various types of synthetic chemical additives which are constantly being questioned due to their possible negative effects in health.2,3 In this context, there have been researches to investigate compounds with antioxidant potential, such as phenolic compounds originated from plant metabolism. These compounds constitute one of the largest groups of plant secondary metabolites, which are responsible for the removal of free radicals that neutralize ROS , therefore having relevance for the food industry. They are used mainly for the conservation of food, which increases time of storage, reduces the nutritional losses and protects food from oxidation.1 It is of great interest to detect bioactive compounds in plant species used as spices, which may have antioxidant activity and contribute to increase of shelf life of foods, without damaging the environment and human health.4 Condiments, such as chili peppers the fruit of plants from the genus Capsicum, widely used by Indians and ancient civilizations to make more palatable food are used to increase shelf life and are sources of natural antioxidants such as vitamin E, vitamin C, and carotenoids.5 These peppers are also rich in capsaicinoids which are phenolic compounds responsible for pungent or spicy taste.6,7 Capsicum baccatum var. pendulum is one of the genus Capsicum species widely consumed in Brazil. It is the second largest pepper produced in the world. However, its chemical composition and mainly its extract antioxidant activity have been poorly reported in the literature8-10 Thus, it is important to improve studies on chili peppers (genus Capsicum) in order to better understand their chemical composition and to determine their antioxidant potential to possibly be used to extend the shelf life of food products, which will certainly result in product of better nutritional quality. Therefore, the present study aims at evaluating the antioxidant activities and the composition of phenolic compounds, by HPLC, with the use of different solvent systems, taking into account the variation of solubility of phenolic compounds of these pepper extracts.
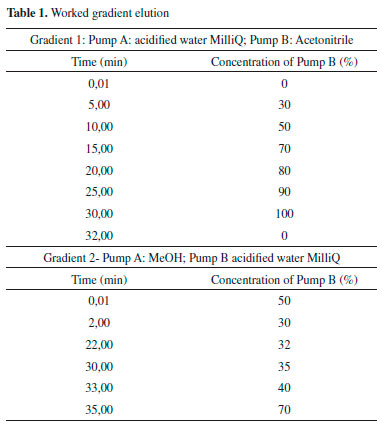
MATERIAL AND METHODS Plant material The plant material consisted of 29 accesses of Capsicum baccatum and a control genotype (BRS- Mari) of the germplasm collection of Centro de Ciências e Tecnologias Agropecuárias da Universidade Estadual do Norte Fluminense Darcy Ribeiro (Figure 1S in Supplementary material). Preparation of extracts The adopted Soxhlet extraction method has been used.7 Initially, the fruits were hand cleaned and separated from the seeds. After that, they were placed in a forced air drying oven at 40 °C where they remained for seven days. After drying, the fruits were crushed in a mortar and pestle and stored away from light, in labeled paper bags. After dried and crushed, the fruits underwent a Soxhlet extraction in 70% ethanol (fruit: solvent 1:10, w/v) for 4 hours. The extracts were concentrated in a rotary evaporator, stored in glass jars protected from light, and refrigerated. Antioxidant activity The evaluation of the antioxidant activity was carried out by the photo-colorimetric method of stable free radical DPPH (2,2-Diphenyl-1-picrylhydrazyl). The technique consists of adding 1 mL of the ethanol extract at concentrations ranging from 10 to 1000 µg mL-1. 1 mL of a methanol solution of DPPH (0.1 mmol L-1) was added to this, followed by the reaction which occurred at room temperature for 1 hour. The absorption of DPPH was immediately checked in a UV-Vis spectrophotometer at 515 nm (the experiments were performed in three replicates). The ability to scavenge free radicals was expressed as a percentage of radical oxidation inhibition and it is calculated as follows:7,11  EC50 value, which is defined as the amount of antioxidant required to scavenge 50% of the initial concentration of the free radical DPPH. It was determined by performing the assays at various concentrations for each extract in the concentration that causes 50% inhibition (EC50). The EC50 value was obtained from the plot of the percent inhibition of DPPH as a function of extract concentration.12 Total phenolic content of the extract The total phenolic content was determined using the Folin-Ciocalteu method as described,13 which was based on the reduction of the phosphotungstic (H3PW12O40) and phosphomolybdic (H3PMo12O40) acids. To prepare the samples samples of each accession, 1 mg was weighed and solubilized with 1 mL of methanol, 30 µL of these solutions were drawn transferred to a 96 well plate. After that, they were added 50 µL of Folin-Ciocalteu reagent (1N) and added 100 µL of sodium carbonate (Na2CO3) 7.5% after 10 min. The absorbance was obtained at 760 nm after 2 h of incubation at room temperature. The total phenols' results were expressed as gallic acid equivalents using a gallic acid standard curve (5.0 to 200 µg µL-1) (Figure 12S). Quantification of phenolic compounds by HPLC Standards (phenolic and flavonoid acids) and the samples extracts were analyzed on Shimadzu Model LC-20A, with LC20AD pumps. The chromatograms were monitored at a wavelength of 254 and 350 nm for phenolic compounds (detector spectrum scanned by ultraviolet photodiode array SPD-M20A) and an injection volume of 20 µL. Reverse phase column RP-18 from Macherey-Nagel (5 µm, 4.0 x 250 mm) was used. For the analysis and quantification of phenolic acids and flavonoids had been tested two types of gradient elution (Table 1) in order to determine the level, comparing higher limit of quantitation of these compounds. The solubility of these compounds varies from according to the solvents used. The solvent systems used were: for the first elution gradient tested MilliQ water acidified with phosphoric acid (pH 3.2) acetonitrile in pump A and pump B, with a flow rate of 1 mL min-1 at 35 °C. For the second gradient eluting, the solvents were MeOH in the pump A and MilliQ water acidified with phosphoric acid (pH 3.2) in pump B, also with a flow rate of 1 mL min-1 and at 35 °C.
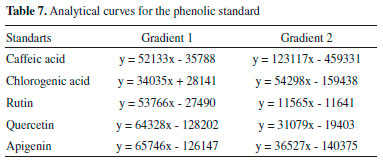
To prepare the samples to be injected, 10 mg of the extract was weighed and solubilized in 1 mL of mobile phase: 500 µL was pipetted of mobile phase contained in the pump A and 500 µL of mobile phase contained in the pump B, following this procedure for the two gradients. Twenty-nine extracts were filtered using of microfilters (Sartorius®) and syringes (BD Plastipak®) were then applied three times to each method, in the liquid chromatograph. Chlorogenic acid (Sigma-Aldrich), caffeic acid (Tedia Brazil), rutin (Merck), quercetin (Merck) and apigenin (Sigma-Aldrich) standards were used to measure the standard curves (Figures 2S to 11S in Supplementary material). For each phenolic standard were made curves (mass x peak area in µg) in varying concentrations (50 µg mL-1, 25 µg mL-1, 10 µg mL-1, 8 µg mL-1, 5 µg mL-1 and 2 µg mL-1), as can it is shown in the Table 7.
To identify and quantify the compounds in samples, comparisons were made of the retention times of the samples with retention times of pure commercial standards. After this preliminary analysis were made co-injections of pure standards and samples were made for further analysis of their retention times. Comparisons between the UV spectrum of the compounds and the commercial standards were also carried out.
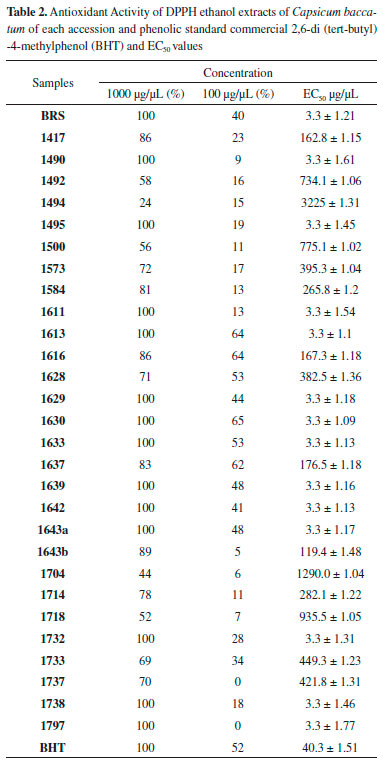
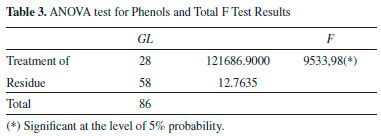
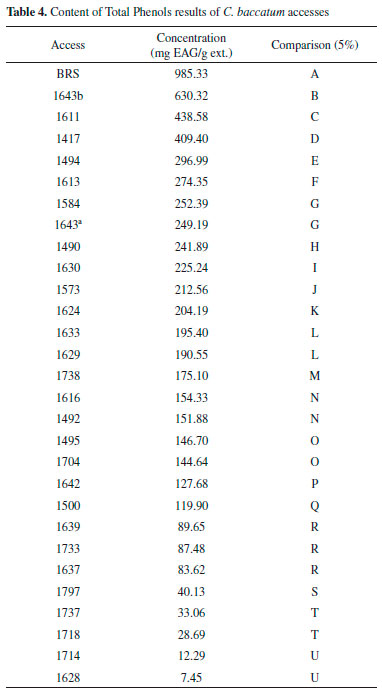
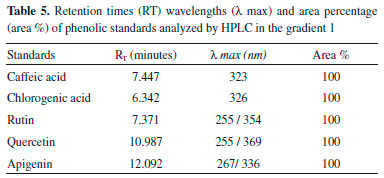
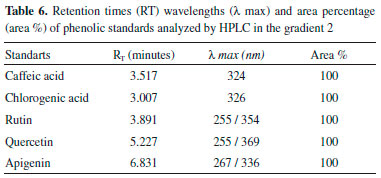
RESULTS Antioxidant activity The extracts were evaluated at concentrations of 1000, 100 and 10 µg/mL and expressed as the antioxidant activity (% Inhibition) and EC50 (extract concentration in µg/mL capable of reacting with 50% of the radical present in the DPPH solution). The results of the antioxidant activity of the DPPH and EC50 values are shown in Table 2, whereas the results of less concentration (10 µg mL-1) are not shown. Total phenols of the extracts analysis In this study, the quantification of total phenols content in different accessions of C. baccatum was performed using the Folin Ciocalteu, which is the most widely used techniques for this purpose. This reagent consists of a mixture of phosphomolybdic and phosphotungstic acids, wherein the molybdenum and tungsten are oxidized in the presence of certain reducing agents. In Table 3 the results of analysis of variance and the F test result can be observed. Table 4 contains the results of the concentration of total phenolics of each accession, expressed as gallic acid equivalents (GAE) per extract according to Scott Knott test. Quantification of phenolic compounds by HPLC Table 5 and Table 6 show a summary of the phenolic standards data obtained from the HPLC in the gradients 1 and 2. It also represents the retention times and the respective wavelengths of phenolic acids and flavonoids, as well as the respective area percentages showing the degree of purity of these standards. It was verified that in the gradient 1 it was possible to quantify levels of phenolic standards assessed in a larger number of accessions in relation to the gradient 2. Therefore, the Table 7 shows the quantification of phenolic acids and flavonoids in each accession analysed of gradient elution 1, obtained according to the Scott Knott test in order to determine the level as compared to higher limit of quantitation of these compounds.
DISCUSSION The commercial standard phenolic structure, BHT (Butyl-hydroxy-toluene), was considered as one of the most widely used synthetic antioxidant in the food industry, therefore a comparison of its antioxidant potential with the accessions investigated in this study was carried out. It is observed that at the highest concentration tested (1000 µg mL‑1) all the accessions were active, and 14 out of the 29 access (Table 2), and the genotype BRS-Mari, showed EC50 (3.3 µg mL-1) less than BHT. At this same concentration, all these samples showed maximum antioxidant activity (100%), which can be compared to the potential of antioxidant BHT, since its antioxidant potential is in the 52% range, (EC50 40.0 µg mL-1). At a concentration of 100 µg µL-1, there was an intermediate percentage of free radical DPPH seized, between 0 and 65%. Accessions 1613, 1616, 1628, 1630, 1633 and 1637, are most significant in this concentration. All the others which had less activity than 50% were not considered as good scavengers of free radicals. Accessions extracts were also tested against DPPH at the concentration of 10 µg µL-1, however, none of the 29 samples, including the genotype (BRS-Mari), showed activity at this concentration level. Phenolic compounds are important components in various fruits and vegetables. It is important to quantify these compounds since they reveal information about the antioxidant activity, the quality of food and thus the potential benefits to human health.14 In recent years these compounds have been the target of numerous studies due to several reasons, but mainly to inhibit lipid peroxidation processes which increases shelf life of fatty foods. Analyzing random variable total phenols, through the use the Scott Knott test, because of the significance of accessions to the analysis of variance at the 5% level of probability, 21 (twenty-one) statistically equal groups were obtained. It seems that the group "A" consisted only of witness genotype BRS-Mari, which is the accession with the highest total phenolic content (985.33 mg GAE/g). The second group consisted only of accession 1643b, with 64.27% of the witness genotype phenols content. As can be observed, BRS accession showed 100% antioxidant activity at 1000 µg µL-1 and consequently, it was the accession that had the highest content of total phenols, suggesting that there is a strong evidence of the association between antioxidant activity and total phenol content, in this case. Since such a relationship for all accessesions cannot be claimed, through the observation of the accession 1494 (group E), for example, a considerable content of phenols (296.99 mg GAE/g) was shown, but its potential antioxidant in 1000 µg µL-1 was only 44%. The same occurred with accession in 1628 (U group), which had the lowest phenolic content of all accessions. However, it showed a significant value of antioxidant activity (71%) at 1000 µg µL-1. The accessions 1639 (group R) and 1797 (group S) showed a phenol content of 89.65 and 40.13 mg GAE/g, respectively, and EC50 3.30 µg µL-1. These results indicated that other compounds could collaborate to the antioxidant activity of these accessions. The failure to find a correlation between total phenolic content and scavenging capacity of free radicals can be explained by several factors. In fact, the contents of total phenols are not just responsible for all antioxidant potential of a test sample. Moreover, one should consider this synergism between the mixture of these antioxidant compounds, which makes the antioxidant activity not only dependent on the concentration of compounds that impart but also on the structure and interaction of these compounds.15 The high-performance liquid chromatography (HPLC) is among the most widely used techniques for identification and quantification of phenolic compounds, as a fast and high-resolution technique.16 In this study, the ethanol extracts were quantified on the content of phenolic acids and flavonoids in two different elution gradients (Table 1). The phenolic compounds quantified were chlorogenic acid, caffeic acid, rutin, quercetin, and apigenin. The selection of these compounds was based on a careful review of the literature. It was found that the presence of these phenolic compounds in peppers (Capsicum baccatum), which is the aim of our study, have been of great demand, in recent years, and consumer preference for peppers. It is also noted an increasing number of varieties available in supermarkets, consumed as vegetable cultivars as spices.15 In addition to considering the antioxidant potential and consequently the inhibitory power of lipid oxidation processes in food, these classes of phenolic compounds were the main objective of this study.
CONCLUSIONS Antioxidant activity was only observed at concentrations of 100 µg µL-1 and 1000 µg µL-1, considering the best accession of those that showed 100% activity, which were: BRS, 1490, 1495, 1611, 1613, 1629, 1630, 1633, 1639, 1642, 1643a, 1732, 1738, 1797. The Quantification of total phenols to 21 groups (Groups AU) statistically equal (985.33 mg) was obtained, with Group A consisting the best result, thus it appears that in group A the BRS accession was only observed, and this had the highest total phenolic content GAE/g). For the quantification of phenolic compounds by HPLC, in both gradients, it was observed that chlorogenic acid was measured in the standard phenolic greater number of accessions, compared to the others. The gradient 1, 1417 accession (1.54 mg/g) showed the highest content of chlorogenic acid, Access 1490 (0.74 mg/g), higher levels of caffeic acid, accession 1494 (0.34 mg/g) higher content of quercetin and accession 1714 (0.82 mg/g) higher concentration of rutin. In the gradient 2, accession 1613 showed a higher concentration of caffeic acid, chlorogenic acid, and 1633 BRS accession a higher content of rutin. The flavonoid apigenin has not been identified and quantified in any of the samples in those two gradients. It was observed that in the gradient 1 it was possible to quantify levels of phenolic patterns evaluated in a larger number of accessions. It is suggested that these differences are due to the difference of polarity between methanol and acetonitrile and other factors such as viscosity and the UV absorption band spectrum. The initial results showed in this work suggested that the BRS, 1643a, 1611 and 1613 accessions could be used as natural antioxidants for the food industry, and stand out from other accessions because they are considered good sources of antioxidants and phenolic compounds.
SUPPLEMENTARY MATERIAL Illustrations and calibration curves for the compounds can be freely accessed online at http://quimicanova.sbq.org.br, in a PDF file.
ACKNOWLEDGEMENTS The authors thank CAPES, CNPq, FAPERJ and UENF.
REFERENCES 1. Zhong, Y.; Shahidi, F.; Food Chem. 2012, 131, 22. 2. Bozkurt, H.; Meat Sci. 2006, 73, 442. 3. Castelo-Branco, V. N.; Torres, A. G.; Revista de Nutriçao 2011, 24, 173. 4. Costa, L. M.; Moura, N. F.; Marangon, C.; Mendes, C. E.; Teixeira, A. O.; Ciênc. Tecnol. Aliment. 2009, 30 supl. 1, 51. 5. Reifschneider, F. J. B.; Capsicum: pimentas e pimentoes no Brasil, Embrapa Comunicaçao para Transferência de Tecnologia/Embrapa Hortaliças: Brasília, 2000. 6. Carvalho, S. I. C.; Bianchetti, L. B.; Sistema de produçao de pimentas, 2012. Disponível em: https://sistemasdeproducao.cnptia.embrapa.br/FontesHTML/Pimenta/Pimenta_capsicum_spp/index.html, acessado em Setembro 2018. 7. Zimmer, A. R.; Leonardia, B.; Mirona, D.; Schapovala, E.; de Oliveira, J. R.; Gosmanna, G.; J. Ethnopharmacol. 2012, 139, 228. 8. Kappel, V. D.; Costa, G. M.; Scola, G.; Silva, F. A.; Landell, M. F.; Valente, P.; Souza, D. G.; Vanz, D. C.; Reginatto, F. H.; Moreira, J. C.; J. Med. Food 2008, 11, 267. 9. Rodriguez-Burruezo, A.; Gonzalez-Mas Mdel, C.; Nuez, F.; J. Food Sci. 2010, 75, 446. 10. Kollmannsberger, H.; Rodriguez-Burruezo, A.; Nitz, S.; Nuez, F.; J. Sci. Food Agric. 2011, 91, 1598. 11. Yen, G. C.; Duh, P. D.; J. Agric. Food Chem. 1994, 42, 629. 12. Moraes, L. P.; Paz, M. F.; Argandoña, E. J. S.; Silva, L. R.; Zago, T. O.; Biochem. Biotechnol. Rep. 2012, 1, 33. 13. Singleton, V. L.; Orthofer, R.; Lamuela-Raventos, R. M.; Oxidants and Antioxidants, Part A 1999, 29, 152. 14. Talcott, S. T.; Percival, S. S.; Pittet-Moore, J.; Celoria, C.; J. Agric. Food Chem. 2003, 51, 935. 15. Conforti, F.; Statti, G. A.; Menichini, F.; Food Chem. 2007, 102, 1096. 16. Dutra, F. L. G.; Ribani, R. H.; Quim. Nova 2010, 33, 119. |
On-line version ISSN 1678-7064 Printed version ISSN 0100-4042
Qu�mica Nova
Publica��es da Sociedade Brasileira de Qu�mica
Caixa Postal: 26037
05513-970 S�o Paulo - SP
Tel/Fax: +55.11.3032.2299/+55.11.3814.3602
Free access


