Artigo
| Development of cloud point extraction-scanometry, for the preconcentration and determination of colorless species: application for the determination of phenylalanine |
|
Ardeshir ShokrollahiI,*; Masuod RefahiI
Department of Chemistry, Yasouj University, 75918-74831, Yasouj, Iran Recebido em: 30/05/2018 *e-mail: ashokrollahi@yu.ac.ir In this study, a simple, fast, portable, environment-friendly and inexpensive method, CPE-scanometry, is applied for the determination of Phenylalanine (Phe) amino acid. The extraction of analytes from water samples (15 ml) was performed in the presence of Triton X-114 as a non-ionic surfactant in a water bath environment, diluting the extracted surfactant-rich phase with alkali ethanol as a suitable solvent to 0.5 mL and transferring an appropriate volume to a special cell. The individually cylindrical cavities in the sheet of Plexiglas serve as reaction chambers. These cylindrical cavities in the sheet of Plexiglas are fabricated with a laser beam. The cells containing the analyte solution were scanned with a scanner, then the color of each cell was analyzed, by software written in Visual Basic (VB 6), to obtain the red, green and blue values. The influence of operation parameters including pH, concentrations of surfactant and electrolyte on the cloud point extraction of analyte were studied and optimum conditions were established. Under optimum condition, limit of detection (LOD), relative standard deviation (RSD) and linear range for the proposed method are obtained 0.06, 3.42 and 0.2-10.0 mg L-1 respectively. Finally, the proposed method was utilized successfully for the determination of Phenylalanine in some water and waste water samples in recoveries range 94.1-107.7%. INTRODUCTION Phenylalanine (Phe), an aromatic essential amino acid is required for normal growth and metabolic processes. It is the precursor of tyrosine and a whole series of neurotransmitters and hormones. Phe can be converted to tyrosine by tetrahydrobiopterin-dependent phenylalanine hydroxylase (PAH) in liver and kidneys but Phe cannot be synthesized back from tyrosine.1,2 The analysis of Phe is of interest in the early detection of phenylketonuria (PKU) in neonates.3 PKU is inherited in an autosomal recessive pattern. It occurs due to mutations in the PAH gene, which provides instructions for making an enzyme called phenylalanine hydroxylase. Without the enzyme, Phe do not convert into Tyr4-6 and causes a raised up to the level of Phe in the blood. If PKU is not treated, This can eventually lead to learning disability and other serious health problems. Several methods have been reported for the determination of Phe including high performance liquid chromatography (HPLC),7 gas chromatography-mass spectrometry,8 electrochemical chromatography,9 molecularly imprinted polymer sensor,10 mass spectrometry,11 Potentiometry,12 spectrofluorimetry13 and enzymatic methods.14 Those methods are capable of providing very high sensitivity and reliable analytical information. However, most of these methods involve either expensive analytical instruments or complicated and time-consuming sample preparation. The solution scannometric technique has been introduced recently by Abbaspour et al.15 with the aim of improving "paptode"16 (from paper optode), Paptode and solution scanometry were coupled by our group with cloud point extraction (CPE) successfully.17,18 Commercially available flatbed-scanners were used to obtain the images of color solutions. The obtained images were transferred to a computer for analyzing and determining the intensity of color solutions. The method is based on scanning of the solution in Plexiglas® cells. The solution was scanned and finally, the RGB (red, green and blue) color model was used in color monitor.17,19,20 The simplicity of the instrumentation and procedures, speed, precision and accuracy of the technique make the solution scanometric method conspicuous. Even though of cited advantages, direct determination of trace concentrations of analytes by this technique is not satisfactorily sensitive so that a preconcentration step is required. Watanabe et al.21 for the first time in 1978 introduced an unconventional liquid-liquid extraction method known as cloud point extraction (CPE) to extract metallic ions from aqueous samples. CPE has been shown to be an effective analyte extraction, preconcentration and purification procedure for improving sensitivity, selectivity, detection limit and other analytical characteristics prior to HPLC,22 GC,23 CE,24 spectroscopy,25,26 inductively coupled plasma (ICP),27 atomic absorption spectrometry,28,29 flow injection,30 paptode17 and scanometry based on solution.18 Compared with other extraction methods, such as liquid-liquid extraction, CPE is a green method that moderates consumption, contact to a solvent, discarding costs, extraction time and it is safer because small volumes of noxious surfactants are used as a substitute of toxic organic solvents.31 CPE technique has been successfully employed for the preconcentration of compounds such as dyes,17 food samples,32 environmental samples,33 biological samples,34 biomaterials35 and pharmaceutical.36,37 In this work, cloud point extraction- solution scanometry (CPE- solution scanometry) as a simple, fast, portable, selective and inexpensive method, has been developed for separation, preconcentration and determination of Phe in aqueous samples.
EXPERIMENTAL Chemical All chemicals used in this work were of analytical grade. Additionally, double distilled water was used throughout. Phenylalanine was purchased from Sigma Chemical Company (St. Louis, MO, USA). Aqueous solution 1% (w/v) of Triton X-114 was prepared by dissolving 1.0 g of Triton X-114 (obtained from Fluka, Buchs, Switzerland) in 100 mL water. The surfactant-rich phase was diluted with alkaline ethanol that was purchased from M/s Merck (E. Merck, Darmstadt, Germany). The cation and anion salts that used for intrerferences study were purchased from Merck of the highest purity available and used without any further purification. Other chemicals were from Merck. Apparatus and software The cells (with 1000 µL volume for each of them) were fabricated by using a sheet of Plexiglas®.15 A Canoscan LiDE 200 flatbed scanner was used for scanning the cells. The resolution of the scanner was regulated at 300 dpi. The VB based special software16 was used to transform the recorded pictures of cells to RGB data. A Biohit prolinepipettor 100-1000 µL was used for injecting samples into the cells. A Metrohm (Herisau, Switzerland) digital pH meter model 827 with a combined glass electrode was used to measure pH values. Absorbance measurements were made by UV-Vis spectrophotometer Lambda-25 (Perkin-Elmer) equipped with 1 cm quartz cells. Centrifuge, TEB ARIA model (Iran) was used for the cloud point methodology. A F.A.G thermostat bath (Iran) maintained at the desired temperature was utilized for the cloud point temperature experiments. Principles of the red, green and blue (RGB) color system The RGB color model is an additive color model. In the model, a color is described by specifying the intensity levels of the color red, green, and blue. The typical range of intensity values for each color is, 0-255, which gives 16,777,216 different colors. In the RGB system, any color is represented in the form of (R, G, B), that , the black color is represented by the '0 0 0' RGB value (R=0, G=0 and B=0) while the white color is represented by the '255 255 255' RGB value (R=255 G=255 and B=255).15 It should also be mentioned that the R, G or B color value that has the same color as the solution is usually useless, as this value is often higher than 180 and does not significantly change during the experiment. In this work, due to the purple solutions of alkaline Phe, the red and blue values did not change significantly, so the intensities of the green values were chosen. Optimization of the parameters affecting the extraction plus the calibration curve was based on the G (green) color value as the analytical signal. Preparation of cells array The individually cylindrical cavities in the sheet of Plexiglas serve as reaction chambers. These cylindrical cavities (id 1.5 cm) in the sheet of Plexiglas® (thickness 0.5 cm) are fabricated with a laser beam. In order to close the bottom of the holes and make the cells, this holed sheet was stuck to another sheet of Plexiglas® (thickness of 0.1 cm). In our design the cells were aligned to 3 columns and 7 rows, giving a total of 21 cells in the Plexiglas® sheet. Procedure For the cloud point extraction, aliquots of a solution containing the analyte, 3.5 mL of Triton X-114 (1.0 % w/v), 0. 5 mL of KCl (3.0 mol L-1) were mixed in 15 mL centrifuge tube. Then pH of the solution was adjusted to the desired value (pH =4.0). The solution was diluted to the mark with double distilled water. Then, the mixture was heated for 12.5 min in a thermostatic bath at 40 °C. A cloudy solution (water/TX-114) was formed in the test tube, and separation of the aqueous and surfactant-rich phase was accomplished by centrifugation for 10.0 min at 3000 rpm. The surfactant-rich phase became viscous and was recollected at the bottom of the tubes while the bulk aqueous phase decanted easily with a pipette Pasteur. The surfactant-rich phase was diluted with 0.5 mL of NaOH solution in ethanol (0.25 mol L-1). Next exactly 0.48 mL of this solution was injected into one cell on Plexiglas® sheet, and other cells in the same way. The cells were shaken to obtain the homogenous color and after that the Plexiglas sheet was scanned with the scanner, the image was transferred into the computer and any color changes in each cell were analyzed using a program written in VB 6 media. In this program, the color of each cell is analyzed based on the RGB system in to R, G and B values. In the color analysis programs, a specific area for analyzing with approximately 10000-300000 pixels was selected. Therefore the noise can be vividly decreased. The effective intensity for any color values was calculated as follows:  where Ax is the effective intensity for red, green or blue. Cs and Cb are the red, green or blue color values of a sample and a blank, respectively. Sample preparation Three water samples, including Farasan waste water (Farasan, Iran), Sepidan waste water (Sepidan, Iran), mineral water (Sepidan, Iran) were collected. Each water sample was filtered, in order to remove any suspended material . Amount of 4-5 mL of each sample was taken and analyzed according to the method mentioned in the procedure section.
RESULTS AND DISCUSSION The solution of Phe in alkalic ethanol after CPE with Triton X-114, was scanned firstly, then the RGB parameters of the image of this solution were recorded. The G parameter was found to be the most sensitive signal without and with CPE (0.0199 and 0.2037 respectively for 3.0 mg L-1 of Phe). Also, by comparing the slope of the calibration curve before and after extraction, will be clarified, the effect of preconcentration and extraction on the improving of the sensitivity of the proposed method. Increasing the slope after extraction indicates that this procedure can be used as a sensitive method for the determination of Phe. In order to achieve a high extraction efficiency and enrichment factors, various factors which might have influenced the experiment were investigated. The optimization of parameters were carried out in an aqueous solution containing 3.0 mg L-1 of Phe respectively, by modifying one at a time method. Effect of pH The pH of the sample solution has a key role in the extraction of the target analytes because it affects the existing forms of analytes and their partitioning between the micellar phase and aqueous phase. Generally, the solution pH determines the charged form of analytes and thus affects the extraction efficacy of the target analytes. When ionizable species exist in solution for uncharged form, maximum extraction efficiency can be achieved.38 So, the influence of pH values on extraction efficiency and obtained signals was studied in the range of 2.0-7.0. Due to the acidity constants of Phe (pka1: 1.83 and pka2: 9.13),39 at low pH the neutral form of Phe transfers to the surfactant phase and the extraction efficiency increases. In extremely acidic pH, Phe becomes cationic, and therefore recovery is reduced. At higher pH, especially in alkaline solutions, the anionic form is mostly present and this causes a reduction in the extraction efficiency. As it is shown in Figure 1, the maximum effective intensity for Phe is achieved at pH 4.0. Therefore at this pH, Phe has the most affinity to surfactant phase and so the extraction efficiency is maximum. In the further experiments, pH 4.0 was selected as optimum.
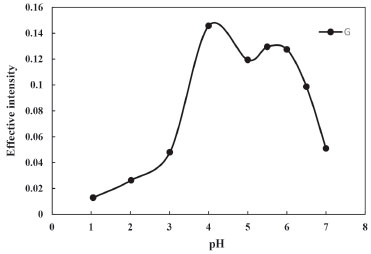 Figure 1. Effect of pH of the test solution on the CPE of Phe (conditions: Phe, 3.0 mg L-1; Triton X-114, 0.23% (w/v); Temperature of bath, 40 °C; Time of bath, 12.5 min)
Effect of the Triton X-114 concentration The amount of Triton X-114, not only affected the extraction efficiency but also the volume of surfactant-rich phase. Triton X-114 was chosen because of its commercial availability in a high-purified homogenous form, low toxicological properties and cost. Also, the appropriate range of cloud point (25-30 °C) of Triton X-114 allows it to be used in the extraction and/or preconcentration for a large number of analytes.40-42 Figure 2. shows that the measured effective intensity of extracted solution increased as the surfactant concentration increased, and then slightly decrease when the surfactant concentration passed the maximum extraction efficiency. At low concentrations of surfactant, extraction was incomplete. Whereas at higher concentrations, slight decrease in the extraction efficiency was observed due to remaining of very small amounts of Triton X-114 and analytes in the aqueous phase. This could compete with the surfactant-rich phase to draw a small portion of analyte into itself. Correspondingly, at a high concentration of surfactant, the viscosity of the enrichment phase increased and the signal decreased. Therefore, 0.23% Triton X-114 was chosen that minimize the phase volume ratio and achieve the highest extraction efficiency.
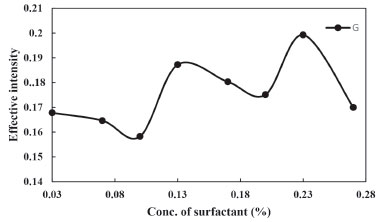 Figure 2. Effect of Triton X-114 concentration on the CPE of Phe (conditions: Phe, 3.0 mg L-1; pH, 4.0; Temperature of bath, 40 °C; Time of bath, 12.5 min)
Effect of salt concentration The cloud point of micellar solutions can be controlled by addition of salts, alcohols, non-ionic surfactants and some organic compounds. When small amounts of inorganic salts were added to the system, a decrease in the cloud point temperature was noted.43 This fact indicates that it is necessary to consider the secondary effects of the electrolytes, i.e. salting-out and formation of ion pair between ionic analytes and counter ions of electrolytes. Based on these discussions, the effect of KCl solution in the range of 0.0-0.4 mol L-1 on the micellar solutions of Phe, was examined. The extraction efficiency of Phe was increased with increasing the KCl concentration from 0.0 to 0.1 mol L-1 and then slowly decrease, the results are shown in Figure 3. The higher concentration of KCl (>0.1 mol L-1) might reduce the diffusion rates of the analyte into the surfactant-rich phase that caused the decrease in extraction efficiency of Phe from aqueous phase to organic phase. In relation to the results of salt study, it seems that formation of ion pairs also is an important factor on neutralization of Phe and in the consequence upturn extraction efficiency.
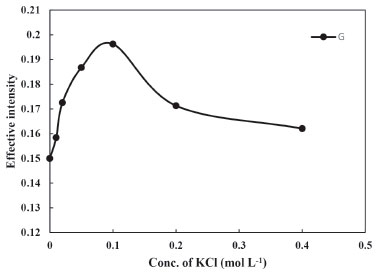 Figure 3. Effect of salt concentration on the CPE of Phe (conditions: Phe, 3.0 mg L-1; pH, 4.0; Temperature of bath, 40 °C; Time of bath, 12.5 min)
Effects of equilibration temperature and time It was useful to employ the shortest equilibration time and the lowest potential equilibration temperature, as a cooperation between completion of extraction and effective separation of phases. The best equilibrium temperature and the time needed to reach easy phase separation and efficient preconcentration were investigated. At lower temperature and times, the two phases cannot be formed, however, higher temperature and time cause the dissociation of micelle-Phe assembly while much higher temperatures may cause decomposition of the analyte. The effect of equilibrium temperature and time in the ranges of 30.0-60.0 °C and 5.0-20.0 min was examined respectively. The results were shown in Figures 4 and 5. It was found that the extraction efficiency reaches to its maximum at 40.0 °C (Figure 4). Therefore, an equilibration temperature of 40.0 °C was chosen for all following experiments. Maximum extraction efficiency was reached at 12.5 min. As a result, an incubation time of 12.5 min was chosen to be used as optimum time (Figure 5).
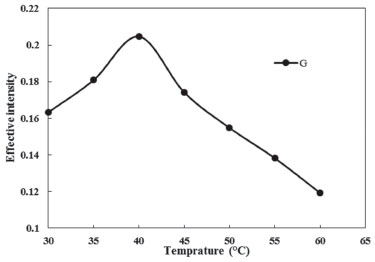 Figure 4. Effect of equilibration temperature on the CPE of Phe (conditions: Phe, 3.0 mg L-1; Triton X-114, 0.23% (w/v); pH, 4.0; Time of bath, 12.5 min)
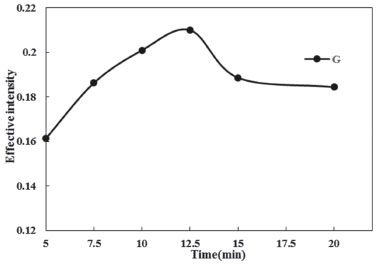 Figure 5. Effect of equilibration time on the CPE of Phe (conditions: Phe, 3.0 mg L-1; Triton X-114, 0.23% (w/v); pH, 4.0; Temperature of bath, 40 °C)
Effect of centrifuge time The centrifuge time did not have a considerable effect on the analytical features of the CPE method but accelerated phase separation. Keeping the optimized variables, the influence of centrifuge time on CPE was studied within a range of 5.0 20.0 min and the results of this study are shown in Figure 6. The results revealed that 10.0 min were enough to get a complete phase separation, and no significant enhancement was observed for longer periods of time due to cooling down of the CPE system or partial back extraction to the aqueous phase and a few decreasing in the signal. Consequently, a centrifugation time of 10.0 min was chosen as the optimal.
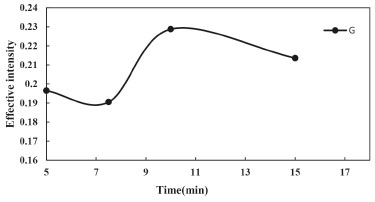 Figure 6. Effect of centrifugation time on the CPE of Phe (conditions: Phe, 3.0 mg L-1; Triton X-114, 0.23% (w/v); pH, 4.0; Temperature of bath, 40 °C)
Effect of NaOH concentration (coloring agent) Consistent with this point that only colored analyte or solution can be studied by solution scanometric method, and Phe is colorless in acidic and neutral solution and it is pink in alkaline medium, thus after centrifugation and decanted bulk aqueous phase, the surfactant-rich phase must be dissolved in alkaline solution. So the surfactant-rich phase was diluted to 500 µL with NaOH solution in ethanol. The concentration of the NaOH solution was also investigated and optimized. As shown in Figure 7. the highest effective intensity for G parameter was obtained at 0.25 mol L-1 of NaOH.
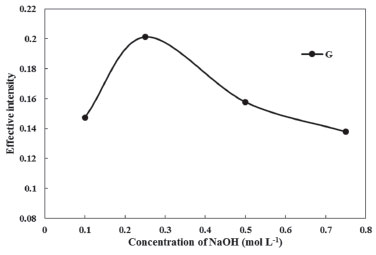 Figure 7. Effect of NaOH concentration on the CPE of Phe (conditions: Phe, 3.0 mg L-1; Triton X-114, 0.23% (w/v); pH, 4.0; Temperature of bath, 40 °C)
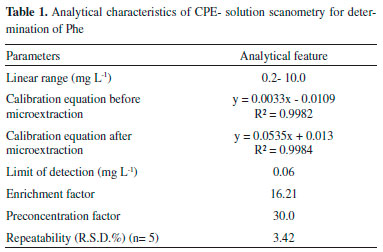
Analytical figures of merit Under the optimal conditions obtained above, the analytical performance of the proposed method was investigated. The results are listed in Table 1. A calibration curve was obtained (y = 0.0535x + 0.013) with a linear dynamic range of 0.2-10.0 mg L-1 and a correlation determination coefficient (r2) of 0.9984. The detection limit based on three times of the standard deviation of the blank (3Sb) for G factor was found to be 0.06 mg L-1 (n=5). The relative standard deviation (R.S.D.) for six replicate measurements of 3.0 mg L-1 of Phe was 3.42% for G parameter. As the R and B values does not change significantly by varying the concentration of Phe, the RSD and detection limit values were calculated only for G value. The preconcentration factor that define as ratio of the initial aqueous volume (15.0 mL) to the final volume (0.5 mL) was obtained 30.0. Finally, the calculated enhancement factor was up to 16.21 on the basis of division of sensitivity after and before extraction (calibration equations are shown in Table 1).
Interference study Due to the importance of the effects of matrix ions on the selectivity and utility of the method, the possibility of interferences of the various ions and organic compounds on the determination of 3.0 mg L-1 of Phe by the proposed method was studied. Variation over ±5% in the analytical signal that resulted from foreign species was taken as interference. The results are shown in Table 2. As it is observed most of the interferences that were tested do not have significant effect on the determination of Phe and many of them are tolerated at very high levels.
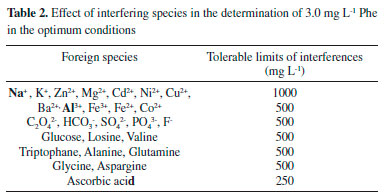
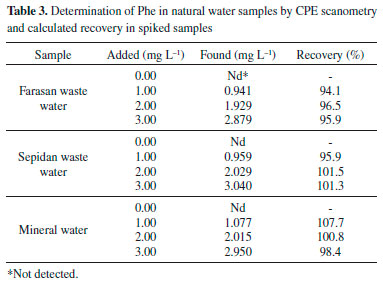
Application In order to test the reliability of the proposed CPE-Scanometry method for extraction and determination of Phe in the water samples, three water samples including Farasan and Sepidan waste water and Sepidan mineral water were applied. No target analyte was found in these samples. To examine the relative recoveries, spiking Phe to the samples confirmed the validity of the procedure. Table 3 summarizes the results obtained for water samples. The recoveries are in the range 94.1-107.7%, indicating that the proposed method can be used successfully for the determination of Phe in water samples.
CONCLUSION In this paper, CPE-Scanometry was used for the determination of Phe as a colorless analyte. The proposed method employs cloud point extraction for preconcentration of analyte and the solution scanometry as a new determining method. This method offers, facility, high speed, sensitivity, low cost and safety. The results proved the effectiveness of the cloud point extraction system in quantitatively extraction and preconcentration of Phe. Without tedious pre-separation procedures and expensive instrumentation, this method has been successfully used to determine Phe in the water samples with high recoveries.
ACKNOWLEDGMENTS We gratefully acknowledge the support of this work by the Yasouj University Research Council.
REFERENCES 1. Li, P.; Mai, K.; Trushenski, J.; Wu, G.; Amino Acids 2009, 37, 43. 2. Zehra, S.; Khan, M. A.; Aquaculture 2014, 433, 256. 3. Winkelman, J.; Cannon, D.; Jacobs, S.; Henry, J.; Cannon, D.; Winkelman, J.; Clinical Chemistry: Principles and technics, 2nd ed., Harper/ROW: Hagerstown, 1974, p. 1003. 4. Smith, I.; Cook, B.; Beasley, M.; Br. Med. J. 1991, 303, 333. 5. Okano, Y.; Eisensmith, R. C.; Güttler, F.; Lichter-Konecki, U.; Konecki, D. S.; Trefz, F. K.; Dasovich, M.; Wang, T.; Henriksen, K.; Lou, H.; N. Engl. J. Med. 1991, 324, 1232. 6. Mo, X. M.; Li, Y.; Tang, A. G.; Ren, Y. P.; Clin. Biochem. 2013, 46, 1074. 7. Kadar, R.; Zakova, P.; J. Chromatogr. B 2009, 877, 3926. 8. Deng, C.; Deng, Y.; Wang, B.; Yang, X.; J. Chromatogr. B 2002, 780, 407. 9. Dou, L.; Krull, I.; J. Pharm. Biomed. Anal. 1990, 8, 493. 10. Casey, C. N.; Campbell, S. E.; Gibson, U. J.; Biosens. Bioelectron. 2010, 26, 703. 11. Meesters, R. J. W.; Wolfe, R. R.; Deutz, N. E. P.; J. Chromatogr. B 2009, 877, 43. 12. Sasaki, S.; Hashizume, A.; Citterio, D.; Fujii, E.; Suzuki, K.; Angew. Chem. 2002, 114, 3131. 13. Zhang, K.; Yan, H. T.; Zhou, T.; Spectrochim. Acta, Part A 2011, 83, 155. 14. Parra, M. J. A.; Mateos, A. A.; Mata, M. M.; de Marıa, C. G.; Talanta 1998, 47, 121. 15. Abbaspour, A.; Khajehzadeh, A.; Ghaffarinejad, A.; Analyst (Cambridge, U. K.) 2009, 134, 1692. 16. Abbaspour, A.; Mehrgardi, M. A.; Noori, A.; Kamyabi,; M. A.; Khalafi-Nezhad, A.; Rad, M. N. S.; Sens. Actuators, B 2006, 113, 857. 17. Shokrollahi, A.; Abbaspour, A.; Ardekani, Z. A.; Malekhosseini, Z.; Alizadeh, A.; Anal. Methods 2012, 4, 502. 18. Shokrollahi, A.; Roozestan, T.; Anal. Methods 2013, 5, 4824. 19. Abbaspour, A.; Valizadeh, H.; Khajehzadeh, A.; Anal. Methods 2011, 3, 1405. 20. Abbaspour, A.; TalebanpourBayat, E.; Mirahmadi, E.; Anal. Methods 2012, 4, 1968. 21. Watanabe, H.; Tanaka, H.; Talanta 1978, 25, 585. 22. Wang, L.; Cai, Y. Q.; He, B.; Yuan, C. G.; Shen, D. Z.; Shao, J.; Jiang, G. B.; Talanta 2006, 70, 47. 23. Sikalos, T. I.; Paleologos, E. K.; Anal. Chem. 2005, 77, 2544. 24. Cerutti, S.; Silva, M. F.; Gásquez, J. A.; Olsina, R. A.; Martínez, L. D.; Electrophoresis 2005, 26, 3500. 25. Bingjia, Y.; Li, Y.; Qiong, H.; Akita, S.; Chin. J. Chem. Eng. 2007, 15, 468. 26. Wen, X.; Wu, P.; Chen, L.; Hou, X.; Anal. Chim. Acta 2009, 650, 33. 27. Li, Y.; Hu, B.; Spectrochim. Acta, Part B 2007, 62, 1153. 28. Shokrollahi, A.; Ghaedi, M.; Hossaini, O.; Khanjari, N.; Soylak, M.; J. Hazard. Mater. 2008, 160, 435. 29. Jiang, X.; Wen, S.; Xiang, G.; J. Hazard. Mater. 2010, 175, 146. 30. Gil, R. A.; Salonia, J. A.; Gasquez, J. A.; Olivieri, A. C.; Olsina, R.; Martinez, L. D.; Microchem. J. 2010, 95, 306. 31. Gouda, A. A.; Amin, A. S.; Spectrochim. Acta, Part A 2014, 120, 88. 32. Chen, L.; Zhao, Q.; Jin, H.; Zhang, X.; Xu, Y.; Yu, A.; Zhang, H.; Ding, L.; Talanta 2010, 81, 692. 33. Fontana, A. R.; Silva, M. .; Martínez, L. D.; Wuilloud, R. G.; Altamirano, J. C.; J. Chromatogr. A 2009, 1216, 4339. 34. Suna, M.; Wub, Q.; J. Hazard. Mater. 2011, 192, 935. 35. Lopes, A. S.; Garcia, J. S.; Catharino, R. R.; Santos, L. S.; Eberlin, M. N.; Arruda, M. A. Z.; Anal. Chim. Acta 2007, 590, 166. 36. Madej, K.; Trends Anal. Chem. 2009, 28, 436. 37. Rukhadze, M. D.; Tsagareli, S. K.; Sidamonidze, N. S.; Meyer, V. R.; Anal. Biochem. 2000, 287, 279. 38. Rial-Otero, R.; Gonzalez-Rodríguez, R. M.; Cancho-Grande, B.; Simal-Gándara, J.; J. Agric. Food Chem. 2004, 52, 7227. 39. Carey, F. A.; On-Line Learning Center for "Organic Chemistry", University of Calgary, 2002, p. 29. 40. Liu, W.; Zhao, W. J.; Chen, J. B.; Yang, M. M.; Anal. Chim. Acta 2007, 605, 41. 41. Materna, K.; Szymanowski, J.; J. Colloid Interface Sci. 2002, 255, 195. 42. Niazi, A.; Momeni-Isfahani, T.; Ahmari, Z.; J. Hazard. Mater. 2009, 165, 1200. 43. Wang, L.; Cai, Y. Q.; He, B.; Yuan, C. G.; Shen, D. Z.; Shao, J.; Jiang, G. B.; Talanta 2006, 70, 47. |
On-line version ISSN 1678-7064 Printed version ISSN 0100-4042
Qu�mica Nova
Publica��es da Sociedade Brasileira de Qu�mica
Caixa Postal: 26037
05513-970 S�o Paulo - SP
Tel/Fax: +55.11.3032.2299/+55.11.3814.3602
Free access


