Nota Técnica
| Thermogravimetric and ftir analyzes of corn cob pyrolysis |
|
Elías Ricardo Durango PadillaI; Gabriela Tami NakashimaI; Ana Larissa Santiago HanstedII; Luis Ricardo Oliveira SantosI; Joao Lucio de BarrosIII; Andrea Cressoni De ContiIV; Fabio Minoru YamajiI,*
I. Departamento de Ciências Ambientais, Universidade Federal de São Carlos, 18052-780 Sorocaba - SP, Brasil Recebido em 20/01/2019 *e-mail: fmyamaji@ufscar.br Charcoal has a large share in the Brazilian market. The production is carried out by pyrolysis of biomass at different temperatures, between 300 and 500 °C. In this study, the corn cob pyrolysis was investigated using thermogravimetric analysis (TGA) and Fourier Transform Infrared Spectroscopy (FTIR). Samples after pyrolysis were compared with raw biomass to evaluate changes in fuel characteristics. In DTG curves a reduction in the number of degradation peaks in the carbonized material was observed. The FTIR spectra allowed to identify the aromatic ring of the lignin in the charcoals structure, indicating the presence of this compound even in charcoals produced with a temperature of 500 °C. It can be concluded that the temperature of 400 °C was enough to completely degrade the hemicellulose and cellulose of the biomass, resulting the final product (charcoal) less reactive or thermally more resistant than the in natura corn cob. INTRODUCTION Fossil fuels are responsible for the production of pollutants and gases that can intensify the greenhouse effect. Thus, there is a recurring concern about the use of these resources. The substitution of these sources is a constant search for several industrial sectors, due to ecological and economic problems. The unpredictability of cost and supply are other disadvantages of using petroleum derivatives.1 Nevertheless, there are studies regarding the use of the petroleum residues for commercial purposes.2,3 However, renewable sources for power generation are options with increasing demand worldwide. Brazil has climatic and geographical advantages for the use of natural resources. In the country the most used renewable sources are hydroelectric, biomass, wind and solar. These renewable sources represent more than 70% of the country's electricity generation, due to the significant potential of hydroelectric plants. It is also possible to verify a notorious increase of the participation of biomasses, due to the use of agricultural and forestry residues.4 A vegetable biomass is a renewable resource used since the beginning of human evolution, with energy use potential due to the economic and environmental appeal. Firewood and other wastes from agro-industrial production represent raw materials for the heat and electricity generation. This vegetable biomass emits CO2 during the burning, but in its growth and development, promotes the fixation of this gas, representing less damage to the environment.5 Biomass waste appears as an economical solution for industries that generate this material or buy at a reduced cost. This biomass can be used raw or through the charcoal production.6,7 Charcoal has a large share in the Brazilian market. Production can be carried out by pyrolysis at temperatures ranging from 400 to 500 °C. One of the disadvantages of biomass pyrolysis is the low yield, which does not reach 40%.8 This product is used in Brazilian industries in the steel sector.9 The corn cob, an agricultural waste, has been studied due to the great amount of its generation in many countries. This residue, like most vegetable residues, presents heterogeneous characteristics, as a result of the harvesting and the area where it is developed. The predictability of the behavior of these biomasses are studied topics, and techniques must be used for their characterization.10 Since the process needs improvements in the procedure, some techniques must be applied in order to establish a higher yield. The techniques of thermogravimetric analysis (TGA) allow the record visualization of the mass loss of the sample when subjected to a pre-established heating program. TGA allows to obtain information about the reactions that must occur during the pyrolysis. Parameters such as chemical composition and the heating ratio can be compared in this analysis.11 Thermogravimetry was used in order to evaluate thermal and catalytic degradation of atmospheric residue of petroleum.2 The thermogravimetric analysis is also relevant to determine the physico-chemical characteristics of the biomass; such as the moisture content, volatile, fixed carbon and ashes, as well as the combination of all these parameters. Thus, this analysis allows a better understanding of the studied material and may indicate its energy generation potential.12 FTIR - Fourier Transform Infrared analysis allows identification of the composition and unknown materials in the sample or impurities. As the material absorbs infrared light, the energy absorbance at different wavelengths is measured, determining the composition and molecular structure of the sample. This technique is efficient to determine the modifications in the biomass structure after the different pyrolysis temperatures.13 Therefore, the aim of this paper was to characterize by means of the FTIR and TG techniques the charcoal produced from corn cob in different pyrolysis conditions.
MATERIAL AND METHODS The material used was corn cob, collected at a company located in the city of Tatuí-SP. The corn cob was manually chopped in sizes of 2 cm and oven dried at 105 °C for 72 h. Three different pyrolysis temperatures were used for the charcoal production: 300, 400, and 500 °C. These temperatures were chosen because the production of commercial charcoal in Brazil is around 450 °C. Approximately 20 g of the material was placed in a metal vessel and heated in a muffled Jung model 0212 brand, at a heating rate of 20 °C min-1, from room temperature to the final pyrolysis temperature, which was maintained for 3 h (Figure 1).
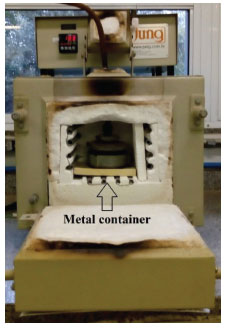 Figure 1. Experimental assembly for charcoal production
Thermogravimetric Analysis (TGA) The thermal stability of corn cob and charcoal samples was determined by thermogravimetry (TG) and derived thermogravimetry (DTG) using a Perkin Elmer model Pyris TGA1. For these analyses, approximately 21 mg of the sample was used in a platinum pan under a high purity nitrogen atmosphere with a flow rate of 20 mL min-1. The heating rate was 20 °C min-1, from the temperature of 50 to 700 °C. Fourier Transform Infrared Spectroscopy (FTIR) Absorbance spectra were performed using a Thermo Scientific NicoletTM model IR200 spectrometer, in the region from 4000 to 400 cm-1, with a spectral resolution of 4 cm-1 and 32 scans. The pellets were made by blending each dried sample in an oven at 105 °C with KBr in a 3:1 (w/w) ratio.
RESULTS AND DISCUSSION Figure 2 shows the physical aspects of the corn cob samples and the respective charcoals. The samples were chopped and dried to make possible the charcoal production in laboratory scale.
 Figure 2. Investigated sample: (A) corn cob; (B) chopped corn cob; (C) charcoal corn cob samples C300
Biomass consists mainly of cellulose, hemicellulose, the main chain of which consists of xylans or glucomannans, and lignin, a complex phenolic polymer. In addition to the main constituents, other non-structural (extractive) materials are present in smaller amounts. Pyrolysis causes the thermal degradation of these compounds and, as a result, the biomass properties change significantly. According to Demirbas & Gonenç,14 thermal degradation occurs in the order: hemicellulose> cellulose> lignin. Figure 3 presents the TG curves in (wt %) for the materials.
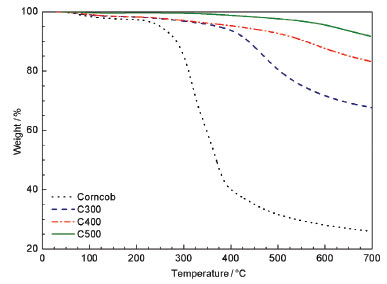 Figure 3. TG curves for corn cob and charcoals produced in nitrogen atmos-phere and heating rate of 20 °C min-1
Comparing the curves, it was verified that the thermal stability of the studied charcoals increased with the temperature of the pyrolysis used in the production. The same pattern was observed by researchers when studying biochar obtained from the pyrolysis of pine pellets under nitrogen atmosphere.15 The hemicellulose decomposes in the range from 220 to 315 °C.16 Thus the hemicellulose possibly degraded completely in the three types of studied charcoal, because the lowest temperature used in the pyrolysis was 300 °C. Consequently, the hemicellulose degradation increased the thermal strength and stability of the charcoals.17 Therefore, differences in the stability of the types of produced charcoal may be due to the difference in their preparation and composition. Lignin, a fundamentally important component for energy materials, remains degrading by heat even when cellulose and hemicellulose have been completely degraded. It is possible to verify the peak 460 °C corresponds especially to the lignin consumption,18 representing a more stable component. In Figure 4 the DTG curves in (wt. % min-1) of the materials are shown.
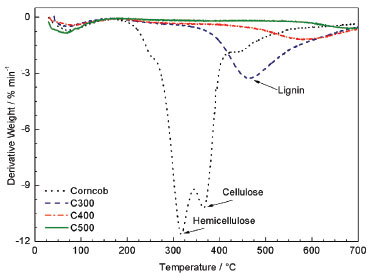 Figure 4. DTG curves for the produced corn cob and charcoals
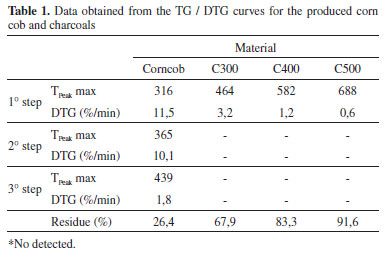
It is possible to observe the temperature ranges where the main mass losses and the maximum degradation rates occurred. The initial decomposition phase, around 100 °C, was due to water evaporation that was not removed during drying.19 Corn cob was the first that begun to decompose when compared to the three types of charcoal. The corncob had an initial mass loss in 316 °C which may be due to the hemicellulose degradation. Another step was observed with the maximum mass loss rate (10.1 % min-1) at 365 °C, attributed to the degradation of cellulose and part of the lignin. Finally, a slight mass loss occurred with a maximum rate of 1.8 % min-1 at 439 °C. The latter phase, after the double peak, indicates the gradual lignin degradation into a carbon-rich residual solid, until it reached approximately 26.4% in weight of the parent material at 700 °C. Table 1 presents the double peak distribution in the corn cob DTG curve describes the degradation of the major biomass constituents. This distribution disappears in the DTG charcoals curves due to the previous degradation of some constituents of the biomass during the pyrolysis. It was observed that the characteristic peak of lignin became more defined and was shifted to the right as the pyrolysis temperature increased, indicating changes in the biomass structure. It is assumed that the used average pyrolysis temperature (400 °C) was enough to completely degrade the hemicellulose and cellulose of the biomass, making the final product (charcoal) less reactive or thermally more resistant than the raw corn cob
In Figure 5, the absorption spectrum in the infrared region with Fourier transform (FTIR) can be observed.
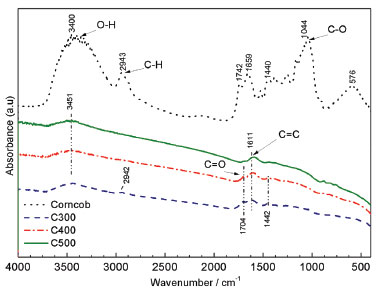 Figure 5. FTIR Spectra of the corncob with and without treatments
Fourier Transform Infrared Spectroscopy was used to investigate changes that occur in the chemical structure of corn cob after pyrolysis. Thus, charcoal is not a pure carbon, and can be summarized as C7H4O.20 These changes happen commonly due to the degradation of hemicellulose and cellulose in biomass. For corn cob, the main functional groups and respective regions of absorption were identified: axial deformation of the O-H group (3459 cm-1) associated with the functional groups of phenols, alcohols and carboxylic acids; aliphatic C-H axial deformation (2943 cm-1); stretching of C=O (1743 cm-1); C=C stretching of aromatic groups among other groups (1659 cm-1); C-O stretch of polysaccharides (1044 cm-1, whose intensity is related to the amount of cellulose).21-23 In the analyzes of the three types of charcoal, it is noted that the decrease of the O-H peak occurs due to the dehydration of the biomass during the pyrolysis. In addition, it was observed that the 2943 cm-1 peak in the corn cob spectrum disappeared in the charcoal spectra, possibly due to the loss of volatiles of the biomass during pyrolysis. On the other hand, the charcoal samples spectra compared to the corn cob spectrum showed a remarkable variation in the region between 400-1500 cm-1. The decrease of the peaks in this region confirms the degradation of the hemicellulose and cellulose from the original biomass after the pyrolysis. The peak around 1611 cm-1 in the charcoals, corresponds to the vibration of the aromatic ring of the lignin indicating the presence of this compound even using a temperature of 500 °C in pyrolysis.24
CONCLUSIONS In general, it is concluded that corn cob presented significant changes in its chemical structure when treated using pyrolysis, these changes are emphasized in FTIR results. TGA showed that the best treatments were 400 °C and 500 °C. However, the temperature of 400 °C was the best condition (less energy consumption) to produce a charcoal with approximately 83.3% of fixed carbon.
ACKNOWLEDGEMENTS The authors are grateful to Capes and the research group Biomass and Bioenergy of UFSCar - Sorocaba campus, for the support provided to the development of this paper.
REFERENCES 1. Goldemberg, J.; Lucon, O.; Estudos Avançados 2007, 21, 7. 2. Aquino, C. B.; Silva, J. M. R.; Oliveira, M. H. R.; Coriolano, A. C. F.; Delgado, R. C. O. B.; Fernandes Jr., V. J.; Araújo, A. S.; J. Therm. Anal Calorim. 2018, 136, 2139. 3. Coriolano, A. C. F.; Barbosa, G. F. S.; Alberto, C. K. D.; Delgado, R. C. O. B.; Castro, K. K. V.; Araujo, A. S.; Petrol. Sci. Technol. 2016, 34, 627. 4. Tomalsquim, M. T.; Energia renovável: hidráulica, biomassa, eólica, solar e oceânica, EPE: Rio de Janeiro, 2016. 5. Cassol, H. L. G.; de Melo, L. C.; Mendes, F. da S.; Fonseca, R.; Sanquetta, C. R.; Floresta 2016, 46, 135. 6. Thakkar, J.; Kumar, A.; Ghatora, S.; Canter, C.; Renewable Energy 2016, 94, 558. 7. Padilla, E. R. D.; Belini, G. B.; Nakashima, G. T.; Waldman, W. R.; Yamaji, F. M.; Rev. Virtual Quim. 2018, 10, 2. 8. Lin, J. C. M.; Fuel Process. Technol. 2006, 87, 487. 9. Martins, M. P.; Benício, E. L.; Dias Jr., A. F.; Almeida, R. B.; Carvalho, A. M.; Yamaji, F. M.; Rev. Arvore 2016, 40, 173. 10. Biswas, B.; Pandey, N.; Bisht, Y.; Singh, R.; Kumara, J.; Bhaskara, T.; Bioresour. Technol. 2017, 237, 57. 11. Campos, A. C. M.; Dissertaçao de Mestrado, Universidade Federal de Lavras, Brasil, 2008. 12. Palacka, M.; Viciana, P.; Holubcika, M.; Jandackaa, J.; Procedia Eng. 2017, 192, 654. 13. Long, Y.; Ruan, L.; Xiaoyan, L.; Yiju, L.; Jing, S.; Wen, Y.; Chin. J. Chem. Eng. 2015, 23, 1691. 14. Demirbas, A.; Gönenç, A.; Energy Sources 2002, 24, 471. 15. Santos, L. B.; Striebeck, M. V.; Crespi, M. S.; Capela, J. M.; Ribeiro, C. A.; de Julio M.; J. Therm. Anal. Calorim. 2016, 126, 1879. 16. Yang, H.; Yan, R.; Chen, H.; Lee, D. H.; Zheng, C.; Fuel 2007, 86, 1781. 17. Demirbas, A.; Energy Sources 2007, 29, 329. 18. Pereira, B. L. C.; Carneiro, A. C. O.; Carvalho, A. M. M. L.; Trugilho, P. F.; Melo, I. C. N. A.; Rev. Arvore 2013, 37, 567. 19. Guimaraes, J. L.; Frollini, E. D. A.; Silva, C. G.; Wypych, F.; Satyanarayana, K. G.; Ind. Crops Prod. 2009, 30, 407. 20. Montgomery, S. L.; Kumar, A.; A history of Science in world cultures: voices of knowledge, 1st ed., Routledge: New York, 2016. 21. Ibrahim, R. H.; Darvell, L. I.; Jones. J, M.; Williams, A.; J. Anal. Appl. Pyrolysis 2013, 103, 21. 22. Park, S. W.; Jang, C. H.; Baek, K. R.; Yang, J. K.; Energy 2012, 45, 676. 23. Sevilla, M.; Macia-Agullo, J. A.; Fuertes, A. B.; Biomass Bioenergy 2011, 35, 3152. 24. Derkacheva, O.; Sukhov, D.; Macromol. Symp. 2008, 265, 61. |
On-line version ISSN 1678-7064 Printed version ISSN 0100-4042
Qu�mica Nova
Publica��es da Sociedade Brasileira de Qu�mica
Caixa Postal: 26037
05513-970 S�o Paulo - SP
Tel/Fax: +55.11.3032.2299/+55.11.3814.3602
Free access


