Artigo
| Improvement of an analytical method based on HPLC with refractive index detection for the analysis of glycerol oxidation products |
|
Cristian J. GiertyasI; Débora S. da SilvaI; Camila L. F. da SilvaII; Mario R. MeneghettiI; Simoni M. Plentz MeneghettiI; Rusiene M. de AlmeidaI; Janaína H. BortoluzziI,*
I. Instituto de Química e Biotecnologia, Universidade Federal de Alagoas, 57072-970 Maceió– AL, Brasil Recebido em 08/03/2019 *e-mail: janaina.bortoluzzi@iqb.ufal.br The optimized analytical methodology described herein is based on an ion exchange column and an H3PO4 solution (pH 2.24) as the mobile phase, with a flow rate of 0.4 mL min-1 and refractive index detection (RID). On applying the methodology, it was possible to identify 7 products obtained from the oxidation of glycerol with an analysis time of 27 min. The developed method was validated through the evaluation of a series of analytical parameters. The results obtained were evaluated considering the peak area and peak height. The analytical curves showed a correlation coefficient of ≥ 0.986. The coefficient of variation values obtained were ≤ 3.60% for instrumental precision, ≤ 19.36% for intermediate precision in LOQ (1.25 μg mL-1) and ≤ 17.93% for repeatability in LOQ (1.25 μg mL-1) and different days. The limit of quantification established for all compounds was 1.25 μg mL-1 obtained through the parameters of the analytical curve. The accuracy of the method showed recovery values of 85.6 to 112.3% for real fortified sample at 3 concentration levels. Two different samples of glycerol oxidation products were applied to the validated methodology; one obtained from AuNP/SiO2 as catalyst (conversion of 62.42%), and other using AuNP/MWCNT (conversion of 89.5%). INTRODUCTION Glycerol, or propane-1,2,3-triol, is usually found in nature in the form of triacylglycerides, that are the main component of vegetable and animal oils and fats.1 The term glycerin is normally used to commercial products with glycerol contents higher than 95%.2 Usually, glycerol is obtained from soap or biodiesel industry as co‑product,3 but with the expansion of the biodiesel industry worldwide4 with consequent increase of the glycerol supply in the market, that problems of disposal of the exceeding of glycerol and opportunities to find new applications for it arise.5,6 Glycerol is already extensively employed in the personal care, cosmetics, pharmaceutical, and food industries, but extend the uses of glycerol in these areas will not solve the exceeding problem.3 However, additional fields of application and new options to transform glycerol as a useful supply to the production of high value chemicals are now envisage.7,8 Particularly, the products of glycerol oxidation are very attractive, since many of them are essential intermediate to obtain fine chemicals. However, glycerol oxidation follow a complex pathway of reactions that can lead to a large number of products, and even for very selective glycerol oxidation reactions several compounds can be identified in the final product.9 Thus, due the diversity of compounds which can be attained during glycerol oxidation, it is necessary to develop analytical methodologies that can be routinely used, exhibiting precision and accuracy of results required by regulatory standards. In this case, chromatography is the technique that must be applied by excellence.10 A wide identification and quantification of the products is not just important for the characterization of the system, but can help researchers in the elucidation of the reaction mechanism involved in the catalytic transformation, in the proposition of active sites, etc. However, despite the importance of the chromatography in this field, only few works have been carried out exploring the whole potential of the chromatography in the field of glycerol oxidation. HPLC technique has been used to identify the products of glycerol oxidation reaction since 1993.11 Later studies improved the method, but the focus was on the oxidation of glycerol rather than the use of different types of catalysts and reaction media, and relevant aspects regarding the validation of the methodologies were not addressed.12-20 Among the methods reported so far, only Beltrán-Pietro and co‑workers21 validated the chromatographic method, using an aminex HPX-87C ion exchange column at a temperature of 70 °C, an RID detector (refractive index) coupled to the UV (ultraviolet) detector and a mobile phase composed of 3 mmol L-1 sulfuric acid (H2SO4, pH 2.00), with a flow rate of 0.5 mL min-1, an analysis time of 30 minutes. In this case, it was possible to identify six compounds (mesoxalic acid, tartronic acid, glyceraldehyde, glyceric acid, glycolic acid, and dihydroxyacetone) in the working range of 1000‑10000 µg mL-1. However, the coelution of glyceraldehyde, glyceric acid and glycerol (starting compound) occurred. It can also be observed that in the concentrations of the mobile phase studied (i.e., from 1 mmol L-1 to 10 mmol L-1 H2SO4) the coelution of at least two compounds occurs, which compromises both the identification and the quantification of the compounds of interest, for which the developed method was proposed. On applying the proposed methods, where an ultraviolet detector is used, it is not possible to identify glycerol, which is the precursor for obtaining the products of interest. Many of the studies reported involve the use of two detectors in series,22-25 an ion exchange column, and a mobile phase composed of H2SO4 or H3PO4. This allows the identification of several compounds, such as tartronic acid, oxalic acid, formic acid, glycolic acid, glacial acetic acid, and glyceraldehyde. Indeed, the use of two detectors in series is a good option, but it is limited by instrumental availability in research and/or industrial laboratories. Another validated method to determine organic acids derived from lignocellulosic biomass was developed by Ibáñez and Bauer,26 employing mass spectrometry. In such method, it was possible to identify 24 organic acids. Despite the large applicability accuracy of mass spectroscopy techniques to identification of organic compounds, they still not present in most of research and industrial laboratories, mainly due to costs and maintenance. In this context, in order to give more analytical options, we developed an alternative method to identify the main products of glycerol oxidation, by HPLC techniques using a single detector, RID. Our method are in according to the procedures and parameters validated and stablished by INMETRO27 and EURACHEM/CITAC.28
EXPERIMENTAL Chemicals and reagents The deionized water used in the experiments was obtained from a MilliQ-Plus filtration system, Millipore® (USA), with a resistivity 18 MΩ cm at 25 °C. The reagents, phosphoric acid and standards (tartronic acid, oxalic acid, glyceraldehyde, glycerol, acetic acid, glycolic acid, lactic acid and formic acid) were obtained from Sigma-Aldrich (Brazil). Standard solutions A standard stock solution of 4000 μg mL-1 was prepared in H3PO4 solution (mobile phase) by placing 0.0200 g of each analytical standard (tartronic acid, oxalic acid, formic acid, glycolic acid, glacial acetic acid, lactic acid, glyceraldehyde and glycerol) in a 5 mL volumetric flask. The standards were dissolved in a H3PO4 solution (mobile phase) to give the respective concentrations and stirred in a vortex mixer (Quimis Brazil). Instrumentation The analysis was performed on a Shimadzu liquid chromatograph, model Prominence (Japan), with an isocratic pump, RID-10A refractive index detector and manual injection system with a sampling loop of 20 μL. A Varian® MetaCarb H Plus 300x7.8mm chromatography column and Varian® MetaCarb H Plus guard column was purchased from Varian® (USA). The chromatograms obtained were treated using LabSolutions software, Shimadzu Corporation© 2010. Data processing was performed using the software OriginLab® Corporation, version 6.1 (Copyright 1999-2000). Validation The compounds tartronic acid, oxalic acid, formic acid, glycolic acid, glacial acetic acid, lactic acid, glyceraldehyde, and glycerol were identified by injecting the corresponding analytical standards into HPLC and determining retention times. The validation of the method was performed considering the area and height of the peak, since at resolutions below 1.25 it is possible to identify these compounds only by the height of the peak. The validation parameters applied in this study were based on INMETRO27 and EURACHEM/CITAC28 standards. The selectivity of the method was evaluated by comparing the free matrix of the substances of interest (containing 480 mg of NaOH, 8.2 mg of catalyst, 10 mL of deionized water, with oxygen pressurizing, 5 bar, and reaction time of 1 hours), with the matrix fortified with the standards. The selectivity was confirmed by calculating the separation factor, “α” (Equation 1) which was calculated by the ratio between the respective retention factors “k2” e “k1”, where k2 is the compound with the longest retention time.29,30  The selectivity was also evaluated by comparing two calibration curves, one being prepared on the matrix in six concentration levels. The F test was applied to the deviations of the slopes of the two calibration curves. The linearity of the analytical curves and the coefficient of correlation were obtained by linear regression analysis (least squares method). The LOQ e LOD values of the method were determined based on parameters obtained from the calibration curve for each standard. These values were obtained from equations 2 and 3 where “s” is the estimate of the standard deviation of the response obtained from the linear regression equation, and “S” is the angular coefficient of the analytical curve.   The instrumental precision of the method was evaluated through 10 injections of a sample (500 μg mL-1), with the determination of the standard deviation and coefficient of variation, and the repeatability was evaluated by the injection of 10 samples (500 μg mL-1 and LOQ 1.25 μg mL-1) prepared separately. Intermediate precision was evaluated with a standard sample at a concentration of 20 μg mL-1 prepared 10 times by a different analyst and a concentration of 1.25 μg mL-1 prepared 4 times at different days. The accuracy of the method was evaluated through the recovery test, where a sample obtained from the oxidation of glycerol containing the 7 oxidation products in different concentrations was fortified at 3 concentration levels and each level was analyzed in triplicate. The relative standard deviation (RSD) of the concentrations obtained were then determined from the triplicates. The robustness of the method was evaluated through the variation of the parameters studied in the development of the method. Application of the methodology For the evaluation of the method, real samples of oxidation of glycerol reaction were obtained through adapted methodologies,31,32 using as catalyst gold nanoparticles supported on silica (AuNP/SiO2) or on multiple-walled carbon nanotubes (AuNP/MWCNT). For that, reactions were carried out using a stainless-steel reactor in oil bath and an aqueous solution containig NaOH (0.8 mol L-1) and glycerol (0.4 mol L-1). For AuNP/SiO2 a molar ratio of NaOH:glycerol:Au = 2:1:0.001 was employed and the solution was added into the reactor, witch was pressurised with oxygen (5 bar), and reaction mixture was stirred during 3 h at 130 °C. In the case of AuNP/MWCNT the molar ratio was NaOH:glycerol:Au = 2:1:0.0009, 5 bar of oxygen, at 80 °C and 1h. The reactor was cooled to room temperature and the reaction mixture was analysed by HPLC.
RESULTS AND DISCUSSION The parameters optimization of the chromatographic method (flow rate, column temperature, detector temperature and mobile phase pH) was performed univariably. The parameters were evaluated in the range of 2.14 to 2.50 for the pH of the mobile phase, 0.3 to 0.4 mL min-1 of flow, 30 to 40 °C for column temperature and finally 35 to 45 °C for detector temperature. The optimized HPLC conditions were: mobile phase at pH 2.24, flow rate 0.40 mL min-1 , column temperature 40 °C and detector temperature 35 °C. The method presented selectivity, verifying that the matrix without the analytes does not interfere in the analysis (Figure 1), according to the requirements required by the regulatory bodies.27-28 It is important to highlight that a chromatographic resolution of ≥1.25 was attained, indicating the required separation between the analytes.10
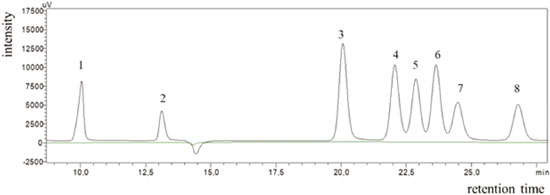 Figure 1. Chromatogram obtained from the analysis of the analytical standards of 800 μg mL-1 under the ideal conditions established and for matrix without the analytes: 1-oxalic acid (10.04), 2-tartronic acid (13.12), 3-glyceraldehyde (20.06), 4-glycolic acid (22.06), 5-lactic acid (22.87), 6-glycerol (23.64), 7-formic acid (24.47), 8-acetic acid (26.79)
Table 1 shows the selectivity values obtained from the retention factor calculations for the compounds analysed. Selectivity values above 1 indicate good separation between compounds.
In addition, according to the retention times observed for each analyte (Figure 1), it is possible to affirm that the proposed methodology can be used to identify and quantify 7 possible products of the glycerol oxidation reaction with an analysis time of 27 min. These compounds were applied in the method development because they are the major compounds found in the glycerol oxidation reactions, according to the selectivity of the catalytic systems employed in this work. The determination of the selectivity through the construction of the calibration curves showed that there is no significant difference between the curves (with and without matrix) as shown in Table 1S in the supplementary material. The tabulated F obtained from the degree of freedom of the curves was 5.05. In the evaluation of the curves by the area as well as by the height of the peak, values of F were obtained in the range of 1.04 to 4.88, which proves that the method developed is selective. The linearity values for the 8 compounds identified in the proposed method presented coefficient of correlation (r) in the range of 0.986 – 1.000 according to Table 1, indicating that the adopted working range is linear (1.25 to 1000 μg mL-1). Table 2 shows the values obtained for the LOD and LOQ from the parameters of the curve, considering the area and height of the chromatographic peaks. When peak height was used as response, values ≥ 0.06 μg mL-1 were found for LOQ and ≥0.02 μg mL-1for LOD and for the peak area the values found were ≥0.07 μg mL-1 for LOQ and ≥ 0.02 μg mL-1 for LOD.
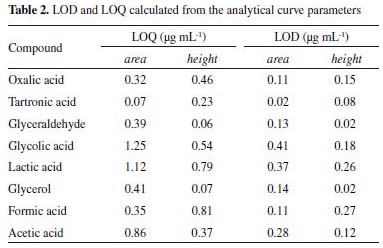
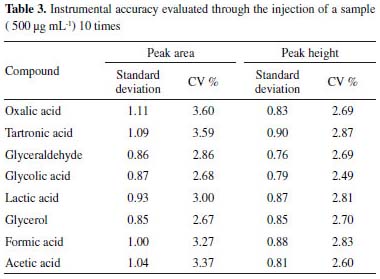
Table 3 shows the standard deviation and coefficients of variation (CV) obtained for the instrumental accuracy, which indicate that the proposed methodology is accurate, since they are ≤ 1.11 and ≤ 3.60, respectively.
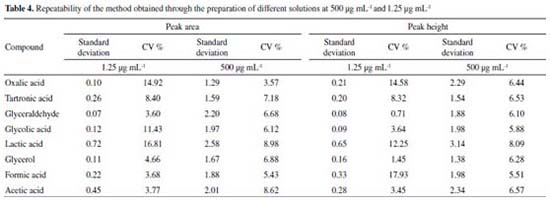
The CV values obtained in the repeatability assay (500 μg mL-1), considering both peak area and height, were ≤ 8.98% as shown in Table 4. These results show that the proposed methodology is accurate, since the values for the standard deviation and CV obtained were ≤ 2.64 and ≤ 3.54, respectively, indicating a homogeneous set of data for these parameters. In the repeatability tests carried out in the concentration range of the quantification limit (1.25 μg mL-1) values of CV ≤ 17.93% were obtained, being in agreement with the data of Horwitz Trump for this level of concentration.33
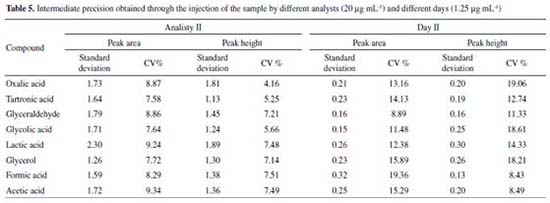
In the determination of the intermediate precision for different analysts and different days, the deviations calculated were ≤ 2.30 and ≤ 0.32 and the CV values considering both peak area and height were ≤ 9.34% and ≤ 19.36%, respectively as shown in Table 5.
The accuracy was verified through the F test, where the F-tabulated for different analyst and different days (n-1) in this dataset is 3.18 and 9.28, respectively. Table 6 shows that the variances obtained are considered equal and are consistent with the confidence intervals established for the different analyst and different days, since the values obtained for F-calculated were lower than the F-tabulated values (≤ 2.96 and ≤ 7.92, respectively.
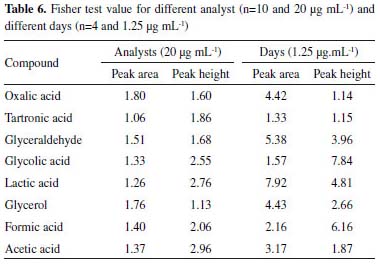
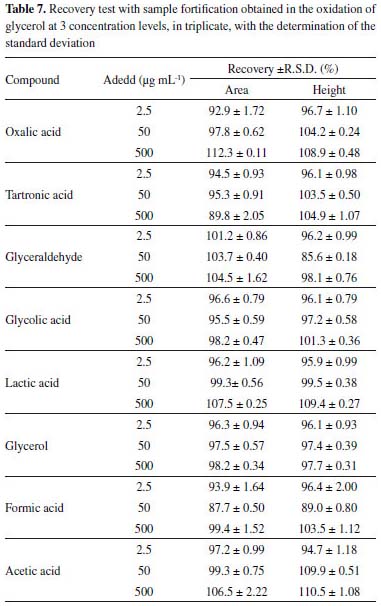
Table 7 shows the values obtained for the accuracy of the method based on recovery experiments, considering the peak area and height for a sample containing oxalic acid (19.81 µg mL-1), tartronic acid (71.93 µg mL-1), glyceraldehyde (286.88 µg mL-1), glycolic acid (87.51 µg mL-1), lactic acid (354.67 µg mL-1), glycerol (294.67 µg mL-1) and formic acid (54.46 µg mL-1) spiked with three concentrations of the standard. Recovery values were obtained in the range of 85.6 ± 0.18 to 112.3 ± 0.11%, according to Table 7.
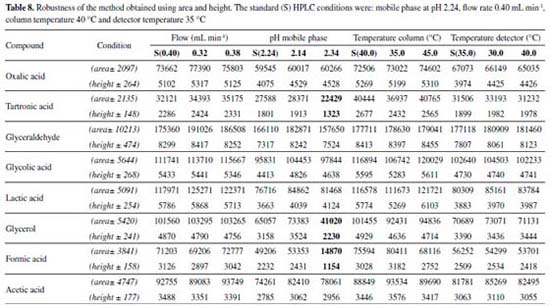
For the robustness of the method, the parameters were evaluated in univariate form (Table 8 and 2S). These parameters were studied by evaluating the variation in the peak areas and heights (Table 8), in addition to a resolution considered satisfactory (≥ 1,25) for the quantification of the compounds of interest (Supplementary Material Table 2S).
According to the data of area and height reported in Table 8 only occurred variation in relation to the pH of the mobile phase. Larger changes were observed when the studied pH was 2.34, that is, when we increase the pH. Higher variations were observed both in the areas and in the heights of the compounds tartronic acid, glycerol and formic acid. According to the data reported in Table 2S, the variation in the temperature column (± 5 °C), led to changes in the resolution of the glycerol and formic acid compounds. In relation to the pH of the mobile phase, changes were observed when the studied pH was 2.34, compromising the resolution of the glycerol and formic acid compound. The flow modifications studied altered only the analysis time. The proposed method is thus robust in terms of variations in the flow and detector temperature, with a mobile phase at pH 2.14. After validation of the method, oxidation reactions of glycerol were carried out using two catalysts (AuNP/SiO2 and AuNP/MWCNT), according to conditions presented at experimental section, and samples were analyzed in order to evaluate the proposed methodology (Figure 2).
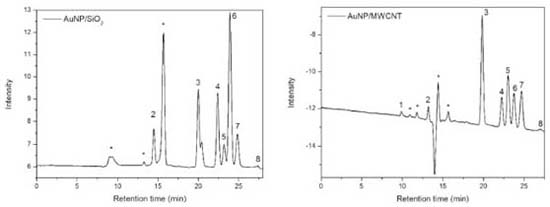 Figure 2. Chromatogram obtained from the analysis of samples of the oxidation reactions of glycerol by applying the AuNP/SiO2 and AuNP/MWCNT catalysts. 1- oxalic acid, 2- tartronic acid, 3- glyceraldehyde, 4- glycolic acid, 5- lactic acid, 6- glycerol, 7- formic acid, 8- acetic acid and *unknown compounds
The reaction in the presence of AuNP/SiO2 showed a conversion of 62.42% of the glycerol, forming 5 products: tartronic acid, 17.8%, glyceraldehyde, 18.3%, glycolic acid, 18.0%, lactic acid, 3.5% and formic acid, 14.8%. The reaction performed with AuNP/MWCNT showed a conversion of glycerol of 89.5%, forming 6 products: oxalic acid, 2.2%, tartronic acid, 15.6%, glyceraldehyde, 33.5%, glycolic acid, 12.7%, lactic acid, 8.6% and formic acid, 15.7%. It was also found unknown compounds (Figure 2), that is, compounds formed in the oxidation reaction of glycerol and that were not used in the validation of the methodology, which proves that this method is selective. In addition, acetic acid was only identified in the samples and not quantified, this due to the low concentration that is below the quantification limit of the analytical curve. Both the presence of unknown compounds and that of acetic acid were observed in the two samples, that is, for the oxidation reactions using the two catalysts. It is important to mention that the formation of these glycerol oxidation products is in accordance with the routes proposed in the literature for these types of catalytic system.21,34 Concerning the characterization results, the optimized and validated methodology is efficient and can be applied to follow the evolution of oxidation reactions.
CONCLUSIONS The proposed method, based on the use of a single detector (RID), provided reliable results for the determination of the glycerol oxidation reaction products tested, and it is possible to simultaneously identify and quantify seven products of the glycerol oxidation reaction. The proposed methodology was found to be sensitive and precise for the range of concentrations applied (1.25 to 1000 μg mL-1). Additionally, it was possible to analyze efficiently the real samples containing the glycerol oxidation products. Another great advantage of the present method is the possibility to quantify the products using peak area and peak height. So, when the natural aging of the column takes place and, consequently, causes a decrease of the chromatographic efficiency leading to resolutions smaller than 1.25, it is still possible to identify and quantify with precision these compounds using just the height of the chromatographic peak.
SUPPLEMENTARY MATERIAL Tables 1S and 2S are freely available at http://quimicanova.sbq.org.br in PDF format.
ACKNOWLEDGEMENTS Financial support from the Brazilian research funding agencies Research and Projects Financing (FINEP), National Council of Technological and Scientific Development (CNPq), Brazilian Federal Agency for the Support and Evaluation of Graduate Education (CAPES), Alagoas Research Support Foundation (FAPEAL), and INCT-Catálise are gratefully acknowledged. MRM and SMPM thank CNPq for research fellowships. CJG thanks CAPES for a fellowship.
REFERENCES 1. Behr, A.; Eilting, J.; Irawadi, K.; Leschinski, J.; Lindner, F.; Green Chem. 2008, 10, 13. 2. Suppes, G. J. The Biodiesel Handbook; Elsevier: Amsterdam, 2010; pp. 439. 3. Quispe, C. A. G.; Coronado, C. J. R.; Carvalho Jr., J. A.; Renewable Sustainable Energy Rev. 2013, 27, 475. 4. Ayoub, M.; Abdullah, A. Z.; Renewable Sustainable Energy Rev. 2012, 16, 2671. 5. Sun, D.; Yamada, Y.; Sato, S.; Ueda, W.; Green Chem. 2017, 19, 3186. 6. Len, C.; Delbecq, F.; Cara Corpas, C.; Ruiz Ramos, E.; Synthesis 2018, 50, 723. 7. Mota, C. J. A.; Silva, C. X. A. da; Gonçalves, V. L. C.; Quim. Nova 2009, 32, 639. 8. Zhou, C. H.; Zhao, H.; Tong, D. S.; Wu, L. M.; Yu, W. H.; Catal. Rev. 2013, 55, 369. 9. Villa, A.; Dimitratos, N.; Chan-Thaw, C. E.; Hammond, C.; Prati, L.; Hutchings, G. J.; Acc. Chem. Res. 2015, 48, 1403. 10. Snyder, L. R.; Kirkland, J. J.; Glajch, J. L.; Practical HPLC Method Development: Snyder/Practical; John Wiley & Sons, Inc.: Hoboken, 1997. 11. Kimura, H.; Tsuto, K.; Wakisaka, T.; Kazumi, Y.; Inaya, Y.; Appl. Catal., A 1993, 96, 217. 12. Demirel, S.; Lehnert, K.; Lucas, M.; Claus, P.; Appl. Catal., B 2007, 70, 637. 13. Sánchez, B. S.; Gross, M. S.; Querini, C. A.; Catal. Today 2017, 296, 35. 14. Garcia, R.; Besson, M.; Gallezot, P.; Appl. Catal., A 1995, 127, 165. 15. Fordham, P.; Besson, M.; Gallezot, P.; Appl. Catal., A 1995, 133, L179. 16. Carrettin, S.; McMorn, P.; Johnston, P.; Griffin, K.; Kiely, C. J.; Attard, G. A.; Hutchings, G. J.; Top. Catal. 2004, 27, 131. 17. Biella, S.; Castiglioni, G. .; Fumagalli, C.; Prati, L.; Rossi, M.; Catal. Today 2002, 72, 43. 18. Demirel-Gülen, S.; Lucas, M.; Claus, P.; Catal. Today 2005, 102, 166. 19. Demirel, S.; Lehnert, K.; Lucas, M.; Claus, P.; Appl. Catal., B 2007, 70, 637. 20. Ketchie, W.; Fang, Y.; Wong, M.; Murayama, M.; Davis, R.; J. Catal. 2007, 250, 94. 21. Beltrán-Prieto, J. C.; Pecha, J.; Kašpárková, V.; Kolomazník, K.; J. Liq. Chromatogr. Relat. Technol. 2013, 36, 2758. 22. Musialska, K.; Finocchio, E.; Sobczak, I.; Busca, G.; Wojcieszak, R.; Gaigneaux, E.; Ziolek, M.; Appl. Catal., A 2010, 384, 70. 23. Dou, J.; Zhang, B.; Liu, H.; Hong, J.; Yin, S.; Huang, Y.; Xu, R.; Appl. Catal., B 2016, 180, 78. 24. Rodrigues, E. G.; Pereira, M. F. R.; Chen, X.; Delgado, J. J.; Órfão, J. J. M.; J. Catal. 2011, 281, 119. 25. Olmos, C. M.; Chinchilla, L. E.; Rodrigues, E. G.; Delgado, J. J.; Hungría, A. B.; Blanco, G.; Pereira, M. F. R.; Órfão, J. J. M.; Calvino, J. J.; Chen, X.; Appl. Catal., B 2016, 197, 222. 26. Ibáñez, A. B.; Bauer, S.; Biotechnol. Biofuels 2014, 7. 27. Instituto Nacional de Metrologia, Normalização e Qualidade Industrial (INMETRO); DOQ-CGCRE-008, Orientações sobre Validação de Métodos Analíticos, 2011. Available at http://www.inmetro.gov.br/Sidoq/Arquivos/Cgcre/DOQ/DOQCgcre-8_04.pdf, accessed in July 2019. 28. Ellison, S. L. R.; Rosslein, M.; Williams, A.; Quantifying uncertainty in analytical measurement, 2. ed., EURACHEM, Co-operation on International Traceability in Analytical Chemistry, Eurachem/CITAC guide, Eurachem: London, 2000. 29. Collins, C. H.; Fundamentos de cromatografia.; Editora da Unicamp: Campinas, 2006. 30. Glajch, J. L.; Kirkland, J. J.; Anal. Chem. 1983, 55, 319. 31. Bianchi, C. L.; Canton, P.; Dimitratos, N.; Porta, F.; Prati, L.; Catal. Today 2005, 102–103, 203. 32. Dimitratos, N.; Porta, F.; Prati, L.; Appl. Catal., A 2005, 291, 210. 33. Harris, D. C.; Bordinhão, J.; Análise química quantitativa, LTC: Rio de Janeiro, 2008. 34. Farnetti, E.; Crotti, C.; Catal. Commun. 2016, 84, 1. |
On-line version ISSN 1678-7064 Printed version ISSN 0100-4042
Qu�mica Nova
Publica��es da Sociedade Brasileira de Qu�mica
Caixa Postal: 26037
05513-970 S�o Paulo - SP
Tel/Fax: +55.11.3032.2299/+55.11.3814.3602
Free access


