Artigo
| Correlating single-molecule sers statistics to plasmonic nanocluster structure and near-field properties |
|
Dayane V. N. dos Santos; Diego P. dos Santos*
Departamento de Físico-Química, Instituto de Química, Universidade Estadual de Campinas, Campinas - SP, Brasil Recebido em 28/04/2019 *e-mail: santosdp@unicamp.br Near-field properties due to surface plasmon excitation is a key element for different applications of metal nanoparticles, such as surface-enhanced Raman scattering (SERS). Therefore, a characterization of such properties is fundamental for the correct interpretation of experimental results, such as the strong fluctuation of intensities observed at low analyte concentrations, especially at single-molecule detection level. In this paper, we investigate, by classical electrodynamics simulations, the link between the near-field properties of metal nanoclusters and the intensity distribution that is expected in a given single-molecule SERS experiment. The results presented here points to the possibility of correlating the intensity histograms shapes to properties such as degree of field amplification localization and aggregation state of metal nanoparticles. INTRODUCTION Metal nanoparticles have presented an increased interest over the years due to their vast range of applicability, such as fast optical communication,1,2 enhanced spectroscopies,3,4 photovoltaics,5–7 optical sensors8–10 and photocatalysis.11–16 All such properties are derived from the excitation of coherent surface localized electromagnetic modes, called surface plasmon.4,17–21 The excitation of such modes leads to strong electric field amplifications on the surface of the metal nanoparticles, which represent an important element for the aforementioned applications. Such field distribution is particularly important for enhanced spectroscopies as the surface-enhanced Raman scattering (SERS), where the adsorbed molecule probes a local electric field that is much greater than the incident light field. This so-called electromagnetic mechanism of SERS enhancement4,22–24 (as opposed to the chemical mechanism where the enhancement is due to modifications of the molecule Raman polarizability tensor upon adsorption)25–27 is, in the majority of cases, responsible for most of the observed signal amplifications, especially in systems where two or more nanoparticles are separated by a small gap distance (in the order of 1 nm). In this situation, the coupling of plasmonic modes creates very large field amplifications in the vicinity of the nanoparticles. This region may produce SERS enhancements (ratio of the SERS and Raman intensities for a single-molecule) as large as 1010 and is known as SERS hot spot (HS).28–34 The magnitude of enhancements in the HSs makes possible the observation of SERS spectra that can be correlated to single-molecule events.35–38 Despite the obvious analytical chemistry implications of such small detection limit, the SERS spectra at such conditions may open possibilities to characterize HS properties regarding field amplifications and resonance conditions, which in turn are related to the HS structure. In the last few years we have given attention to the SERS spectra at single-molecule SERS (sm-SERS) conditions as a tool to extract physical information related to the HSs.37,39 For instance, the ratio of anti-Stokes to Stokes intensities from a molecule, related to the local temperature in Raman measurements, in SERS spectra it also accounts for the HS resonance profile for the near-field enhancement: if the plasmon resonance is redshifted with respect to the incident laser wavelength, a larger enhancement must be expected for the Stokes if compared to anti-Stokes signals; on the other hand, if the plasmon resonance wavelength is smaller than that of the incident laser, an anti-Stokes preferential enhancement must be expected.40,41 This information can be used to map the resonances from each HS probed by a single-molecule. Another interesting application regarding such detection regime experiments is the possibility to map complex electromagnetic interactions among nanoparticles in a given cluster. For instance, the coupling between two silver nanocubes may present an asymmetrical lineshape due to out-of-phase interaction of plasmon modes.42,43 Such plasmon resonance, also known as Fano resonance, leads to observable SERS spectral signatures regarding relative intensities.44,45 Also, since the plasmon resonance wavelength is dependent on the cluster structure, it is possible to extract qualitative information about the nanoparticle aggregation state from sm-SERS experiments.46 The above discussion is an indication that experiments in sm-SERS condition may open the possibility to extract information about the plasmonic HSs (a key element in plasmonic applications) local properties, otherwise only accessible by electron energy loss spectroscopy (EELS).47,48 However, in sm-SERS an observable signal is only generated when the molecule reaches a HS. Since such regions are very localized in space, a large degree of signal fluctuation must be expected and statistical analysis must be performed prior any inference on the HSs properties. In this manuscript we analyze the effect of nanoparticle shape and cluster size on the single-molecule intensity distribution statistics. The purpose of this manuscript is to open the possibility to correlate the experimental information, usually presented in the form of intensity histograms, to the local field properties of HSs.
COMPUTATIONAL There are multiple numerical methods to describe the interaction between the electromagnetic radiation and matter. In this manuscript, we used an approach based in classical electrodynamics, specifically, two methods were used: Generalized Mie theory (GMT)49,50 and Boundary Element Method (BEM).51,52 In the following, a brief description of the two methodologies is presented. Both methods seek for a solution of the behavior of the electric field in all space that comprises the nanoparticle and the embedding dielectric medium. With this solution, properties such as efficiency of light scattering as function of incident wavelength (scattering spectrum) and the local field amplifications (related to SERS enhancements) can be computed. In these methods the material response in respect to the light electric field perturbation is described by the material dielectric function. In all simulations it was used the tabulated data for the gold dielectric function from Johnson and Christy compilation.53 To describe the water environment surrounding the nanoparticles it was considered a wavelength-independent dielectric constant of 1.777. Generalized Mie Theory (GMT) Mie theory corresponds to the exact solution of Maxwell equations for a spherical object.4,54 The method describes the complicated result of the interaction of light with an object as an infinite series in terms of vector spherical harmonics (N, M), as presented in Eq. 1:  The vectors and are interpreted as the electric and magnetic fields, respectively, generated by charge density distributions located at the orgin. The label n indicates the shape of the distribution, n=1 for a dipole charge distribution, n=2 for a quadrupole, etc. The index m describes the z-axis projection of the total angular momentum, in the same sense as in the hydrogen atom quantum mechanical wavefunction solutions. Therefore, the nanosphere response to the incoming field of magnitude E0 can be decomposed as a linear combination of multipolar charge distributions inside the metal with combination coefficients anm e bnm. The index (i) controls the behavior of the radial distribution of the fields inside and outside of the nanosphere. The GMT method is a generalization of Mie theory to account for the scattered fields of multiple particles that must be accounted for in the description of the field reaching a given particle.49,50 All the simulations in this work were performed with the GMMFIELD program.55 Boundary Element Method (BEM) In the case of geometries other than the spherical shape, numerical solutions must be obtained. In this manuscript we used the BEM, in which the electric field in a given position r is calculated taking into account the fact that it can be described in terms of vector (A) and scalar (φ) potentials. In this description the magnetic field is described by the curl of A in a similar fashion as the electric field can be calculated by the gradient of φ.  In BEM the solution for the scalar and vector potentials can be obtained by a surface integration of the product of the Green's function (G) and the surface charge (σ) and current (h) densities, subjected to electromagnetic surface boundary conditions.48  The advantage of BEM over other methodogies, such as the discrete dipole approximation (DDA) or the finite-difference time domain (FDTD) methods, is that only the surfaces of the structures must be simulated, whereas all the nanoparticle (DDA) and environment (FDTD) must be taken into account in the other methods. The BEM simulations were performed with the MNPBEM17 program.56 Statistical analysis All statistical analysis and data treatment were performed with the R program and its packages.57,58 In particular probability densities functions for the SERS enhancement factors were obtained by the kernel density estimation approach. In such method, the probability densities were computed as sums of gaussian distributions (kernels) with a given bandwidth.
RESULTS AND DISCUSSION For a better presentation of the results, firstly it will be described the SERS enhancement factor distribution around a single HS model, from which it is discussed the figure of merits to be analyzed in sm-SERS data. Then, it will be shown the possible effects of nanoparticle shape and cluster size in the sm-SERS statistics. This investigation aims at pointing possible features to be observed in experimental data that may be correlated to near-field properties associated to HSs in plasmonic nanoparticle clusters. SERS enhancement factor statistics in a single HS Spherical Au nanoparticles For the description of SERS enhancement factors due to a HS, Le Ru et al., showed that a nanosphere dimer is an excelent model to capture the main picture involving sm-SERS statistics.30 In this manuscript, we used as model HS a dimer of gold nanospheres (AuNS). The choice for such composition is related to the fact that the Au chemistry permits a better control over size and shape of nanoparticles. In the first step of the construction of the dimer model, we simulated, by GMT, the AuNS radius effect on the maximum SERS enhancement factor (F). In all simulations, F was computed in terms of the E4 - approximation, i.e., the fourth power of the local enhancement of the incident light electric field (E0) amplitude:59  Figure 1A shows the dependence of log10(F) (calculated at the HS center for each dimer) as function of the incident light wavelength. All simulations were performed in water as dielectric environment surrounding the nanoparticles of radii r and with the incident light polarization along the interparticle axis. The figure is intended to present the variation in this SERS enhancement spectrum as function of nanoparticle radius (changing from 15 nm to 49 nm with a step of 2 nm, as indicated in Figure 1A). Highlighted in red in the figure is the corresponding spectrum for a dimer comprised by 20 nm radius AuNSs, whose maximum presents a wavelength close to 633 nm, a typical wavelength used in SERS measurements. In fact this dimer configuration is the one that presents the largest value of F at 633 nm among the studied configurations, as it can be observed in Figure 1B. Due to this large SERS enhancement that can be promoted by a dimer of 20 nm AuNSs, we select this nanoparticle size throughout the manuscript.
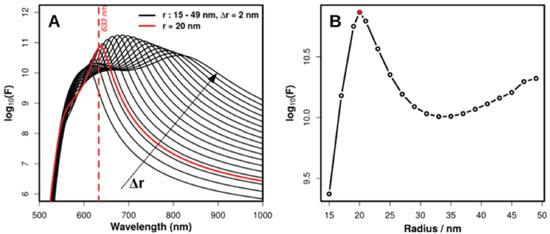 Figure 1. (A) log10(F) spectra for AuNS dimers for different nanoparticle radius. (B) Dependence of the maximum enhancement factor (measured at the HS center) as function of AuNS radius for a 633 nm wavelength light excitation
Figure 2A presents a map of log10(F) calculated at 633 nm in a plane that passes through both AuNS centers. The map shows that the enhancement factors are very concentrated in the vicinity between the AuNSs. The enhancement at the HS center (θ = 0 rad as indicated in the figure) is very large and rapidly decreases along the surface (increasing θ), which shows the very localized nature of a SERS HS (F decreases by 4 orders of magnitude for an angle variation of only 15 degrees).
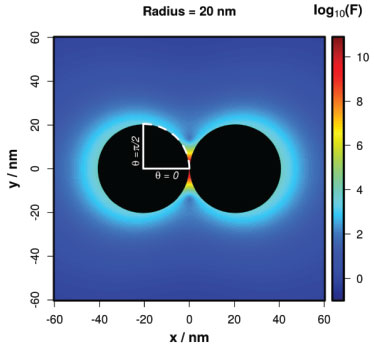 Figure 2. 2D map of the local field enhancement factor F presented in logarithmic scale
The above picture imposes a strong limitation to the observation of sm-SERS events: only molecules that can access these very localized regions may generate a measurable signal.30,60 This means that if the analyte surface coverage is very small, the probability of a molecule occupingy the HS is also small, which translates into a low probability of observation of SERS signals. This limitation can, in part, be circumvented by increasing the analyte surface coverage, which in turn limits the probability of observing events associated to only a single-molecule. The above discussion can be described by the calculation of the probability density function (PDF) for F, p(F). This function can be related to the probability density that a molecule probes a given F. If the probed F is greater than the instrumental cut off (Fcut off), the sm-SERS signal will be detected. However, if the probed F is lower than Fcut off, the spectrum will not be measured. It is usually accepted that Fcut off of the order of 108 is enough for the experimental observation of sm-SERS spectra.28 However, the correct value of Fcut off is specific for each instrument, and it can be lower or even greater than 108. We take this value as reference for the discussions in this manuscript, which intends to be a more qualitative rather than quantitative description of the sm-SERS data that we should encounter in an experimental setup. A full quantitative analysis would require Fcut off to be measured for the Raman spectrometer used in the experiment. In the case of the dimer of Figure 2, p(F) can be evaluated by sampling the F distribution on the surface of the AuNSs. In this case, it is possible to use the symmetry properties of the dimer to construct a representation of the full 3D surface map of F. The points on the surface of a sphere can be mapped by probing all the circumferences of radius r(θ), according to Figure 3A. For small θ, the circumference is smaller, which translates into a lower number of points on the surface available for the sampling of F. This is in accordance to the above description that the probability of observing a molecule adsorbing at the HS center (θ = 0) is smaller than for θ = π/2. Therefore, we can use p(θ) to generate values of θ that reflects the full 3D surface description, from which we can measure F(θ) and construct p(F).
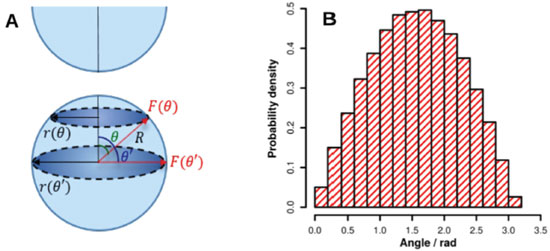 Figure 3. (A) scheme to sample the probability density distribution for the angles θ. (B) Area nomalized histogram for 106 values of θ according to Eq. 7
The relative probability densities for θ = 0 and θ = π/2 can be calculated as:  where r(θ = π/2) is the AuNS radius, R. Therefore, p(θ) can be written as:  where A is a normalization constant that ensures . Figure 3B shows a histogram of 106 randomly generated values of θ according to Eq. 7, where it can noticed the lower probabilities to probe small θ. In Figure 3B, the histogram is presented with a normalized area, which means that the y-axis is a representation of p(θ). For each randomly generated θ, the associated F(θ) can be calculated, from which an area normalized histogram for F similar to Figure 3B can be constructed to extract p(F). Figure 4 shows the values of log10(p(F)) as function of log10(F). The adopted log-log scale is due to the large variation of F along the surface.
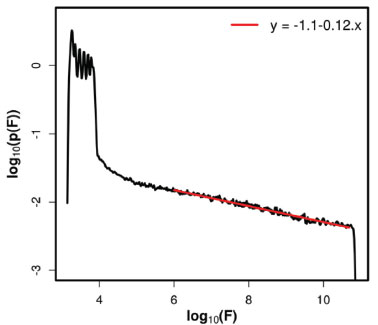 Figure 4. Dependence of the probability density function, p(F), as function of F for a dimer of 20 nm radius AuNSs. The graph is presented in log-log scale
As it can be seen in Figure 4, the probability density for a randomly adsorbed molecule to probe large enhancements (such as 1010) is very small, as expected. The dependence of log10(p(F)) as function of log10(F) for large values of F is linear, which means the probability density to probe a given F decays exponentially with F. This distribution shape, known as trucated Pareto distribution (TPD), is a charateristic property of rare events, such as the case of sm-SERS that relies on the fact that the molecule must access very small volumes to generate an observable event. The slope of the TPD (k, slope of the linear fit, red, in Figure 4) shows how fast the probability density decreases with F, i.e., it is related to the HS localization.61 Since the experimental measured intensity (I) is proportional to F, the PDF for the measured intensities is expected to follow a TPD-like distribution as in Figure 4. This means that the analysis of the intensity distribution in sm-SERS experiment may reveal the local field distribution in SERS HSs.61 The PDF in Figure 4 is characteristic of the investigated system, i.e., 20 nm AuNS dimer in water at 633 nm light incident wavelength. This field enhancement distribution may be strongly changed with variations on metal nanoparticle shape, composition and aggregation state. In this manuscript we investigate, by numerical simulations, the effects of nanoparticle shape and aggregation state on p(F), particularly in terms of HS degree of localization, which may affect the experimental observation of sm-SERS. In both cases, we provide simulations of sm-SERS intensity distributions that would be expected to be observed in a given experimental condition. The idea is to build a picture of how HS structure affects the sm-SERS intensity distributions. Nanoparticle shape: an analysis based on Au nanoparticle aspect ratios (AR) In this section we evaluate the effects of nanoparticle shape on p(F). Specifically, it is given attention to the effect of changing surface curvature in the HS region. It is well known that high curvature nanoparticles, such as nanorods, nanoprisms, nanostars, etc, present large field enhancements around those regions.4 The very large field enhancements in such systems must be followed by changes (relative to the spherical case) in p(F). A full account of the nanoparticle shape effect on p(F) should be performed for each particular nanoparticle structure. Again, our purpose in this manuscript is to provide a qualitative description of what should be expected in a given sm-SERS experiment, or in a different perspective, which HS properties can be traced back from the experimental distribution. Therefore, as a simple model of changing particle shape, we investigate an Au ellipsoidal nanoparticle (AuNE) dimer with the same volume as the AuNS in the previous section. Since the change in nanoparticle aspect ratio (AR, defined as the ratio between the longer and smaller nanoparticle axis) leads to redshifts in the plasmon resonance wavelength, the F distribution was calculated at 674 nm, the surface plasmon resonance wavelength for AuNE dimer with AR = 2. For the AuNE dimer, it was undertaken the same procedure as discussed above to map the surface field distribution, through p(θ). In the case of a spheroids as the one presented in Figure 5A, with aspect ratio AR = b/a (see Figure 5A), the probability density function for θ can be described as:
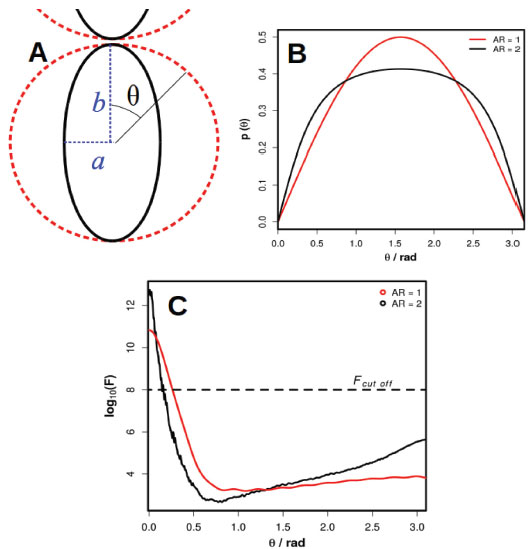 Figure 5. Comparison between AuNS (red, AR = 1) and AuNE (black, AR = 2) dimers in terms of structure (A), θ probability density distribution (B) and dependence of log10(F) as function of θ (C)
 where A is an area normalization constant. Figure 5B shows the function p(θ) for two different aspect ratios (AR). Note that AR = 1 for AuNS, the reference system. Interestingly, the increase in AR leads to an increase in the probability density of sorting a value for θ close to 0 (which corresponds to the HS center), relative to the same measurement for θ = π/2. This means that the increase in AR promotes the access of molecules to regions of low θ, a situation that could potentially be benefitial for sm-SERS detection and, consequently, analytical applications aiming at SERS detections at ultralow concentrations. From the distribution of θ in Figure 5B, the p(F) function was obtained for the AuNE dimer, from which the TPD parameter k was measured to be equal to 0.2, ie., greater than the observed for the AuNS dimer. This reveals that high curvature HSs present very strong electric field amplifications, but also those fields are very confined in a smaller volume. Figure 5C shows the angle dependence of F along the surfaces of the Au nanoparticle dimers. A steeper decrease of F as function θ can be observed for the AuNE dimer if compared to AuNS. If we take Fcut off = 108 as the instrumental cut off, it can be readily seen that a lower (relative to AuNS) surface area on the AuNE would be able to provide measurable readouts. This is an interesting aspect to be investigated: in one hand the surface curvature promotes the access of molecules close to the HS center, and on another hand the same curvature increases the degree of localization. This suggests that the resultant sm-SERS statistics is dependent upon those two aspects (HS availability and degree of localization) and it will be further discussed in the next section. Link with sm-SERS measurements In SERS experiments the measurements are performed for a given molecular concentration. Those molecules can randonmly adsorb at specific positions on the surface of the nanoparticles. The adsorption/desorption dynamics change the molecular position configurations along time and will change the total SERS intensity, which corresponds to the summation of the sm-SERS intensities for each molecule on the surface. Also, in a given experiment, there may be a distribution of HSs that can be probed by the incident laser. For instance, if the experiment is performed in solution, the colloidal diffusion will change the probed nanoparticle clusters (each one of them with a particular surface molecular distribution configuration) along time. In the case of static SERS substrates,62 where the nanoparticles are immobilized, the change of probed clusters can be made by mapping measurements.40 These effects translate into our simulations in terms of changes of molecular positions on the nanoparticles surfaces. For the sm-SERS simulations, it was considered a 10% surface coverage with a hypothetical molecule that occupies a 1 nm2 area on the surface of the nanoparticles. With this surface coverage we generated 106 configurations of randonmly adsorbed molecules. For each configuration, t, the total SERS intensity can be described as the sum of the SERS intensities for N molecules:  For the configurations that generated a signal intensity bellow the threshold (I(t) < 0 in Eq. 9), it was assigned I(t) = 0. Before we draw any conclusions about the sm-SERS intensity distributions to be observed in an experiment, we need to make sure that our simulation condition is in fact in the sm-SERS regime. This is an important condition, since in ensemble average measurements, the results should point to the average F on the surface of the nanoparticles, losing any information about the surface distribution and degree of localization. To ensure sm-SERS condition, bi-analyte63,64 simulations were performed. This experimental condition is usually atributted as a proof of sm-SERS detection. The ideia is that the experiment must be performed with two types molecules (here, called A and B, ideally isotopologue molecules) with distinguishable spectral signatures. In an average (or bulk) SERS condition, where all HSs are occupied due to the high molecular coverage, the resultant spectrum is a linear combination of the signatures from both molecules. Instead, in the sm-SERS condition, since the probability of occupying a HS is low, there sould be events where only one or the other molecule is observed in the spectrum. If pAis a measure of the percentage of signal intensity attributted to molecule A (in a way similar to molar fraction), observations with pA = 0 and pA = 1, correspond to events where only molecule B or molecule A (respectively) is observed. Any other value of pA denotes situations where the molecules are simoultaneusly detected. Figure 6A and 6C show the histograms for pA for AuNE and AuNS dimers, respectively. As it can be seen, the adopted coverage condition (10% of the nanoparticle surface area) still ensures that most of the events may be attributed to sm-SERS intensities. Interestingly, the probabilities of observation of both molecules (pA ~ 0.5) is smaller for the AuNE dimer, which may be due to the high degree of localization. It is worth pointing out that a similar distribution profile as in Figure 6C would be obtained for AuNE dimers if the surface coverage is increased. This is a counter-intuitive interpretation,37,60,61 since the HS strength is much larger for the system with a greater surface curvature. The result is a direct consequence of a great contribution from the high degree of HS confinement observed for the ellipsoid.
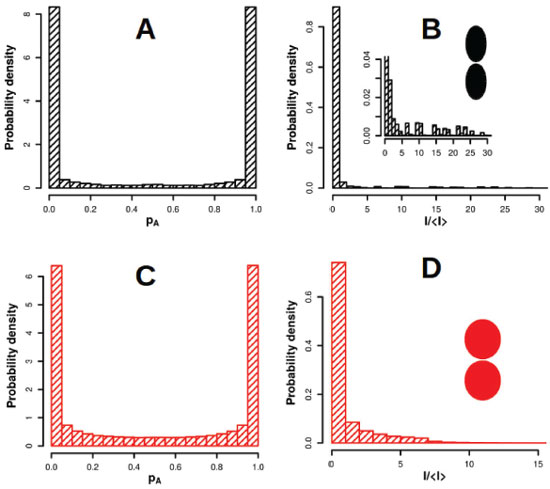 Figure 6. sm-SERS statistics for AuNE (black, A and B) and AuNS (red, C and D) dimers. The histograms in (A) and (C) show the probability density distributions of the percentage of signal attributed to one of the molecules (pA) in the bi-analyte sm-SERS simulation. The histograms in (B) and (D) show the distributions of SERS intensities normalized by averages (<I>)
Figures 6B and 6D show the SERS intensity distributions normalized by average values for 106 events configurations of adsorbed molecules. This kind of result is frequently presented in sm-SERS experiments.39,65 The AuNS dimer (red, Figure 6D) shows a tailed distribution where most of the events are null. Intensities up to 10x greater than the average can be observed. Like AuNS dimer, the AuNE HS structure also presents an intensity distribution with a greater population of zero intensity events, which is characteristic of sm-SERS dynamics. However, the AuNE dimer distribution is considerably more tailed with events of intensities as large as 30x the average being observed. Also, the percentage of non-zero intensity events is considerably small if compared to the case of AuNS dimer. This is in complete accordance (as expected) to the analysis in terms of HS localization, through the value of the TPD parameter k. This means that, even though the surface curvature increases the access of molecules close to the HS center (see θ distribution of Figure 5), the large degree of localization produced at the high curvature regions dominates the sm-SERS statistics, shaping a very tailed distribution and limiting the porcentage of non-zero events to be observed. The above results show that the tail and percentage of non-zero events in sm-SERS intensity distributions is a direct measure of the HS near-field surface distribution and may be used to reveal the HS local structure in terms of surface curvature. Moreover, the investigated system examplifies the effect of dominance of HS localization over HS availability, here translated in terms of probability of access of molecules as close as possible to the regions of large field amplifications. Custer size effect in sm-SERS statistics In this section we investigate the effect of nanoparticle aggregation state on p(F) and consequently on the sm-SERS statistics. All discussions will be made for the case of aggregates of 20 nm radius AuNSs. In the case of clusters with other nanoparticle shapes, complex electromagnetic interactions, such as Fano resonances,44,66,67 may lead to differential field distributions. We keep such systems for a future analysis. Also this study was conducted for a fixed wavelength excitation, as opposed to the procedure carried out for the AuNE dimer. The reason for this is that in some SERS experiments the formation of HSs are performed by nanoparticle aggregation, for instance, by changes in the solution ionic strength.4,46 In such experiments, a distribution of clusters with different sizes may be obtained, which will contibute to the SERS intensities observed for a fixed incident radiation wavelength. This section is intended to search for hints on such cluster size distribution in a given sm-SERS experiment from the signal intensity distributions. The increase in the cluster size imposes some degrees of complexities to the calculations, since multiple nanoparticle arrangements in a given cluster size should be considered. Figure 7 shows examples for AuNS trimers, where two arrangements are presented (linear - A- with α = 0 rad and a configuration where the three particles are touching each other - B - with α = 2π/3 rad). As the cluster size increases the variability of possible configurations dramatically increases. In this manuscript we keep the discussion to the case of a trimer in comparison to the dimer, from which we draw some qualitative conclusions that may be extended to more complex geometries.
 Figure 7. (A) and (B) show different AuNS trimer configurations. (C) presents a 3D map of F on the surface of a trimer configuration. For simplicity, only the enhancements for one particle are presented. (D) shows the TPD parameter k as function of the trimer configuration, described by the relative angle α (the red point represents the result for the dimer)
For a linear trimer, the symmetric arrangement of the two HSs (schematically shown in Figure 7A by red areas), permits us to apply the same procedure used in the case of dimers to map the 3D field distribution, in terms of θ. For any other configuration (α ≠ 0) a full 3D calculation of F must be performed. This is schematically shown in Figure 7C. In those cases, the field enhancements on the surface of the three particles were calculated. For each trimer configuration ranging from α = 0 to α = 2π/3 rad, we calculated the p(F) distributions and measured the TPD paremeter k, presented in Figure 7D. Interestingly, the HS degree of localization, described by k increases as function of α, although none of the results are compared to the case of HS localization observed for AuNE dimer of previous section. This general observation suggests that as the cluster size increases, the SERS enhancement factor becomes even more localized if compared to the dimer (red point in Figure 7D). This could be attributed to a destructive interaction among HSs in the same cluster that leads to faster F decays along the surface.61 This HS interaction is more important for smaller relative distances, which is obtained for larger α (as shown in Figure 7C), in agreement to the observed variation of k.
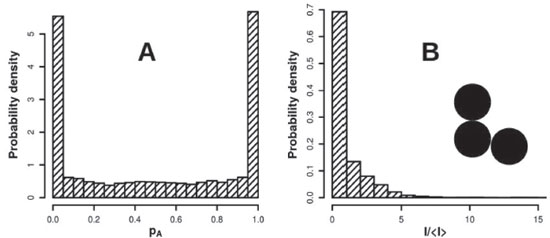 Figure 8. sm-SERS statistics for AuNS trimers. The histogram in (A) shows the probability density distributions of the percentage of signal attributed to one of the molecules (pA) in the sm-SERS bi-analyte simulations. The histogram in (B) shows the distribution of SERS intensities normalized by the average (<I>)
The changes in HS localization observed above should enable us to extract information about the cluster size configurations in a given SERS experiment, in a similar analysis as in the previous section. The presence of multiple HSs in AuNS trimers also increases the HS availability to the adsorbing molecules. Again, we have two competing contributions to the sm-SERS statistics that must be investigated. Link with sm-SERS measurements The sm-SERS simulation was performed with the same procedure as in the previous section. Figure 8 shows the results for AuNS trimers. As it can be seen in Figure 8A, a 10 % coverage still enables observation of sm-SERS events for such cluster size. The results in Figure 8 assumes in each simulation step, t, a random distribution of N molecules on a randomly selected trimer with a geometry described by α. The average normalized intensity distribution for the trimers is less tailed than the observed for the dimers (Figure 6D). This result cannot be accounted for if we take only the comparison between the degrees of localization in the two types of structures (values of k). A greater HS localization should lead to a more tailed distribution and this was not observed. This result suggests a dominance of the HS availability for AuNS trimers over the field enhancement localization. This can be seen in Figure 7C, which shows two regions of large values of F on the same nanoparticle surface, a situation that positively contributes for a molecule to probe a large F. Hence, the increase in the cluster size leads to a less skeewed distribution. It should be pointed out that the above interpretation may be only possible because the laser wavelength was kept fixed in the simulation. Trimers present redshifted resonances in respect to dimers. A change in incident wavelength could lead to an increase in the contribution due to field localization. The above results suggest the possibility to use the shapes of sm-SERS distributions to probe the cluster sizes in a given SERS experiment. The results point to the observation of less tailed distributions for larger cluster sizes maybe even changing from the exponential to a lognormal shape. It is worth pointing out that multiple particle cluster sizes (for instance mixtures of dimers and trimers) could also contribute to changes in the observed sm-SERS histograms, but we keep such investigations to a separate study.
CONCLUSION The sm-SERS intensity distribution carries information on the HS local field properties, which are dependent on metal composition, nanoparticle shape, size, aggregation state and incident light wavelength. In this manuscript we showed by classical electrodynamics simulations that experiments at the sm-SERS regime, besides the analytical applications, enables the extraction of fundamental properties regarding plasmonic nanoparticles. After the experiment is succesfully performed, there is a hard task in traslating the observed information (usually in the form of histograms of intensity distributions) in terms of HS properties. In this manuscript we studied the link between nanoparticle shape (in terms of surface curvature) and nanoparticle aggregation state on the sm-SERS statistics. The results reveal the possibility of interpreting the intensity distributions in terms of two main characteristics: the HS availability to molecules and its field enhancement localization. It was showed that the dominance of one or the other characteristic leads to different directions in shaping the SERS intensity distribution histograms. For instance, the increase of cluster size, i.e. the change in aggregation state, creates multiple HSs, for which the degree of localization is greater than in the case of dimer structures, due to inter HS electromagnetic interactions. However, the effect of localization may be surpassed by increased access for molecules to probe large field enhancements. Our results show that, for fixed wavelength excitation, the increase in aggration state is dominated by the effect of HS availability and the sm-SERS histograms show a less tailed distributions compared to smaller aggregates. In this manuscript the ideas are presented for simple systems such as small clusters of gold nanoellipsoids and nanospheres. A more detailed analysis of the local field properties and structures probed by the molecules needs a deeper analysis of SERS intensity fluctuations for each individual system. But the ideas presented here may be used as a preliminary guide to interpretation on the HSs structure/near-field properties and experimental intensity distributions.
ACKNOWLEDGEMENTS The authors would like to thank FAPESP (2016/21070-5) and CNPq (408985/2016-0 and PIBIC program) for the funding support. This study was financed in part by CAPES - Finance Code 001. This work used resources of the Centro Nacional de Processamento de Alto Desempenho em São Paulo (CENAPAD-SP).
REFERENCES 1. Jiang, M.-M.; Chen, H.-Y.; Shan, C.-X.; Shen, D.-Z.; Phys. Chem. Chem. Phys. 2014, 16, 16233. 2. Lee, H. W.; Papadakis, G.; Burgos, S. P.; Chander, K.; Kriesch, A.; Pala, R.; Peschel, U.; Atwater, H. A.; Nano Lett. 2014, 14, 6463. 3. Aroca, R.; Surface-Enhanced Vibrational Spectroscopy, John Wiley & Sons, Ltd: Chichester, 2006. 4. Ru, E. C. L.; Etchegoin, P. G.; Principles of Surface-Enhanced Raman Spectroscopy and Related Plasmonic Effects, Elsevier: Amsterdam, 2008. 5. Ferry, V. E.; Munday, J. N.; Atwater, H. A.; Adv. Mater. 2010, 22, 4794. 6. de Souza, M. L.; Corio, P.; Brolo, A. G.; Phys. Chem. Chem. Phys. 2012, 14, 15722. 7. Tsakalakos, L.; Nanotechnology for Photovoltaics, CRC Press: Boca Raton, 2010. 8. Brolo, A.; Nat. Photonics 2012, 6, 709. 9. Maisonneuve, M.; Valsecchi, C.; Wang, C.; Brolo, A. G.; Meunier, M.; Biosens. Bioelectron. 2015, 63, 80. 10. Li, M.; Cushing, S. K.; Wu, N.; Analyst 2015, 140, 386. 11. Cortés, E.; Adv. Opt. Mater. 2017, 5, 1. 12. Zhang, Y.; He, S.; Guo, W.; Hu, Y.; Huang, J.; Mulcahy, J. R.; Wei, W. D.; Chem. Rev. 2018, 118, 2927. 13. Hou, W.; Cronin, S. B.; Adv. Funct. Mater. 2013, 23, 1612. 14. Baffou, G.; Quidant, R.; Chem. Soc. Rev. 2014, 43, 3898. 15. Cortés, E.; Science 2018, 362, 28. 16. Lemos de Souza, M.; Pereira dos Santos, D.; Corio, P.; RSC Adv. 2018, 8, 28753. 17. Maier, S. A.; Plasmonics: Fundamentals and Applications, Springer, 2007. 18. Shahbazyan, T. V.; Stockman, M. I. In Plasmonics: Theory and Applications; Shahbazyan, T. V; Stockman, M. I., eds.; Springer Netherlands: Dordrecht, 2013. 19. Quinten, M.; Optical Properties of Nanoparticle Systems, Wiley-VCH Verlag GmbH & Co. KGaA: Weinheim, Germany, 2011. 20. Zayats, A. V.; Maier, S. A. In Active Plasmonics and Tuneable Plasmonic Metamaterials; Zayats, A. V., Maier, S. A., eds.; John Wiley & Sons, Inc.: Hoboken, 2013. 21. Maradudin, A. A.; Sambles, J. R.; Barnes, W. L. Modern Plasmonics (Handbook of Surface Science), Vol. 4, 2014. 22. Ding, S.-Y.; You, E.-M.; Tian, Z.-Q.; Moskovits, M.; Chem. Soc. Rev. 2017, 46, 4042. 23. Schatz, G. C.; Young, M. A.; Van Duyne, R. P.; Surface-Enhanced Raman Scattering - Physics and Applications 2006, 103, 19. 24. Yamamoto, Y. S.; Ozaki, Y.; Itoh, T.; J. Photochem. Photobiol. C Photochem. Rev. 2014, 21, 81. 25. Lombardi, J. R.; Birke, R. L.; Lu, T.; Xu, J.; J. Chem. Phys. 1986, 84, 4174. 26. Lombardi, J. R.; Birke, R. L.; J. Chem. Phys. 2012, 136, 144704. 27. Corio, P.; Rubim, J. C.; Aroca, R.; Langmuir 1998, 14, 4162. 28. Etchegoin, P. G.; Lacharmoise, P. D.; Le Ru, E. C.; Anal. Chem. 2009, 81, 682. 29. Le Ru, E. C.; Meyer, M.; Blackie, E.; Etchegoin, P. G.; J. Raman Spectrosc. 2008, 39, 1127. 30. Le Ru, E. C.; Etchegoin, P. G.; Meyer, M.; J. Chem. Phys. 2006, 125, 204701. 31. Etchegoin, P. G.; Le Ru, E. C.; Phys. Chem. Chem. Phys. 2008, 10, 6079. 32. Le Ru, E. C.; Grand, J.; Sow, I.; Somerville, W. R. C.; Etchegoin, P. G.; Treguer-Delapierre, M.; Charron, G.; Félidj, N.; Lévi, G.; Aubard, J.; Nano Lett. 2011, 11, 5013. 33. Camden, J. P.; Dieringer, J. A.; Wang, Y.; Masiello, D. J.; Marks, L. D.; Schatz, G. C.; Van Duyne, R. P.; J. Am. Chem. Soc. 2008, 130, 12616. 34. Wustholz, K. L.; Henry, A.-I.; McMahon, J. M.; Freeman, R. G.; Valley, N.; Piotti, M. E.; Natan, M. J.; Schatz, G. C.; Van Duyne, R. P.; J. Am. Chem. Soc. 2010, 132, 10903. 35. Etchegoin, P. G.; Meyer, M.; Le Ru, E. C.; Phys. Chem. Chem. Phys. 2007, 9, 3006. 36. Etchegoin, P. G.; Le Ru, E. C.; Anal. Chem. 2010, 82, 2888. 37. dos Santos, D. P.; Temperini, M. L. A.; Brolo, A. G.; Acc. Chem. Res. 2019, 52, 456. 38. Zrimsek, A. B.; Wong, N. L.; Van Duyne, R. P.; J. Phys. Chem. C 2016, 120, 5133. 39. Santos, D.; Temperini, M.; Brolo, A. Em Introduction to Plasmonics; Szunerits, S., Boukherroub, R., eds.; Pan Stanford, 2015, cap. 10. 40. dos Santos, D. P.; Temperini, M. L. A.; Brolo, A. G.; J. Am. Chem. Soc. 2012, 134, 13492. 41. dos Santos, D. P.; Andrade, G. F. S.; Brolo, A. G.; Temperini, M. L. A.; Chem. Commun. 2011, 47, 7158. 42. Grillet, N.; Manchon, D.; Bertorelle, F.; Bonnet, C.; Broyer, M.; Cottancin, E.; Lermé, J.; Hillenkamp, M.; Pellarin, M.; ACS Nano 2011, 5, 9450. 43. Pellarin, M.; Ramade, J.; Rye, J. M.; Bonnet, C.; Broyer, M.; Lebeault, M. A.; Lermé, J.; Marguet, S.; Navarro, J. R. G.; Cottancin, E.; ACS Nano 2016, 10, 11266. 44. Santinom, A.; da Silva, M. A.; Villa, J. E. L.; Poppi, R. J.; Mazali, I. O.; dos Santos, D. P.; Vib. Spectrosc. 2018, 99, 34. 45. Ye, J.; Wen, F.; Sobhani, H.; Lassiter, J. B.; Dorpe, P. Van; Nordlander, P.; Halas, N. J.; Nano Lett. 2012, 12, 1660. 46. dos Santos, D. P.; Temperini, M. L. A.; Brolo, A. G.; J. Phys. Chem. C 2016, 120, 20877. 47. Wu, Y.; Li, G.; Camden, J. P.; Chem. Rev. 2018, 118, 2994. 48. García De Abajo, F. J.; Rev. Mod. Phys. 2010, 82, 209. 49. Xu, Y.; Appl. Opt. 1995, 34, 4573. 50. Xu, Y.; Appl. Opt. 1997, 36, 9496. 51. Waxenegger, J.; Trügler, A.; Hohenester, U.; Comput. Phys. Commun. 2015, 193, 138. 52. Hohenester, U.; Trügler, A.; Comput. Phys. Commun. 2012, 183, 370. 53. Johnson, P. B.; Christy, R. W.; Bull. Am. Phys. Soc. 1971, 16, 785. 54. Kahnert, F. M.; J. Quant. Spectrosc. Radiat. Transfer 2003, 79–80, 775. 55. Ringler, M.; Schwemer, A.; Wunderlich, M.; Nichtl, A.; Kürzinger, K.; Klar, T. A.; Feldmann, J.; Phys. Rev. Lett. 2008, 100, 203002. 56. Hohenester, U.; Trügler, A.; Comput. Phys. Commun. 2012, 183, 370. 57. R Core Team R: A Language and Environment for Statistical Computing 2017. 58. Soetaert, K.; plot3D: Plotting Multi-Dimensional Data, 2017. 59. Le Ru, E. C.; Etchegoin, P. G.; Chem. Phys. Lett. 2006, 423, 63. 60. dos Santos, D. P.; Temperini, M. L. A.; Brolo, A. G. In Introduction to Plasmonics: Advances and application; Szunerits, S., Boukherroub, R., eds.; Pan Stanford, 2015, p. 358. 61. Kiefl, E. J.; Kiefl, R. F.; dos Santos, D. P.; Brolo, A. G.; J. Phys. Chem. C 2017, 121, 25487. 62. Rodrigues, D. C.; de Souza, M. L.; Souza, K. S.; dos Santos, D. P.; Andrade, G. F. S.; Temperini, M. L. A.; Phys. Chem. Chem. Phys. 2015, 17, 21294. 63. Etchegoin, P. G.; Le Ru, E. C.; Fainstein, A.; Phys. Chem. Chem. Phys. 2011, 13, 4500. 64. Blackie, E.; Le Ru, E. C.; Meyer, M.; Timmer, M.; Burkett, B.; Northcote, P.; Etchegoin, P. G.; Phys. Chem. Chem. Phys. 2008, 10, 4147. 65. Santos, D. P. dos; Andrade, G. F. S.; Temperini, M. L. A.; Brolo, A. G.; J. Phys. Chem. C 2009, 113, 17737. 66. Giannini, V.; Francescato, Y.; Amrania, H.; Phillips, C. C.; Maier, S. A.; Nano Lett. 2011, 11, 2835. 67. Mirin, N. A.; Bao, K.; Nordlander, P.; J. Phys. Chem. A 2009, 113, 4028.
FAPESP helped in meeting the publication costs of the article |
On-line version ISSN 1678-7064 Printed version ISSN 0100-4042
Qu�mica Nova
Publica��es da Sociedade Brasileira de Qu�mica
Caixa Postal: 26037
05513-970 S�o Paulo - SP
Tel/Fax: +55.11.3032.2299/+55.11.3814.3602
Free access


