Artigo
| Analysis of the baseline drift artifact in hadamard transform separation techniques |
|
Yan HongI,II; Jingming SuI; Chaoli TangI; Chaoqun HuangII,*; Sheng LiuIII; Yannan ChuII
I. School of Electrical and Information Engineering, Anhui University of Science and Technology, Huainan, Anhui, 232001, China Recebido em 17/08/2019 *e-mail: cqhuang@aiofm.ac.cn The baseline drift artifact (BDA), namely, the baseline bias between the Hadamard transform (HT) spectrum and the signal averaging (SA) spectrum was unfortunately found in the HT pulsed separation techniques, which makes the HT analytical chemistry face the challenge of non-stability and unreliability. In order to find out the origin and eliminate the BDA phenomenon, the multiplexing mechanism of Hadamard transform ion mobility spectrometry (HT-IMS) has been analyzed in this research. Through simulation and experimental comparisons, the non-ideal overlap defect in Hadamard multiplexing process was suggested as the cause for the BDA phenomenon. Eventually, with a correction method, the BDA phenomenon could be well addressed, which guarantees the reliability and stability of HT techniques without increasing the hardware complexity. INTRODUCTION Traditionally, the single injection mode was always adopted in pulse separation science. The sample injection pulse is often limited no more than 1% of the total scan time, which leads to a very low utilization ratio and low signal to noise ratio (SNR). Fortunately, the Hadamard multiplexing technique was introduced into the ion mobility spectrometry (IMS) and the significant enhancement of the duty cycle (DC) has been achieved to nearly 50%. Accordingly, the SNR of IMS has been improved nearly 2-10 folds.1-3 Due to that, the Hadamard multiplexing has been efficiently introduced into many other fields, such as the capillary electrophoretic separation technique (CE),4-7 time-of-flight mass spectrometry,8-10 gas chromatography/mass spectrometry (GC/MS) and so on. 11-13 However, with the enhancement of the SNR, the artifacts were unexpectedly found in the demultiplexed data of HT techniques. Among these artifacts, the false peak phenomenon attracts most attention. Prost et al. developed an algorithm to identify and remove the false peaks in Hadamard transform ion mobility mass spectrometry.14 Zeppenfeld et al. analyzed that the negative systematic false peak errors were introduced by the instrumentation in the analysis of time of flight mass spectrometry.15 Besides, the false or spurious peaks were also located in data of HT-CE, 6,7 Time-of-flight Mass Spectrometry.16 Recently, our group focuses on the study of the artifacts in HT-IMS and have put forward some efficient methods to suppress these false peak artifacts.17,18 Except for the false peaks as mentioned above, another kind of artifact, i.e., the "baseline drift artifacts (BDA)" were also presented in the demultiplexed data of HT techniques. These baseline bias between the HT spectrum and the SA spectrum leads to the instability of the data of HT. In the reports of HT-CE,4,19 the remarkable baseline inconsistency (namely the BDA phenomenon) between the single injection mode and Hadamard injection mode of capillary electropherograms has been presented. In addition, in researches of Hadamard transform-gas chromatography/mass spectrometry (HT-GC/MS),13,20 the BDA phenomenon was also found. Furthermore, the BDA phenomenon was demonstrated in the reports of HT-IMS too.1,2,14 However, these BDA artifacts are all neglected, which may affect the reliability and the quality analysis level of HT techniques. In order to find out the origin of the BDA phenomenon and address the problem completely, the HT-IMS was selected to be the analyzing object in this work. Through simulation of the Hadamard multiplexing and demultiplexing process, the BDA phenomenon was reproduced, which indicates that the BDA phenomenon of HT separation techniques doesn't result from the modulation defects but from the actual superposition mechanism of Hadamard multiplexing. Eventually, with an adaptive compensation algorithm, this BDA distortion could be effectively solved.
EXPERIMENTAL General method The conventional IMS usually works under the signal averaging mode, which is shown in Figure 1 (a). During each total scan period, the ions are injected only once under the function of the gating sequence. For example, if the gating function is like "1000000000...", each "1" represents opening the ion gate for a short pulse and each "0" means shuttering the ion gate for a short while. Here, the time cost for each "1" or "0" is equivalent. To guarantee the high resolving power, the injection time (about 200 µs) is always limited to no more than 1% of the total scan period (about 30 ms), which forms a low duty cycle (DC), and eventually it leads to low ion throughput and low SNR in conventional SA-IMS.
In order to enhance the duty cycle and so as to the SNR of IMS, the Hadamard multiplexing technique was introduced. In Hadamard multiplexing ion mobility spectrometry (HT-IMS), the pseudo random binary sequence (PRBS) works as the modulation sequence as shown in Figure 1(b). For instance, if a 15-bit PRBS is like "100011100101100", each "0" means shuttering the injection of the ions for a short period, and each "1" represents starting one injection for a short while. Thus, under the function of the PRBS modulation sequence, the injection of the ions in one total scan time was activated for multiple times, which largely improves the duty cycle and the ion throughput. The convolution process of the Hadamard multiplexing could be described as Eq. 1.  where the order of the S-matrix is the n (n is the length of the PRBS), and X is the spectrum data corresponds to one single pulse of injection, matrix Y represents the multiplexed data, which were convoluted by multiple spectra. To recover the original spectrum X, the multiplexed data Y should be deconvoluted by multiplication of the inverse S-matrix, S-1, which is described in Eq. 2.  Here, the X* represents the data of inverse HT spectrum. Apparently, the duty cycle of the HT technique is much more than that of the SA mode, which must achieve a high ion throughput and SNR. The experiments are implemented with our self-built atmospheric pressure corona discharge ion mobility spectrometry (APCD-IMS), which we have described in our previous work 14,15 in detail. It consists of ion drift tube (including ionization region, reaction region, ion shutter, drift region and Faraday plate, ion charge amplifier), data processing unit, the ion gate controller and high-voltage power supplier (HV). The reaction region and drift region are isolated by a B-N type ion gate, which is coupled with the ion gate controller. Under the function of the controller, the ion gate is opened or shuttered frequently, which activates or prevents the injection of the ion packets from the reaction region to the drift region. The APCD-IMS works under negative corona discharge detection mode in this work. To simplify the analysis of this work, no sample gases are introduced into APCD-IMS instrument except for the ambient air. Thus, only the reactant ions are generated in the ionization region by negative corona discharge in air under the control of the high voltage (HV) module, and the measurements are mainly about the reactant ions. Here, the homogeneous electric field in the drift region is set as 300 V cm-1, and the ion gate controller generates the signal averaging gating sequence and Hadamard multiplexing gating sequence as required, and each ion gate pulse width for all the following experiments is set as 200 µs.
RESULTS AND DISCUSSION Phenomenon of BDA The first group of measurements (average data of SA and HT methods measured in September 2018) are demonstrated in Figure 2(a) and 2(b), where the average experimental temperature is 301K and the average relative humidity is about 41%. As shown in Figure 2(a), the normal reactant ion peak (RIP) is illustrated in the spectrum of SA-IMS. The Mean Value for the Baseline (MVB) of SA-IMS is -47, which is close to 0. In the inset of Figure 2(b), the multiplexed data of Hadamard transform is illustrated, where the order of the S-matrix is 255 and the MVB for the multiplexed data is -46, nearly the same with that of the SA-IMS. Figure 2(b) demonstrates the spectrum of HT-IMS. As we can see, the MVB for HT-IMS is about -5, the drift time for the RIP is the same with that of the SA-IMS.
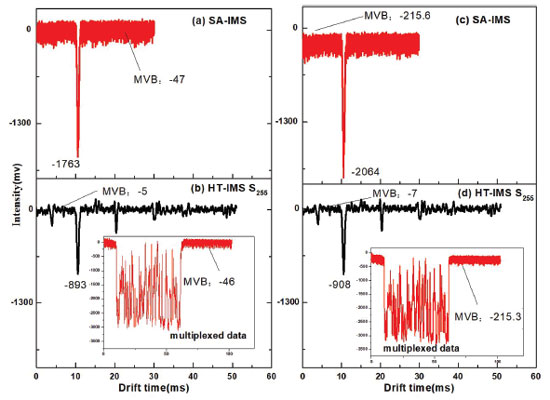 Figure 2. Comparison of experimental measurements for SA-IMS and HT-IMS:(a) and (b) are the first group of experimental results; (c) and (d) are another group of experimental results
Figure 2(c)-(d) demonstrate another group of measurements (average data of SA and HT methods measured in March 2019). It was measured under the condition of 295 K, the relative humidity is 55% and it works under ambient pressure. Figure 2(c) shows the measurement of SA-IMS. The MVB is -215.6, which is much far away from zero. In the inset of Figure 2(d), the multiplexed data of HT-IMS is shown, the MVB for the multiplexed data is about -215.3, which is nearly the same with that of SA-IMS. While, the MVB of the HT-IMS spectrum shown in Figure 2(d) is about -7, which is much lower than that of the SA-IMS (-215.6). Under the same function of SA method, the baselines of Figure 2(a) and Figure 2(c) vary from each other, which is possibly due to different working condition. Similar measurements appeared in other researches of HT-IMS1,2 and HT-CE7,19 that is to say, most of the MVBs for IMS or other pulsed separation techniques are not always kept as 0 due to their different working conditions and environmental noise. However, the MVBs for different HT techniques are nearly the same (very close to zero), as shown in Figure 2(b) and Figure 2(d). Thus, the MVB bias between the SA-IMS and the HT-IMS is so-called the BDA phenomenon. Actually, this kind of BDA phenomenon has presented in former reports of HT-IMS,1,2,14 HT-CE,7,19 and HT-GC/MS13,20 and so on, which makes the HT technique suffer from the challenge of instability. Spectrum response principle of SA-IMS and HT-IMS Under signal averaging mode, during the total scan time, the injection is activated only once (single injection mode). Therefore, the gating pulse could be described as "100000000..." and the spectrum response is shown in Figure 3a. While, under Hadamard multiplexing mode, the pseudo random binary sequence (PRBS) is used to substitute the single injection mode to control the ion gate. Thus, the multiplexed data of Hadamard multiplexing method could be regarded as the superimposition of (m+1)/2 (m is the length of the PRBS) independent spectra, as shown in Figure 3(b). After the inverse Hadamard transform, the demultiplexed data could be obtained as shown in Figure 3(c).
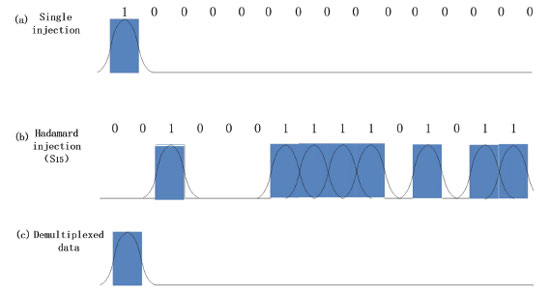 Figure 3. Spectrum response comparison of single injection and multiplexing injection mode:(a) single injection mode; (b) Hadamard multiplexing injection mode; (c) the demultiplexed data
Simulation of SA-IMS and ideal HT-IMS Based on the principle of spectrum response of SA method and Hadamard multiplexing method, the simulation of SA-IMS and ideal HT-IMS is implemented. As shown in Figure 4(a), if the MVB for SA-IMS is 0, the MVB for the multiplexed data of Hadamard method would be 0 too, shown in the inset of Figure 4(b). After the inverse Hadamard transform, the HT-IMS spectrum is shown in Figure 4(b). Obviously, the BDA phenomenon was never found in this section of simulation.
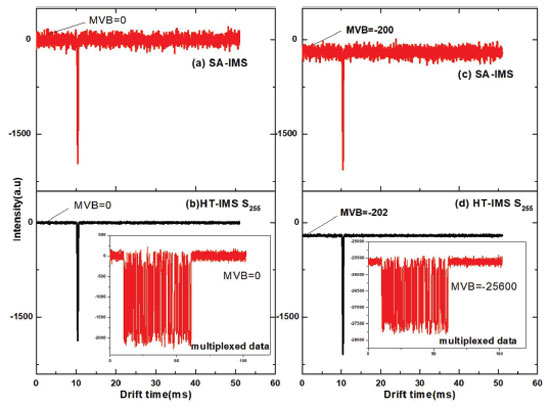 Figure 4. Simulation comparison of SA-IMS and HT-IMS : (a) is the simulation spectrum of SA-IMS; (b) is the simulation spectrum of HT-IMS; (c) is the SA-IMS; (d) is the HT-IMS, in the inset of (d), the multiplexed data is shown
However, according to the actual working condition, the MVB for SA-IMS is not always kept as 0, as shown in Figure 2(c). Accordingly, in the simulation process, we could set the MVB of SA-IMS as -200, thus, the simulation results of SA-IMS and ideal HT-IMS are shown in Figure 4 (c) and (d), respectively. Figure 4(c) is the spectrum of SA-IMS, where the MVB is nearly about -200. According to the theory of Hadamard multiplexing, the multiplexed data are obtained and shown in the inset of Figure 4(d). It is clear that the MVB of the multiplexed data is close to -25600 (here, the order of the S-matrix is 255, according to the theory of Hadamard multiplexing, the Hadamard multiplexed data are convoluted by (m+1)/2 separate spectra, thus the baseline value of the multiplexed data is nearly equal to -200×128), which is far away from -200. Through the inverse Hadamard transform, the demultiplexed data is obtained, as shown in Figure 4(d), where the MVB of the HT-IMS spectrum returns to -200, which is equal to that of the SA-IMS and the BDA phenomenon was not found. In total, whether the MVB of SA-IMS is close to or far away from 0, the MVB for the demultiplexed data of ideal/theoretical HT-IMS is always kept the same with that of SA-IMS, and the BDA phenomenon would not occur. Discover the origin of BDA Through comparison of section 4.1 and section 4.2, it was found that when the MVB of SA-IMS is not equal to 0, and indeed most experimental baseline of the pulsed separation techniques are not equal to 0,1,2,7,14 thus the BDA phenomenon would be generated in HT techniques. It is well known that, whatever for ideal or actual Hadamard multiplexing, the inverse Hadamard transform processes are the same. Thus, the BDA phenomenon must be originated from the Hadamard multiplexing process. In this section, in order to explore the real process of the Hadamard multiplexing and find out the real cause for the BDA artifact, the superposition mechanism are evaluated with simulation and experimental methods, respectively. To carry out the test, the gating sequence for single, double, and triple injection modes are designed as following: Single injection, "1000000000...". In the total scan time, the gate was opened only once. Double injections, "1010000000...". In the total scan time, the gate was opened twice. Triple injections, "1010100000...". In the total scan time, the gate was opened for triple times. As shown in the left side of Figure 5, the experimental results are demonstrated. Figure 5(a-c) demonstrate the spectrum responses to single injection, double injections and triple injections, the average times are set as five. Figure 5(a) shows the spectrum of single injection, and the MVB of the spectrum is about -200. It is clear that the MVBs for the superposition spectra (Figure 5(b) and (c)) are all close to -200, which is the same with that of the single injection mode as shown in Figure 5(a). However, on the right side of Figure 5, the simulation results of single, double and triple injections are illustrated in Figure 5(f-h), respectively. As we can see, the MVB for the single injection is -200, while the MVB for double and triple injection modes are changed to -400 (-200*2) and -600 (-200*3). The main difference between simulation and experimental results is the MVB of the superposition spectra. This indicates that in actual experimental multiplexing process, the signal peak is the superposition of multiple peaks, while the baseline of the multiplexed data would be kept unchanged with that of the single injection mode. However, under ideal simulation Hadamard multiplexing mode, the multiplexed data are the superposition results of multiple independent spectra and so does the baselines of the multiplexed data.
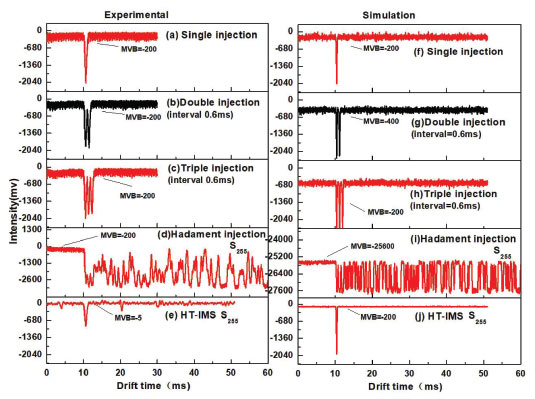 Figure 5. Multiplexing process comparison of experiments and simulations: (a-e)experimental spectra of single injection, double injections and Hadamard multiplexed and demultiplexed data;(f-j) are simulation results
According to the different multiplexing mechanism of actual and ideal Hadamard multiplexing, the experimental and simulation results of HT-IMS are illustrated in Figure 5(d-e) and Figure 5(i-j), respectively. Under experimental conditions, the multiplexed data are shown in Figure 5(d), where the MVB (-200) is nearly the same with that of the single injection pattern shown in Figure 5(a), while, the MVB of the demultiplexed data shown in Figure 5(e) is about -5 (very close to 0), which is far lower than that of the SA-IMS, thus results in the obvious BDA phenomenon. However, under simulation method, on the right side of Figure 5, the MVB of the multiplexed data shown in Figure 5(i) is -25600, which is 128 folds of that of the SA-IMS (single injection mode as shown in Figure 5(f)). However, the MVB of the demultiplexed data shown in Figure 5(j) is the same with that of the simulation spectrum of SA-IMS (shown in Figure 5(f)). Thus, the BDA phenomenon has never be found. Through the comparison of multiplexing process of experimental and ideal Hadamard transform methods, it was found that the baseline of ideal multiplexed data must be the overlaps of multiple spectra's baselines, however, the baseline of experimental multiplexed data is the same with that of the single injection mode. Thus, after the same inverse Hadamard transform, the baselines of the demultiplexed data of ideal and experimental HT methods may vary from each other significantly, especially when the baseline of SA-IMS is far away from 0. Eventually, this would lead to the remarkable BDA phenomenon (baseline inconsistency between SA method and HT method). As a result, the stability and reliability of HT-IMS will suffer from big challenge. Correction of the BDA Since we have found out the reason why the BDA phenomenon is generated and in order to address this problem of HT-IMS, an adaptive correction algorithm is introduced into our self-built HT-IMS. Actually, the correction method includes two procedures, one is to determine whether there exists BDA phenomenon or not and the other is the baseline correction module. Firstly, with the determinant module, the baselines of SA method and HT method are compared and the existence of BDA are tested. If the BDA phenomenon does exist, the baseline correction module will be activated by adjusting the baseline of HT method in line with that of the SA method. Figure 6 demonstrates the experimental comparison before and after correction. On the left side, the experimental results obtained before correction are demonstrated in Figure 6(a-b). Through determinant module, the existence of the BDA phenomenon was ensured. Accordingly, the correction procedure will be implemented. The final result is demonstrated on the right side of Figure 6. As shown in the Figure 6(d), the MVB of the HT-IMS (after correction) is nearly the same with that of the SA-IMS, and thus the BDA phenomenon was addressed completely.
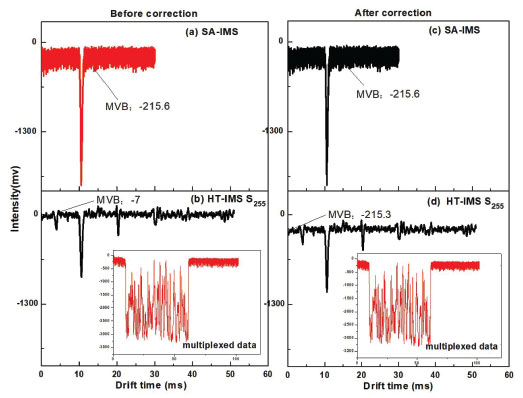 Figure 6. Comparison of experimental results of HT-IMS before and after correction: (a) and (b) are the results before correction, (a) is the spectrum of SA-IMS; (b) is the spectrum of HT-IMS (the order of the S-matrix is 255); (c) and (d) are the results obtained after correction
CONCLUSIONS With HT technique, the signal to noise ratio of pulsed separation techniques could be enhanced significantly, however, the artifacts, especially the BDA phenomenon was introduced into HT techniques. Simulation and experimental tests suggest that the inherent unideal superposition mechanism rather than the modulation defect would lead to the BDA phenomenon. Based on that, a correction method was introduced and successfully addressed the BDA problem completely, which guarantees the stability and reliability of the HT pulse separation techniques.
ACKNOWLEDGEMENTS This work was supported by National Natural Science Foundation of China (No. 61671434), Provincial Natural Foundation of Anhui Province (No.1808085MF169, 1808085QF197), Natural Science Research Project of Anhui Universities of China (No. KJ2018A0086, KJ2019A0103) and Provincial Science and Technology Major Project of Anhui Province of China (No.17030801035).
REFERENCES 1. Clowers, B. H.; Siems, W. F.; Hill, H. H.; Massick, S. M.; Anal. Chem. 2006, 78, 44. 2. Szumlas, A. W.; Ray, S. J.; Hieftje, G. M.; Anal. Chem. 2006, 78, 4474. 3. Kwasnik, M.; Caramore, J.; Fernandez, F. M.; Anal. Chem. 2009, 81, 1587. 4. Kaneta, T.; Yamaguchi, Y.; Imasaka, T.; Anal. Chem. 1999, 71, 5444. 5. Kaneta, T.; Kosai, K.; Imasaka, T.; Anal. Chem. 2002, 74, 2257. 6. Hata, K.; Kaneta, T.; Imasaka, T.; Anal. Chem. 2004, 76, 4421. 7. Hata, K.; Kaneta, T.; Imasaka, T.; Anal. Chim. Acta. 2006, 556, 178. 8. Zare, R. N.; Fernandez, F. M.; Kimmel, J. R.; Angew. Chem, Int. Ed. 2003, 42, 30. 9. Kimmel, J. R.; Fernandez, F. M.; Zare, R. N.; J. Am. Soc. Mass. Spectr. 2003, 14, 278. 10. Fernandez, F. M.; Vadillo, J. M.; Engelke, F.; Kimmel, J. R.; Zare, R. N.; Rodriguez, N.; Wetterhall, M.; Markides, K.; J. Am. Soc. Mass Spectrom. 2001, 12, 1302. 11. Lin, C. H.; Kaneta, T.; Chen, H. M.; Chen, W. X.; Chang, H. W.; Liu, J. T.; Anal. Chem. 2008, 80, 5755. 12. Fan, Z.; Lin, C. H.; Chang, H. W.; Kaneta, T.; Lin, C. H.; J. Chromatography. A 2010, 1217, 755-760. 13. Fan, G. T.; Yang, C. L.; Lin, C. H.; Chen, C. C.; Shih, C. H.; Talanta 2014, 120, 386. 14. Prost, S. A.; Crowell, K. L.; Baker, E. S.; Ibrahim, Y. M.; Clowers, B. H.; Monroe, M. E.; Anderson, G. A.; Smith, R. D.; Payne, S. H.; J. Am. Soc. Mass Spectrom. 2014, 25, 2020. 15. Zeppenfeld, P.; Krzyzowski, M.; Romainczyk, C.; David, R.; Rev. Sci. Instrum. 1993, 64, 1520. 16. Clowers, B. H.; Belov, M. E.; Prior, D. C.; Danielson, W. F.; Ibrahim, Y.; Smith, R. D.; Anal. Chem. 2008, 80, 2464. 17. Hong, Y.; Niu, W.; Gao, H.; Xia, L.; Huang, C. Q.; Shen, C. Y.; Jiang, Chu, H. Y.; Rsc. Adv. 2015, 5, 56103. 18. Hong, Y.; Huang, C.; Liu, S.; Xia, L.; Shen, C.; Chu, Y.; Anal. Chim. Acta. 2018, 1029, 44. 19. Braun, K. L.; Hapuarachchi, S.; Fernandez, F. M.; Aspinwall, C. A.; Anal. Chem. 2006, 78, 1628. 20. Cheng, Y. K.; Lin, C.H.; Kuo, S.; Yang, J.; Hsiung, S. Y.; Wang, J. L.; J. Chromatography. A 2012, 1220, 143. |
On-line version ISSN 1678-7064 Printed version ISSN 0100-4042
Qu�mica Nova
Publica��es da Sociedade Brasileira de Qu�mica
Caixa Postal: 26037
05513-970 S�o Paulo - SP
Tel/Fax: +55.11.3032.2299/+55.11.3814.3602
Free access


