Artigo
| Analytical expressions for the concentration and current in the reduction of hydrogen peroxide at a metal-dispersed conducting polymer film |
|
Rajagopal SwaminathanI; Kothandapani VenugopalII; Muthuramalingam RasiIII; Marwan AbukhaledIV; Lakshmanan RajendranV,*
I. Department of Mathematics,Vidhyaa Giri College of Arts and Science, Sivaganga - 630108, India Recebido em 17/08/2019 *e-mail: raj_sms@rediffmail.com A mathematical model describing the reduction of Hydrogen peroxide (H2O2) to water in a metal dispersed conducting polymer film is discussed. The model is based on a system of reaction-diffusion equations containing a non-linear term related to Michaelis-Menten kinetics of the enzymatic reaction. The approximate analytical expressions corresponding to the concentration of substrate and product for steady and non-steady state conditions have been obtained using a new approach to homotopy perturbation method (HPM). Approximate analytical expressions of the electrochemical oxidation current are also presented for steady and non-steady state conditions. The numerical simulation (Matlab program) response for concentration profiles was carried out and compared with the analytical results of this work and are found to be in good agreement. The influence of initial substrate concentration, the thickness of the film as well as the diffusion layer and kinetic parameters on the current response were investigated. A graphical procedure for estimating the kinetic parameters from the expression of the current response is also proposed. INTRODUCTION Enzyme-based fuel cells can produce higher energy than conventional batteries utilizing significantly all the naturally good materials. Enzymatic biofuel cells rely on the oxidation of substrates such as hydrogen or glucose and reduction of oxygen to harvest energy from complex media. In particular, glucose biofuel cells (BFCs) represent a promising alternative to supply energy from living organisms to implanted electronic devices. Oxidase enzymes are widely used in energy devices (biosensor, enzymatic biofuel cell, bioreactor, etc.). In glucose oxidation-reduction process, oxygen is diminished to water (H2O) or hydrogen peroxide (H2O2). Glucose oxidase is found in nectar and goes about as a common additive. Enzymatic glucose biosensors utilize an electrode rather than oxygen to take up the electrons required to oxidize glucose and produce current in the extent to glucose fixation.1 Glucose oxidase is broadly used for the determination of free glucose in body liquids (diagnostics), in crude botanic material, and the nourishment business. Toghill and Compton discussed non-enzymatic glucose sensors.2 It likewise has numerous applications in biotechnologies, commonly protein tests for natural chemistry incorporating biosensors in nanotechnologies.3 Besides, glucose oxidase has damage the cancer tissue and cells as a result of hydrogen peroxide formation. In recent times, many kinds of literature focused on glucose/hydrogen peroxide biofuel cell. Pizzariello et al. developed a glucose/hydrogen peroxide biofuel cell using a composite bulk modified bioelectrode based on a solid binding matrix.4 Choudhury et al. discussed the effect of hydrogen peroxide as an oxidant in an alkaline direct borohydride fuel cell.5 Bessette et al. reported the performance of the microfiber carbon electrode in magnesium-hydrogen peroxide semi-fuel cell under optimum conditions and at a reduced concentration of H2O2.6 Yamanaka et al. developed a three-phase H2O2 fuel cell for the production of a concentrated aqueous solution of H2O2 in an electrochemical reduction of O2.7 Yang et al. investigated the influence of H2O2 concentration in the performance of magnesium-hydrogen peroxide fuel cell with palladium-silver deposited cathode and silver-nickel deposited electrode.8 Han et al. developed a hydrogen peroxide fuel cell with TiO2 nanotube photoanode to increase the performance of the cell by make use of light and biomass.9 Also, Kjeang et al. demonstrated a microfluidic fuel cell incorporating hydrogen peroxide as oxidant.10 Adams et al. reported an electrochemical reduction of hydrogen peroxide using highly active palladium platinum catalysts.11 Do et al. developed a mathematical model which describes the bioelectrochemical reduction of hydrogen peroxide with direct electron transfer mechanism.12 Benfeitas et al. investigated hydrogen peroxide metabolism in human erythrocytes.13 The first example of glucose or hydrogen peroxide-based biofuel cell functioning under physiological conditions was reported in Agnès et al.14 An et al. developed and tested the performance of an alkaline direct ethanol fuel cell with hydrogen peroxide as oxidant.15 Also studied by An and coauthors, a one-dimensional mathematical model of the mixed potential in hydrogen peroxide fuel cell.16 Somasundaram et al. developed a kinetic model for the reduction of hydrogen peroxide to water in a metal-dispersed conducting polymer film.17 This model is based on a system of the non-linear reaction-diffusion equation. Somasundaram et al. obtained the steady-state concentration and current for limiting cases (low and high substrate concentration) only.17 In solving reaction-diffusion problems, there are mainly three types of methods: experimental, analytical, and numerical. Experiments are expensive, time-consuming, and usually, do not allow much flexibility in parameter variation. Numerical methods are popular for its computing capabilities, although it provides only a long list of numbers, not an equation. Analytical methods are the most difficult ones, providing solutions with parameters. In this paper, we will consider the last two techniques to solve the coupled non-linear reaction-diffusion equation describing the reduction of hydrogen peroxide to water. The purpose of this communication is to derive the analytical expressions for the concentration of glucose (substrate), hydrogen peroxide (product) and current for non-steady state condition.
MATHEMATICAL FORMULATION Figure 1 represents the schematic diagram for the reduction of hydrogen peroxide to water.
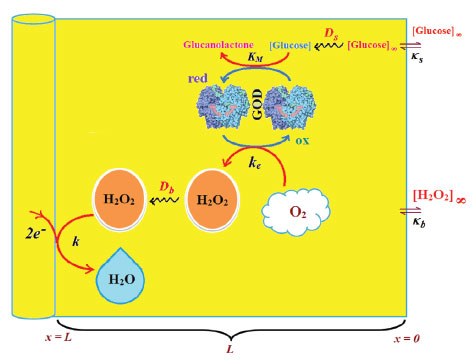 Figure 1. Schematic diagram for the reduction of hydrogen peroxide to water.
The reactions scheme occurring within the polymer film and in the bulk solution can be written as follows: 18 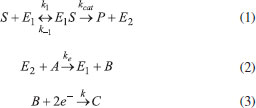 Eqn. (1) represents the oxidation of substrate (Glucose) S to product P (Hydrogen peroxide). Here E1 and E2 are the oxidized and reduced forms of the enzyme (oxidase) respectively. The reduction-oxidation process of the enzyme during the reduction of oxygen (A) to hydrogen peroxide (B) is shown in Eqn. (2). And the hydrogen peroxide which in turn reacts with microparticle in the presence of a pseudo first order rate constant k to produce water (C). Using Michaelis-Menten rate expression, the mass balance one dimensional equations for substrate and product within the polymer film can be written as follows: 18  where s(x,t) and b(x,t) are the concentrations of substrate and product respectively. DS and DB are the diffusion coefficients, kcat is the catalytic reaction rate constant and KM = (kcat + k-1)/k1 is the Michaelis-Menten rate constant. The initial and boundary conditions for the above equations are given by  Here s∞ and b∞ is the concentration of substrate and product in the bulk solution. ks and kb is the reaction rate constant for substrate and product respectively. L is the thickness of the polymer film. The current I of the product b at the electrode surface is given by  where jb is the flux of the hydrogen peroxide at the electrode surface. Eqns. (4) and (5) can be written in dimensionless form using the following dimensionless parameters:  Using Eqn. (10), equations (4) and (5) reduce to the following non-dimensional form:  where u(χ,τ) and n(χ,τ) represents the dimensionless concentration of substrate and product respectively; χ is a normalized distance; τ is a dimensionless time; ξ is the ratio of the diffusion coefficient. α, β, and γ are the saturation parameters. φ is the Thiele modulus depends upon the enzyme concentration, diffusion coefficient of substrate DS and the Michaelis-Menten constant KM. The corresponding dimensionless initial and boundary conditions for equations (11) and (12) are as follows:  The dimensionless current for hydrogen peroxide is 
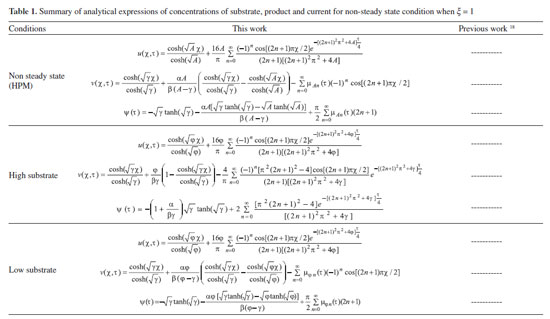
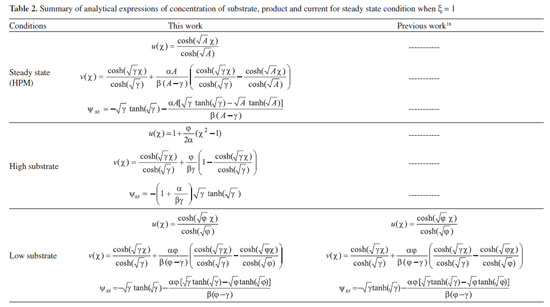
ANALYTICAL EXPRESSIONS FOR THE CONCENTRATION OF SUBSTRATE AND PRODUCT FOR GENERAL CASE UNDER NON STEADY CONDITION Non-linear phenomena play a vital role in various zones of the sciences and engineering. Because of the expanding enthusiasm towards finding exact solutions for those problems, a variety of analytical methods are proposed. Recently Adomian decomposition method,19 homotopy analysis method,20 variational iteration method,21,22 homotopy perturbation method,23-26 are used to solve the non-linear problems. Among such methods, a new approach of homotopy perturbation method is applied to solve the non-linear differential equations Eqns. (11) and (12). The focal point of this method is that it resulted in a simple approximate solution in the zeroth iteration itself.27 This technique is appropriate for problems where transient effects, reaction-diffusion phenomena, and nonlinearity play important roles. The analytical expressions of concentrations of substrate and product can be obtained as follows (Appendix-A):  Using Eqns. (16) and (18), the dimensionless current is given by  where  When τ → ∞, equation (19) becomes  The above equation (Eqn. (22)) represents the new analytical expression of steady state current. Limiting case The consequences for the limiting situations of zero order kinetics (S >> KM) and first order kinetics (S << KM) arising from Eqns. (4) and (5) or (11) and (12) are reported below. Case 1: Saturated (zero order) catalytic kinetics (High substrate) In this case, the situation where the substrate concentration S is greater than the Michaelis-Menten constant KM is considered. When S >> KM or αu >> 1, the non-linear Eqns. (11) and (12) reduces to the following dimensionless linear form:  Solving the above Eqns. (23) and (24), the concentrations of substrate and product can be obtained as follows:  The expression for the current, in this case, is given by  From the above equation, the steady state (τ → ∞) current can be obtained as follows:  Case 2: Unsaturated (first order) catalytic kinetics (Low substrate) The situation where the substrate concentration S is less than the rate constant KM is considered. In this case S << KM or αu << 1, the Eqns. (11) and (12) reduces to the following forms:  The solutions for Eqns. (29) and (30) are given by  The current expression for this case is given by  where  When τ → ∞, equation (33) becomes  The analytical expressions of concentration of substrate, product and current for steady and non-steady state condition when ξ = 1 for all the limiting cases are given in Table 1 and Table 2
NUMERICAL SIMULATION To examine the accuracy of the solution obtained using the HPM method with a finite number of terms, the system of differential equations was solved numerically. Analytical solutions of equations (11) and (12) are challenging problems and can be obtained numerically with the help of Matlab software. The function pdex4 (Euler's method) in Matlab software,28 which is a function for solving boundary value problems is used to solve Eqns. (11) and (12) numerically. Our results are compared with numerical results graphically in Figs. 2 and 3. The comparison confirmed that our obtained analytical results fitted very well with the numerical results. The maximum average relative error between the analytical and numerical results for substrate and product are 1.40% and 0.80%, respectively (Refer to Tables 3 and 4).
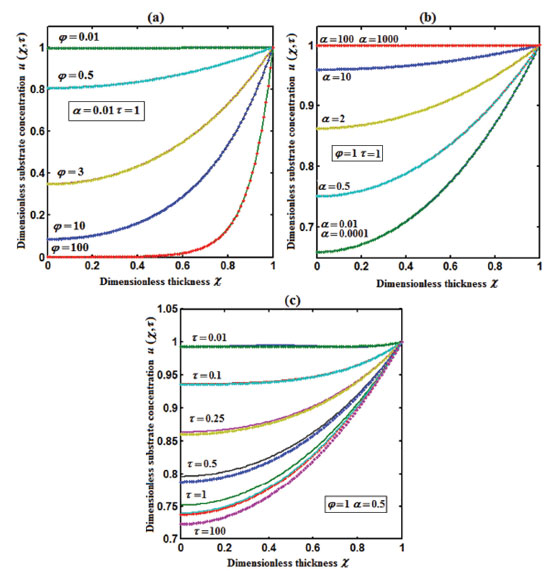 Figure 2. Plot of dimensionless concentration of substrate u(χ,τ) versus dimensionless thickness χ calculated using Eqn. (17) for different values of (a) Thiele modulus φ, (b) saturation parameter α and (c) time τ. The key to the graph: (scattered line) represents the Eq. (17) and (dotted line) represents the numerical simulation.
 Figure 3. Plot of dimensionless concentration of product n(χ,τ) versus dimensionless thickness &3967; calculated using Eqn. (18) for different values of (a) Thiele modulus φ, saturation parameters (b) α, (c) β, (d) γ, (e) diffusion parameter ξ and (f) time τ. The key to the graph: (scattered line) represents the Eq. (18) and (dotted line) represents the numerical simulation.
RESULTS AND DISCUSSION Eqns. (17) to (19) represents the new analytical expressions for the dimensionless concentration of substrate, product and current respectively. Fig. 2 represents the dimensionless concentration of substrate u(χ,τ) versus dimensionless distance from the electrode χ for different values of Thiele modulus φ, saturation parameter α and time τ. Thiele modulus is the ratio of the reaction rate to the rate of diffusion. From Fig. 2(a), it is inferred that the concentration of substrate decreases when Thiele modulus φ increases. When Thiele modulus φ < 0.1, the diffusion resistance is insufficient to limit the rate of reaction and the concentration remains the same within the film. The concentration of substrate reaches zero inside the enzyme layer when the diffusion modulus i.e. Thiele module φ ≥ 100 which is observed at high film thickness L or enzymatic rate kcateT or for low reaction rate constant KM or diffusion Ds. This is because when φ is large, a significant diffusion modulus prevents a constant concentration of substrate within the film and thus lowers the concentration. The influence of the saturation parameter α can be analyzed from Fig. 2(b), where it is shown that the concentration of substrate increases when the saturation parameter α increases. This is because as the initial substrate concentration s∞ increases obviously the concentration of substrate s increases. From Fig. 2(c), it is evident that the substrate concentration increases when time τ decreases. For τ ≤ 0.01, the concentration remains the same. The change in product concentration with respect to dimensionless distance from the electrode for various values of parameters is shown in Figs. 3(a) - (f) respectively. Fig. 3(a) illustrates that for high catalytic activity, the concentration of substrate increases. By increasing the initial concentration of substrate α or high catalytic activity, the product concentration increases as shown in Figs. 3(a) and 3(b). From Figs. 3(c) and 3(d), it is observed that, the concentration of product increases when the saturation parameters β and γ decreases. Compared to other parameters, time τ has less influence over product concentration. Higher product concentration is obtained for steady- state time. Differential sensitive analysis of kinetic parameters Eqn. (19) represents the new approximate analytical expression for the non-steady state current ψ in terms of the parameters α, β, γ, φ and ξ. By differentiating the current partially with respect to these parameters, the impact of the parameters over current can be determined.29 The percentages of change in current with respect to γ, β, φ, ξ and α are 46%, 35%, 14%, 3% and 2%, respectively. From this, it is evident that parameters γ and β have more impact on current. These parameters are highly sensitive parameters. This implies that when the thickness of the film L or the concentration of product in the bulk b∞ increases, the current increases. The parameter φ is called as moderately sensitive parameter as it has 14% of influence over current. The remaining two parameters ξ (ratio of diffusion coefficient) and α (saturation parameter) are less sensitive. The spread sheet analysis of these results is described in Figure. 4. These results are also confirmed in Figures 5, 6(a) - 6(e).
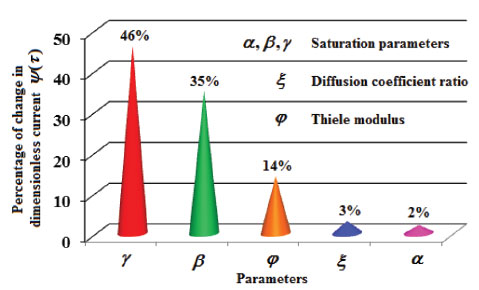 Figure 4. Sensitive analysis of parameters: Percentage change in current.
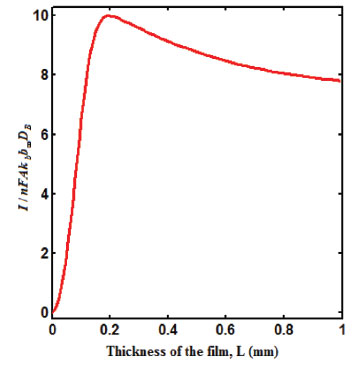 Figure 5. Plot of steady state current versus thickness of the film L.
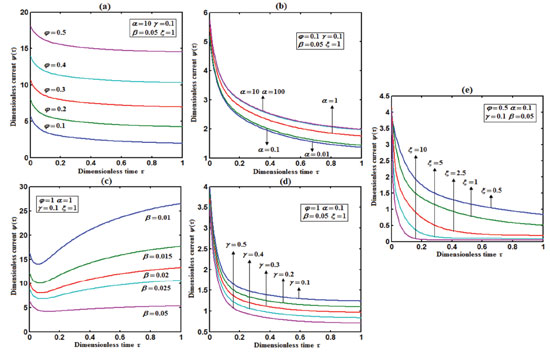 Figure 6. Plot of dimensionless current ψ(τ) versus dimensionless time τ calculated using Eqn. (19) for different values of (a) Thiele modulus φ, saturation parameters (b) α, (c) β, (d) γ, and (e) diffusion parameter ξ.
From Fig. 5, it is observed that the current initially increases with thickness and then decreases. After L ≥ 2 mm, the current reaches the steady state value. An interesting as well as important fact can be concluded from Figs. 6(a) - 6(e) regarding the influence of the kinetic parameters over current ψ(τ) along time τ. The current considerably depends on either the enzymatic rate within the film or the electron transport outside the film. From Fig. 6(a), it is confirmed that the current increases when the Thiele module φ increases. With increased initial concentration of substrate in bulk solution S∞, the corresponding current increases. This result is confirmed by Fig. 6(b). The influence of the saturation parameters β and γ on the current was shown in Figs. 6(c) and 6(d). Both parameters are inversely proportional to the current. Compared to γ, β shows much deviation over current. From Fig. 6(e), it was found that the sharp decrease in the current with the increase of the ratio of diffusion coefficient ξ. And when ξ is small, the current decreases slowly. From this figure, it is observed that for high current, the diffusion coefficient of product should be less than the diffusion coefficient of substrate i. e. DS < DP. Estimation of kinetic parameters k, kcateT and KM Numerous enzyme kinetics papers are dedicated for estimating the kinetics parameters and distinguishing between reaction mechanisms. 29-31 Pseudo first order constant k, helps us to quantify the rate of the chemical reaction. The Michaelis-Menten rate constant KM, determines the relationship between the steady-state concentrations rather the equilibrium concentrations. The maximum velocity of the enzyme depends upon the catalytic rate constant kcat and the total enzyme concentration eT. The parameter kcat is a very useful parameter that is employed for the breakdown of the enzyme substrate complex ES to product P when the enzyme is fully saturated with substrate. These kinetic parameters can be obtained from our analytical expression of current (Eqn. (28)). For small value of γ/ξ,  Using Eqn. (10), the above equation can be rearranged as  As in Fig. 7(a), plot of I/nFAκbb∞L versus 1/κbb∞ gives the slope = k, intercept = kcateT. When the diffusion coefficient of substrate and product are equal i.e. ξ = 1, and γ is small, the current (Eqn. 22) becomes  By substituting the value of ψss, γ, α, β and φ from the Eqn. (10) and k, kcateT from Eqn. (37), the parameter KM can be obtained. Hence, we can obtain pseudo first order rate constant k, enzymatic rate kcateT and Michaelis-Menten rate constant KM from Eqns. (22) and (28).
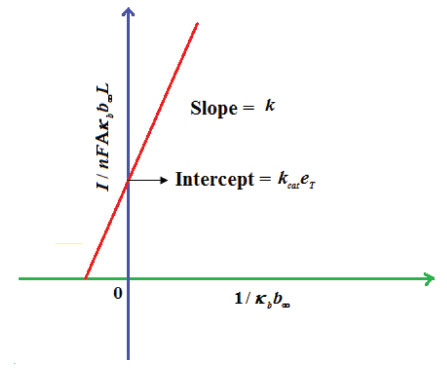 Figure 7. Estimation of kinetic parameter: pseudo first order rate constant k and enzymatic rate kcateT using Eqn. (37).
CONCLUSIONS A simple mathematical analysis of reaction and diffusion of glucose and hydrogen peroxide within the conducting film containing metal microparticles have been presented. Using a new approach to the Homotopy perturbation method, an approximate analytical expressions for the concentrations of substrate and product are obtained. Approximate analytical expressions for the steady and non-steady state current response produced during the reduction of H2O2 to water at the electrode surface are derived. The differential sensitive analysis for the steady-state current response for the controllable parameters: the thickness of the film, bulk substrate, and product concentration and enzymatic rate are analyzed. Also, the estimation of kinetic parameters is reported graphically.
SUPPLEMENTARY MATERIAL The supplementary data associated with this article are available on http://quimicanova.sbq.org.br in the form of a PDF file, with free access.
ACKNOWLEDGMENTS This work was supported by the Department of Science and Technology, SERB-DST (EMR/2015/002279) Government of India. The Authors are also thankful to Chancellor and Vice-Chancellor of the Academy of Maritime Education and Training (AMET), Deemed to be University, Chennai, India for their support and constant encouragement.
REFERENCES 1. Palanisamy, S.; Cheemalapati, S.; Chen, S.M.; Int. J. Electrochem. Sci. 2012, 7, 8394. 2. Toghill, K. E .; Compton, RG.; Int. J. Electrochem. Sci. 2010, 5, 1246. 3. Bankar, S. B.; Bule, M. V.; Singhal, R. S.; Ananthanarayan, L.; Biotechnol. Adv. 2009, 27, 489. 4. Pizzariello, A.; Stred'ansky, M.; Miertus, S.; Bioelectrochemistry. 2002, 56, 99. 5. Choudhury, N. A.; Raman, R. K.; Sampath, S.; Shukla, A. K.; J. Power Sources 2005, 143, 1. 6. Bessette, R. R.; Medeiros, M.G.; Patrissi, C.J.; Deschenes, C. M.; LaFratta, C. N.; J. Power Sources 2001, 96, 240. 7. Yamanaka I.; Onizawa T.; Takenaka S.; Otsuka K.; Angew. Chem. Int. Ed. 2003, 42, 3653. 8. Yang, W.; Yang, S.; Sun, W.; Sun, G.; Xin, Q.; Electrochim. Acta 2006, 52, 9. 9. Han, L.; Guo, S.; Wang, P.; Dong, S.; Adv. Energy Mater 2014, 5, 1400424. 10. Kjeang, E.; Brolo, A. G.; Harrington, D.A.; Djilali, N.; Sinton, D .; Journal of Electrochemical Society 2007, 154, B1220. 11. Adams, B. D.; Ostrom, C. K.; Chen, A.; Journal of Electrochemical Society 2011, 1588, B434. 12. Do, T. Q. N.; Varničić, M.; Hanke-Rauschenbach, R.; Vidaković-Koch, T.; Sundmacher, K.; Electrochim. Acta. 2014, 137, 616. 13. Benfeitas, R.; Selvaggio, G.; Antunes, F.; Coelho, P. M. B. M.; Salvador, A.; Free Radical Biology and Medicine, 2014, 74, 35. 14. Agnès, C.; Reuillard, B.; Le Goff, A.; Holzinger, M.; Cosnier, S.; Electrochem. Commun. 2013, 34, 105. 15. An, L.; Zhao, T. S.; Zeng, L.; Yan, X. H.; Int. J. Hydrog. Energy. 2014, 39, 2320. 16. An, L.; Zhao, T. S .; Chai, Z. H.; Zeng, L.; Tan, P.; Int. J. Hydrog. Energy. 2014, 39, 7407. 17. Somasundrum, M.; Tongta, A.; Tanticharoen, M.; Kirtikara, K.; J. Electroanal. Chem. 1997, 440, 259. 18. Ongun, M.Y.; Math Comput Model: An International Journal, 2011, 53, 597. 19. Rasi, M.; Indira, K.; Rajendran, L.; J. Chem. Kinet. 2013, 45, 322. 20. Wazwaz, A.M.; Cent. Eur. J. Eng. 2014, 4, 64. 21. Meena, A.; Rajendran, L.; Chem. Eng. Technol. 2010, 33, 1999. 22. Saravanakumar, R.; Pirabaharan, P.; Swaminathan, R.; International Journal of Research, 2018, 7, 342. 23. Wu, Y.; He, J. H.; Results Phys. 2018, 10, 270. 24. Rajendran, L.; Anitha, S.; Electrochim. Acta 2013, 102, 474. 25. Swaminathan, R.; Lakshmi Narayanan, K.; Mohan, V.; Saranya, K.; Rajendran, L.; Int. J. Electrochem. Sci. 2019, 14, 3777. 26. Preethi, K. P. V; Chitra Devi, M.; Swaminathan R.; Poovazhaki, R.; Int. J. Math. and Appl. 2018, 6, 359. 27. Skeel, R. D.; Berzins, M.; SIAM J. Sci. Comput. 1990, 11, 1. 28. Rasi, M.; Rajendran, L.; Subbiah, A.; Sensor Actuat B-Chem. 2015, 208, 128. 29. Rao, D.N.; Resonance, 1998, 3, 38. 30. Sorouraddin, M.H.; Amini, K.; Naseri, A.; Vallipour, J.; Hanaee, J.; Rashidi, M.R.; J. Biosci. 2010, 35, 395. 31. Schnell, S.; Maini, P. K.; Comments on Theoretical Biology, 2003, 8, 169. |
On-line version ISSN 1678-7064 Printed version ISSN 0100-4042
Qu�mica Nova
Publica��es da Sociedade Brasileira de Qu�mica
Caixa Postal: 26037
05513-970 S�o Paulo - SP
Tel/Fax: +55.11.3032.2299/+55.11.3814.3602
Free access




 and hence Eqn. (28) reduces to the following form: