Artigo
| Evaluation of the metabolic production of the endophytic fungus Phomopsis sp |
|
Jéssica R. da RochaI,*,, Alessandre C. CrispimI, João M. da SilvaII, Antônio E. G. SantanaII and Luiz C. CaetanoI
I. Instituto de Química e Biotecnologia, Universidade Federal de Alagoas, 57072-900 Maceió - AL, Brasil II. Centro de Ciências Agrárias, Universidade Federal de Alagoas, 57100-000 Rio Largo - AL, Brasil Recebido em 08/10/2019 *e-mail: jessica.rocha@iqb.ufal.br Endophytic microorganisms have been shown to be an important source of bioactive compounds, and much has been studied about their metabolites. For example, compounds with different biological activities have been isolated from Phomopsis sp. The metabolic study of this genus may lead to a better understanding of the routes of production of metabolites of interest. The aim of this study was to map the metabolic profile of Phomopsis sp., isolated as an endophyte of Syzygium jambolanum DC, using culture filtrate. The fungus was cultivated for six weeks in potato dextrose medium under hypoxia and at room temperature. The filtrate was collected weekly, and the analyses were performed using proton nuclear magnetic resonance (1H NMR) spectroscopy by applying NOESY1D with suppression of the water signal. The occurrence of reductive routes was verified: alcoholic fermentation throughout cultivation and reductive tricarboxylic acid cycle in the cytosol until the third week of cultivation were observed. INTRODUCTION Endophytic microorganisms are present in the inner tissues of plants and coexist in a symbiotic relationship with their hosts without causing damage.1 On the other hand, endophytes may also behave as pathogens after some kind of external disturbance that, in some way, negatively affects the host. For example, a study of antioxidant activity was carried out in soybean seeds in which compared to seeds infected with Phomopsis longicolla and Cercospora kikuchii, healthy seeds had a better antioxidant capacity against DPPH (2,2-diphenyl-1-picrylhydrazyl) and ABTS (2,2'-azino-bis(3-ethylbenzothiazoline-6-sulfonic acid)) radicals as well as a higher amount of isoflavones.2 Endophytic communities are composed of fungi and bacteria found in a variety of hosts, and it is estimated that many have not yet been identified. Despite their abundance, the relationship between these organisms and their hosts is not yet fully understood. However, many of these endophytes have been applied in agriculture since evidence suggests that they can protect their hosts against pests and pathogenic microorganisms and produce compounds with therapeutic application, such as Taxol and leucinostatin.3-7 In general, the most studied endophytes are those isolated from medicinal plants due to their possible symbiotic relationships. Yadav et al. verified antioxidant activity in extracts of an endophytic fungus isolated from Eugenia jambolana Lam.8 Volatile compounds with antibacterial activity were identified in an endophyte associated with Costus spiralis (Jacq) Roscoe (Costaceae), a plant traditionally used in the treatment of renal diseases.9 In some cases, the endophyte produces the same compound that is synthesized by the host plant, which makes the endophyte one of the main sources of bioactive compounds, and it is often more advantageous to manipulate these microorganisms in the laboratory instead of the plants, which require cultivation and have management costs. To obtain 3 g of vincristine, for example, 3 kg of dried leaves of Catharanthus roseus G. Don are needed. In addition, there are cases in which the yield obtained via endophytic production is greater than that of the plant.10,11 The fungus Phomopsis sp. has been reported as an endophyte of a variety of plants, including cocoa (Theobroma cacao L.) and others of spontaneous growth and medicinal use, such as Turnera subulata L.12,13 In addition, the biological activities associated with this fungus cover a variety of functionalities, such as antiviral activity against tobacco mosaic virus (TMV), production of mycotoxins with amphiphilic potential against phytopathogenic fungi and antibacterial activity against pathogens and phytopathogens.13-16 Some of the bioactive compounds produced by Phomopsis sp. isolated from medicinal plants include phomoenamide, with moderate antibacterial activity against Mycobacterium tuberculosis H37Ra;17 benquoine, with antimicrobial activity against gram-positive bacteria and cytotoxicity against the cancer strain HCT-116;18 mycoepoxidiene, deacetylmethylepoxidiene, phomoxydiene A, phomoxene C and cytosporone E, with antimalarial activity against Plasmodium falciparum K1 and cytotoxic activity against Vero, KB, MCF-7 and NCI-H187 cells; cytosporone P, with antimalarial activity;19 1,5-dihydroxy-3-hydroxyethyl-6-methoxycarbonylxanthone, with cytotoxic activity against A549 and MCF7 tumour cell lines; 1-hydroxy-3-hydroxyethyl-8-ethoxycarbonylxanthone, with cytotoxic activity against the A549 tumour cell line;20 and phomoxanthone F, with weak anti-HIV activity.21 In addition to these biological activities, Phomopsis sp. is associated with the ability to degrade plant and soil contaminants, such as phenanthrene.22 Given the diversity of applications of the compounds produced by this endophyte, the investigation of the metabolic routes of these compounds contributes to a better understanding of their production, allowing determination of how much, when and what is produced and then enabling production of these metabolites on a large scale. Nuclear magnetic resonance (NMR) techniques have proven to be an important ally in this type of study and have been supported by chromatography and mass spectrometry.23,24 This work aimed to identify, through NMR experiments, the metabolites present in the culture filtrate (CF) of Phomopsis sp. and to evaluate their production during six weeks of cultivation.
EXPERIMENTAL Biological material The endophytic fungus Phomopsis sp. was previously isolated from the stem bark of Syzygium jambolanum, a plant located at 9°33'18.2"S, 35°46'40.9"W.25 Preparation of culture media Potato dextrose agar culture medium (PDA) Potato dextrose (20 g) and agar-agar type I (17 g) were dissolved in 1 L of distilled water. The mixture was autoclaved at 121 °C for 17 minutes and then dispensed into previously sterilized petri dishes. Potato dextrose culture medium (PD) A methodology similar to the preparation of PDA was followed, excluding agar-agar type I; 250 mL Erlenmeyer flasks containing 100 mL of culture medium (CM) were used and autoclaved at 121 °C for 20 minutes. Evaluation of metabolic production in the filtered culture of Phomopsis sp. Cultivation The microorganism was initially cultured on PDA for seven days. After this period, inoculation was performed in 40 Erlenmeyer flasks containing PD media previously prepared. The fungus was cultured for eight weeks, with the vials sealed, in the absence of light and without agitation. Sample collection Aliquots of 1.5 mL were collected weekly from five flasks containing the culture and then refrigerated. This procedure was performed in a sterile horizontal laminar flow chamber. From the collected flasks, the mycelium was separated by simple filtration and dehydrated in an oven at 50 °C for seven days for later weighing. The net fraction was discarded. Mycelial growth The mycelial growth rate was determined by the average of the five samples collected separately each week, totalling 30 samples. The growth curve was constructed using the dry weight of the mycelium. Sample preparation A sodium phosphate buffer solution (0.1 mol L-1; pH = 7.4) was prepared, and trimethylsilylpropanoic acid (TSP) (1 mmol L-1) was added. In each NMR tube, 350 μL of the CF, 350 μL of the buffer solution and 50 μL of D2O were added. NMR analysis The experiments were performed at 25 °C by applying NOESY1D (pulse sequence of noesygppr1d) to suppress the water signal on a Bruker AvanceUltra Shield 400 spectrometer operating at 9.4 T, observing 1H at 400.12 MHz. The spectrometer was equipped with a 5 mm BBI probe. The parameters were as follows: 64 scans with an acquisition time of 6.29 s, 64 k time domain points distributed in a spectral width of 13.01 ppm and a recycle delay of 6 s. Spectrum analysis The spectra were processed with TopSpin® 3.5 software using 64 k time domain points. The databases used to identify the metabolites were HMDB (The Human Metabolome Database) and Chenomx NMR Suite. Statistical NMR data analysis Multivariate statistical analysis was performed using MATLAB® software using a tool developed by Dr. K. Veselkov of Imperial College London. The spectra were first grouped and then aligned and finally normalized.
RESULTS AND DISCUSSION Cultivation and evaluation of mycelial growth After seven days of culture on PDA, Phomopsis sp. presented slight yellowish pigmentation. During the cultivation in PD, the intensification of the yellow colour was observed until the eighth week, in which it presented brownish pigmentation. According to the mycelial growth curve (Figure 1), the endophyte showed marked growth from the first to the second week and continued to grow until the fourth week. From the fourth week, there was no significant variation in the mycelial mass. In this phase, characterized as a stabilization phase, the accumulation of secondary metabolites may occur.26
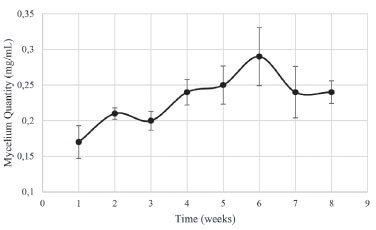 Figure 1. Mycelial growth curve of Phomopsis sp. during eight weeks of culture
Metabolic evolution of the CF To identify the metabolites of the CF of Phomopsis sp., suppression of the water signal by NOESY1D was required. According to the CM spectra, signals attributed to α- and β-dextrose at 5.24 and 4.65 ppm, respectively, were detected in addition to acetoin (1.37 ppm, d, J = 7.15 Hz, CH3; 2.21 ppm, s, CH3; 4.42 ppm, q, CH), asparagine (2.84 ppm, m, CH'; 2.94 ppm, m, CH"; 4.00 ppm, dd, J = 7.69 and 4.26 Hz, CH), citrate (2.53 ppm, d, J = 15.88, Ha; 2.66 ppm, d, J = 15.88, Hb), succinate (2.40 ppm, s, CH2), pyruvate (2.46 ppm, s, CH3) (Figure 3), acetate, (1.92 ppm, s, CH3), ethanol (1.18 ppm, t, J = 7.00, CH3; 3.66 ppm, q, J = 7.00, CH2), oxaloacetate (2.38 ppm, s, CH2), pyroglutamate (2.02 ppm, m, CH'; 2.39 ppm, m, CH2; 2.50 ppm, m, CH"; 4.17 ppm, dd, J = 9.02 and 5.83 Hz, CH), tyrosine (6.90 ppm, dt, J = 2.14, 2.85, 8.56, CH; 7.20 ppm, dt, J = 2.04, 3.10, 8.56, CH), fumarate (6.53 ppm, s, CH) and methanol (3.36 ppm, s, CH3). The signals detected do not include those of protons of amine and hydroxyl groups present in the structures of these metabolites. This is an expected fact since in the presence of D2O, there is spontaneous hydrogen-deuterium exchange.27
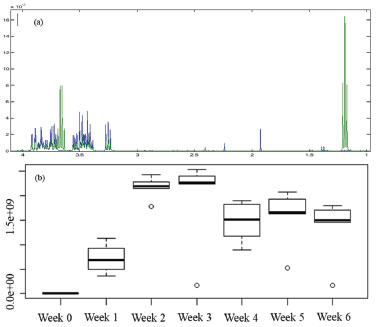 Figure 2. Overlapping of the 1H NMR spectra of CM (in blue) and CF1 (in green) (a); relative quantification of ethanol (b)
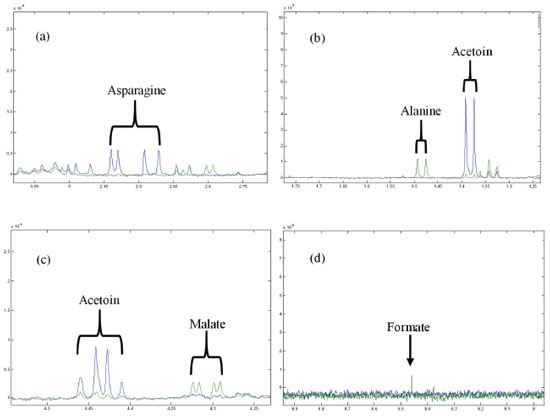 Figure 3. Overlapping of the 1H NMR spectra of the CM (in blue) and the culture CF1 (in green): (a) asparagine signals; (b) signs referring to alanine and acetoin; (c) malate and acetoin signals; (d) signal relating to formate
All chemical shifts and coupling constants were assigned based on the HMDB and Chenomx databases. These assignments were supported by the literature as well.28-35 According to the CF spectra from the first to the sixth week of culture, variations in the signal intensities of the metabolites were present. The quantitative variations in these compounds were observed through analysis of variance (ANOVA) performed using a tool in MATLAB® software. A significant increase in the intensity of the ethanol signals (Figure 2a) was observed, indicating the occurrence of fermentation. The ethanol increase was quantified relative to the TSP based on the 1.18 ppm (t) peak area and represented by the boxplot (Figure 2b); these measurements were performed with R software. In addition, the presence of some metabolites that were not detected in CM was observed from the first week of culture (CF1): alanine (1.48 ppm, d, J = 7.20 Hz, CH; 3.76 ppm, q, J = 7.20 Hz, CH), malate (2.36 ppm, dd, J = 15.38 and 10.12 Hz, CH'; 2.66 ppm, dd, J = 15.38 and 2.90 Hz, CH"; 4.29 ppm, dd, J = 10.12 and 2.80 Hz, CH), formate (8.46 ppm, s, CH) and formaldehyde (9.68 ppm, s, CH2). On the other hand, asparagine, detected in CM, was no longer observed in CF1, indicating that the microorganism metabolized it. Figure 3 shows the intensity variations between CM and CF1. The yellow pigmentation was considerably elevated from the third to the fourth week of cultivation and intensified until the end of the cultivation period. From the fourth week of culture, the quantitative mycelial mass did not present significant development (Figure 1). Considering the spectra of the samples during the six weeks of culture, it was observed that most of the metabolites could not be detected or presented no observable variation from the fourth week. A minority of metabolites could be visibly monitored through the fifth and sixth weeks. Since all the metabolites identified in the CF were primary, it was inferred that from this period (fourth week), secondary metabolism begins using the primary metabolites present for the production of secondary metabolites. Since the sample was very dilute, the intensity of the signals of secondary metabolites whose production was beginning was low, making detection difficult. Table 1 indicates these metabolic variations throughout the culture. The classification of the metabolites arranged in the table was made based on the KEGG PATHWAY database available at http://www.genome.jp/.36
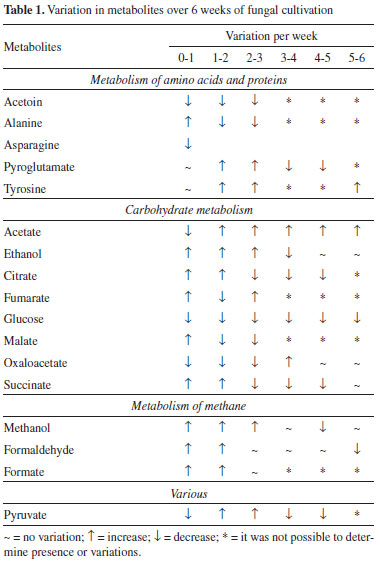
Variations in the metabolites belonging to the tricarboxylic acid (TCA) cycle were observed through ANOVA performed using a tool in MATLAB® software (supplementary material). The occurrence of the reductive TCA cycle is evident until the third week of culture.23,37 Evans et al. first described this route of reductive assimilation of CO2 by a photosynthetic bacterium.38 In the present case, non-detection of metabolites such as α-ketoglutarate and isocitrate also confirms that the reductive route is occurring. From week 0, CM, until the first week, it was possible to observe a decrease in the quantity of oxaloacetate, while the amounts of malate, fumarate and succinate increased. In the following week, in addition to the decrease in the oxaloacetate content, a decrease in the malate and fumarate contents and a consequent increase in the succinate content were observed. From the second to the third week, the oxaloacetate content began to decrease, and the malate content also followed this trend and decreased; however, although the fumarate content had a small increase, it did not present such significant variation. Consequently, there was a decrease in the succinate content, indicating that the metabolites that would lead to its production began to participate more in other routes. From the third to the fourth week, the oxaloacetate content began to rise, but this time, it did not follow the malate content; oxaloacetate was no longer observed from this point, and the fumarate that would provide it was not observed. In this way, the succinate content continued to decay, as this route had been interrupted. Thus, it is concluded that from the interruption of the reductive TCA cycle, from the third to the fourth week, the production routes of secondary metabolites begin to be established. In fact, it is in this period that yellow pigmentation intensifies. In an anaerobic system, the production of organic compounds can be expected from CO2, so this type of system favours reductive routes.39 In this context, by monitoring the metabolic behaviour of Phomopsis sp., it was possible to observe alcoholic fermentation occurrence as well as the evolution of ethanol production up to the sixth week of cultivation (Figure 2). Notably, methanol was monitored until the sixth week of analysis. Its quantity increased until the third week and was maintained until the fourth week, followed by a decrease in the fifth week that was maintained until the last week of cultivation. Both formaldehyde and formate showed increasing quantities until the second week; the latter remained until the third week and could no longer be visualized after that point. On the other hand, the quantity of formaldehyde, which could be monitored until the end, also did not change from the second week, but at the fifth week, it decreased. Statistical total correlation spectroscopy (STOCSY) showed that these three metabolites belong to the same route (Figure 4); the oxidation of methanol leads to formaldehyde and then to the formation of CO2.40 However, there was a limited oxygenation environment (hypoxia), and CO2 came from the fermentation that occurred throughout the growing period. In fact, there was a tendency for methanol to remain present, while the formate could no longer be observed. The formaldehyde content decreased in the last week, and the methanol content also decreased a week before; however, methanol was present in the last week, indicating that its production was occurring through the reduction of CO2.
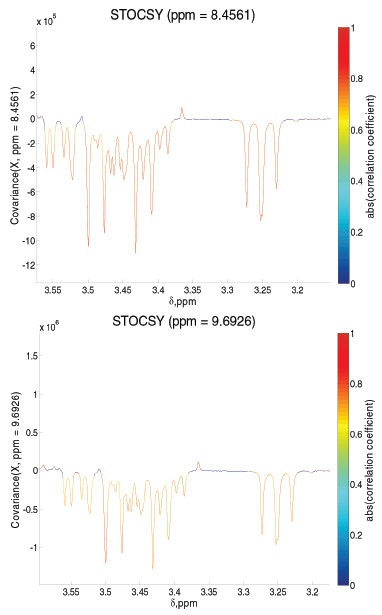 Figure 4. Formate and formaldehyde showed a strong positive correlation and positive covariance with methanol (from the first to the second week)
CONCLUSION The identified metabolites of the CF of Phomopsis sp. were all from primary metabolism. It is not possible to observe the presence and/or variation in these metabolites from the fourth week of culture when the yellow pigmentation of the fungus intensifies. It was inferred that during this period, secondary metabolism advances. This Phomopsis sp. NMR metabolomic study performed under the presented conditions showed the occurrence of the reductive TCA cycle and alcoholic fermentation occurring in CF.
SUPPLEMENTARY MATERIAL ANOVA images produced using MATLAB® software that verify the variations listed in Table 1 of the metabolites belonging to the TCA cycle are available at http://quimicanova.sbq.org.br in PDF file format with free access.
ACKNOWLEDGMENT Coordenação de Aperfeiçoamento de Pessoal de Nível Superior (CAPES) for the scholarship provided.
REFERENCES 1. Azevedo, J. L.; Maccheroni Jr., W.; Pereira, J. O.; Araújo, W. L.; Electron. J. Biotechnol. 2000, 3, 1. 2. Lee, J. H.; Hwang, S. R.; Lee, Y. H.; Kim, K.; Cho, K. M.; Lee, Y. B.; Food Chem. 2015, 185, 205. 3. Stierle, A.; Strobel, G.; Stierle, D.; Science 1993, 260, 5105. 4. Strobel, G.; Hess, W. M.; Chem. Biol. (Oxford, U. K.) 1997, 4, 7. 5. Santos, T. T.; Varavallo, M. A.; UNOPAR Científica Ciências Biológicas e da Saúde 2011, 32, 2. 6. Silva, J. M.; Teixeira, R. R. O.; da Rocha, J. R.; dos Santos, T. M. C.; International Journal of Agriculture, Environment and Bioresearch 2017, 2, 1. 7. Yan, J. F.; Broughton, S. J.; Yang , S. L.; Gange, A. C.; Fungal Ecology 2015, 13. 8. Yadav, M.; Yadav, A.; Yadav, J. P.; Asian Pac. J. Trop. Med. 2014, 7, 1. 9. Soares, D. A.; Ascencio, P. G. M.; Leão, G. M. A.; Rodrigues, K. M. T. M.; Pimenta, R. S.; Journal of Bioenergy and Food Science 2015, 2, 4. 10. Bruneton, J.; Farmacognosia: fitoquimica, plantas medicinales, 2nd ed., Acribia S.A.: Zaragoza, 2001. 11. Mussi-Dias, V.; Araújo, A. C. O.; Silveira, S. F.; Rocabado, J. M. A.; Araújo, K. L.; Braz. J. Med. Plants 2012, 14, 2. 12. Rubini, M. R.; Silva-Ribeiro, R. T.; Pomella, A. W. V.; Maki, C. S.; Araújo, W. L.; dos Santos, D. R.; Int. J. Biol. Sci. 2005, 1, 1. 13. Santos, G. B. L.; Caetano, L. C.; Nascimento, A. R. S.; Ramos Sobrinho, R.; Silva, R. M. S., da Silva, J. M.; dos Santos, T. M. C.; Afr. J. Microbiol. Res. 2017, 11, 17. 14. Chapla, V. M.; Biasetto, C. R.; Araujo, A. R.; Rev. Virtual Quim. 2013, 5, 3. 15. Jouda, J.; Tamoku, J.; Mbazoa, C. D.; Douala-Meli, C.; Sarkar, P.; Bag, P. K.; Bag, P. K.; Wandji, J.; BMC Complementary Altern. Med. 2016, 16, 1. 16. Tan, Q.; Famg, P.; Ni, J.; Gao, F.; Chen, Q.; Molecules 2017, 22, 12. 17. Rukachaisirikul, V.; Sommart, U.; Phongpaichit, S.; Sakayaroj, J.; Kirtikara, K.; Phytochemistry 2008, 69, 3. 18. Adelin, E.; Servy, C.; Cortial, S.; Lévaique, H.; Martin, M. T.; Retailleau, P.; Le Goff, G.; Bussaban, B.; Lumyong, S.; Ouazzani, J.; Phytochemistry 2011, 72, 18. 19. Kornsakulkarn, J.; Somyong, W.; Supothina, S.; Boonyuen, N.; Thongpanchang, C.; Tetrahedron 2015, 71, 48. 20. Yang, H. Y.; Gao, Y. H.; Niu, D. Y.; Yang, L. Y.; Gao, X. M.; Du, G.; Hu, Q. F.; Fitoterapia 2013, 91. 21. Hu, H. B.; Hu, H. B.; Luo, Y. F.; Wang, P.; Wang, W. J.; Wu, J. Fitoterapia 2018, 131. 22. Fu, W.; Fu, W.; Xu, M.; Sun, K.; Hu, L.; Cao, W.; Dai, C.; Jia, Y.; Chemosphere 2018, 203. 23. Lindon, J. C.; Nicholson, J. K.; Holmes, E.; The handbook of metabonomics and metabolomics, Elsevier: Amsterdam, 2007. 24. Baynes, J. W.; Dominiczak, M. H.; Bioquímica médica, 4th ed., Elsevier: Rio de Janeiro, 2015. 25. Lima, S. M. S.; Monography, Universidade Federal de Alagoas, Brasil, 2010. 26. Nogueira, R. C.; Paiva, R.; Lima, E. C.; Soares, G. A.; Oliveira, L. M.; Santos, B. R.; Emrich, E. B.; Castro, A. H. F.; Rev. Bras. Plant. Med. 2008, 10, 1. 27. Pavia, D. L.; Lampman, G.; Kriz, G.; Vyvyan, J.; Introdução à espectroscopia, 2nd ed., Cengage Learning: São Paulo, 2015. 28. Pomin, V. H. Em Glycosylation; Petrescu, S., ed.; InTech: London, 2012, cap. 4. 29. Capozzi, F.; Laghi, L.; Belton, P. S.; Magnetic Resonance in Food Science: Defining Food by Magnetic Resonance, Royal Society of Chemistry: London, 2015. 30. Anet, F. A. L.; Park, J.; J. Am. Chem. Soc. 1992, 114, 4. 31. Somashekar, B. S.; Gowda, G. A. N.; Ramesha, A. R.; Khetrapal, C. L.; Magn. Reson. Chem. 2004, 42, 636. 32. Govindaraju, V.; Young, K.; Maudsley, A. A.; NMR Biomed. 2000, 13, 129. 33. Hinterholzer, A.; Stanojlovic, V.; Cabrele, C.; Schubert, M.; Anal. Chem. 2019, 91, 14299. 34. Corlett, E. K.; Blade, H.; Hughes, L. P.; Sidebottom, P. J.; Walker, D.; Walton, R. I.; Brown, S. P.; CrystEngComm 2019, 21, 3502. 35. Gottlieb, H. E.; Kotlyar, V.; Nudelman, A.; J. Org. Chem. 1997, 62, 7512. 36. http://www.genome.jp/, accessed in February 2020. 37. Vuoristo, K. S.; Mars, A. E.; Sanders, J. P. M.; Eggink, G.; Weusthuis, R. A.; Trends Biotechnol. 2016, 34, 3. 38. Evans, M. C.; Buchanan, B. B.; Arnon, D. I.; Proceedings of the national academy of sciences of USA 1966, 55, 4. 39. Nelson, D. L.; Cox, M. M.; Princípios de bioquímica de Lehninger, 6th ed., Artmed: Porto Alegre, 2014. 40. Cloarec, O.; Dumas, M. E.; Craig, A.; Barton, R. H.; Trygg, J.; Hudson, J.; Blancher, C.; Gauguier, D.; Lindon, J. C.; Holmes, E.; Nicholson, J.; Anal. Chem. 2005, 77, 5. |
On-line version ISSN 1678-7064 Printed version ISSN 0100-4042
Qu�mica Nova
Publica��es da Sociedade Brasileira de Qu�mica
Caixa Postal: 26037
05513-970 S�o Paulo - SP
Tel/Fax: +55.11.3032.2299/+55.11.3814.3602
Free access


