Artigo
| Laboratory investigation of x-ray photolysis of methanol ice and its implication on astrophysical environments |
|
Fabricio M. FreitasI,*; Sérgio PillingI,II
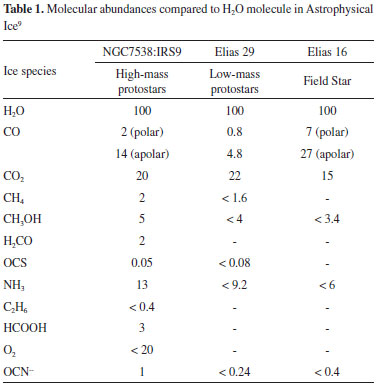
I. Instituto de Pesquisa e Desenvolvimento, Universidade do Vale do Paraíba, 12244-000 São José dos Campos - SP, Brasil Recebido em 21/08/2019 *e-mail: fmfreitas@gmail.com Methanol (CH3OH) is one of the most abundant organic molecules in astrophysical environments. It has been found in cold regions such as surfaces of comets, ices near young stellar objects and protoplanetary disks, as well as in the gas phase in different regions in space. In this work, we experimentally simulate the methanol ice and its behavior when irradiated by broadband soft X-rays. The experiments were performed at the Brazilian Synchrotron Facility LNLS/CNPEM, employing a broadband photon beam (6 to 2000 eV). The frozen sample was analyzed in situ by infrared spectroscopy (IR) in simulated astrophysical at different radiation fluences. The results show the formation of several new species such as CO2, CO, H2O and CH4 during the photolysis CH3OH ice by soft X-rays. We determined effective destruction and formation cross-section, as well as the chemical equilibrium fluence (FE) and desorption yields. The timescale to reach chemical equilibrium in some astrophysical environments with soft X-rays were estimated. The result helps us to understand the photolysis induced by X-rays in organic-rich ices in space environments. INTRODUCTION Astrochemistry is a relatively new area at the interface between Astronomy, Physics, and Chemistry, focusing on the study of the formation, destruction, and molecules abundances in diverse environments such as molecular clouds, star birth regions, planetary nebulae, protoplanetary discs, planetary atmospheres, comets, etc. One of the exciting topics addressed by Astrochemistry is the study of prebiotic organic chemistry to understand the origin of life on Earth. Depending on the physicochemical conditions of the environment, the molecules may be in the gas phase or may be condensed on the surface of interstellar dust grains, comets, etc.1 This molecule (CH3OH) chosen because it aroused astrochemical interest due to its considerable abundance in protostellar environments, in interstellar clouds as well as comet.2-4 In the case of interstellar ice, the presence of methanol, in the solid phase, is observed at a ranging from 1% to about 30%.5-7 Its first detection occurred with NRAO radio telescope in the frequency band of 834 MHz towards the center of the Galaxy, precisely in Sagittarius B2.8 It is possible to obtain the abundance of several molecules, including methanol, in ice studied in three different star objects: High-mass protostars, low-mass protostars and a field star (Table 1).9
Methanol is a precursor not only of simple species such as methyl methanoate (HCOOCH3) and dimethyl ether (CH3OCH3) but also of many prebiotic species such as sugar and amino acids.10-12 There are several examples of methanol detection in the gas phase.13,14 Figure 1 presents an example of the recent first detection of methanol in the circumstellar gas of a proto-star (TW Hya) measured with the Atacama Large Millimeter Array (ALMA).
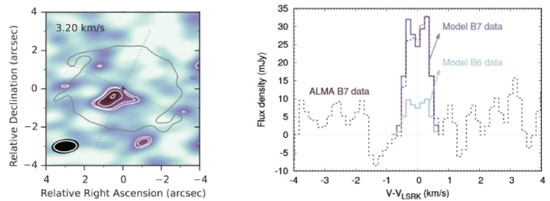 Figure 1. The first detection of methanol in circumstellar gas of a protostar (TW Hya) measured with the ALMA radio telescope in the extension of 317 GHz14
The formation of interstellar methanol can occur both in the gas phase and on the surface of astrophysical ices. However, the reactions in the gas phase are insufficient to justify the relative abundances of methanol detected and, therefore, reactions involving grains become necessary.15 As an example of the detection of methanol in the solid phase, graphs related to the detection of the molecule in young stellar objects with intermediate-mass such as Reipurth 50 (Figure 2) located in the Serpent and Chameleon molecular clouds complexes.16
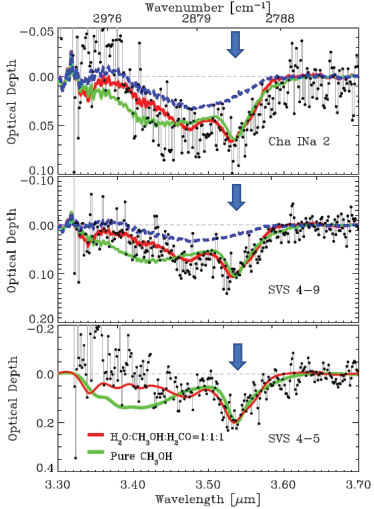 Figure 2. Infrared spectra with features indicating the presence of methanol in the solid phase (band at 3.53 micrometers) in the vicinity of young objects embedded in Serpent and Chameleon molecular clouds complexes (black dots). Lines indicate Laboratory spectra of ices containing methanol for comparisons purpose16
In this paper, we present an analysis of the destruction of this molecule in the solid phase in the presence of soft X-rays (6 to 2000 eV) similarly to what happens in the interstellar medium and interplanetary medium and also the formation of daughter species over time. The same technique employed in this paper was useful for analyze molecules destruction / formation in other experiments from LASA workgroup such as SO2 ice at 12 K,17 pure HCOOCH3 ice at 12 K,18 a binary ice mixture N2:CH4 (19:1) at 12 K19 and a quaternary ice mixture H2O:CO2:NH3:SO2 (10:1:1:1) at two different temperatures (50 K and 90 K).20
METHODOLOGY In an attempt to simulate space environments (high vacuum, low temperature, and radiation field), we employed the chamber coupled to the SGM beamline of the Brazilian Synchrotron Light Source (LNLS/CNPEM). We operate the beamline in off-focus and broadband mode to simulate the effects caused by broadband soft X-rays (6 to 2000 eV) in an icy sample. The broadband photon energy distribution (white beam mode) was obtained by placing the monochromator at the zero the order of reflection (the grating acts like an ordinary mirror and the white light exits from the monochromator). The average flux was 1 × 10¹⁴ photons cm-2 s-1. More details were given by Pilling and Bergantini.20 Briefly, gaseous CH3OH was slowly deposited into a clean ZnSe substrate crystal couple to helium closed-cycle cryostat at the vacuum chamber, through a capillary tube kept about 0.5 cm from the crystal during about 5 minutes forming ice with 1.1 mm of initial thickness. To determine the sample thickness, we employed the equation:  where N, M, and ρ are the initial column density in units of molecule cm-2, the molar mass in units of g mol-1, and density in units of g cm-3 for the considered species, respectively.21 The pressure in the chamber before the deposition phase starts and during methanol deposition was between 10-8 and 10-7 mbar. The ice was irradiated with broadband soft X-rays during 250 minutes at a constant temperature of 12 K. The chemical changes in the icy sample were monitored by the transmittance FTIR spectroscopy (Agilent Cary - 630 Portable FTIR). The infrared spectra obtained has a resolution of 1 cm-1 and a spectral range of 4000 cm-1 to 900 cm-1. The spectral analysis performed in this paper employ OMNIC and ORIGIN software. Figure 3 shows a diagram with the experimental chamber employed in this work. In it, we can observe the CH3OH ampoule added before the mixture chamber (left side, indicated with the arrow) and the input from the SGM beamline (Synchrotron Radiation) on the right side.
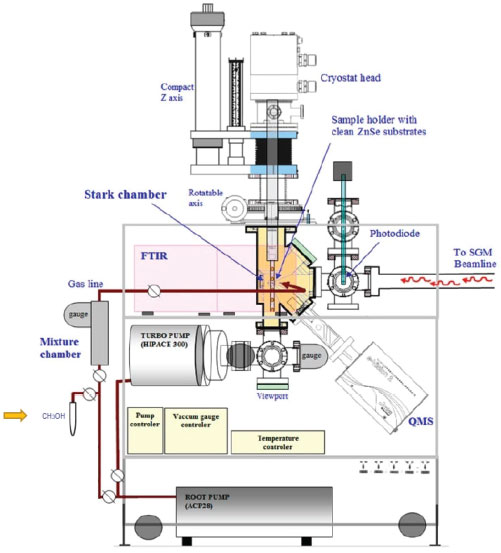 Figure 3. Schematic drawing of the experimental chamber with methanol highlighted20
RESULTS AND DISCUSSION Chemical changes during photolysis and effective cross section determination The infrared spectrum of unirradiated methanol ice is presented in Figure 4 with the attribution of some vibrational bands. The methanol destruction by soft X-rays was measured considering three of its different vibration modes: the OH stretch corresponding to the band at 3347 cm-1, the symmetrical and antisymmetric stretch CH3 occurring at the 2900 cm-1 region, and the CO stretch that occurs in the 1030 cm-1 region. In Figure 5 we superimposed the spectra of unirradiated ice with the last measured (after 250 minutes of soft X-ray irradiation). The bands associated with vibration modes of the new produced daughter species are easily seen.
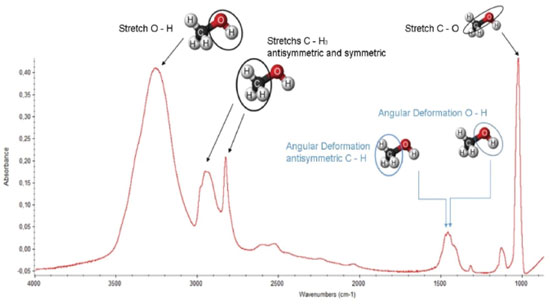 Figure 4. The infrared spectrum of amorphous methanol ice at 12 K indicating the main vibrational modes
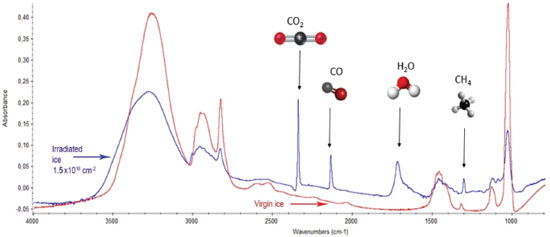 Figure 5. Overlap of the virgin methanol ice (red line) and irradiated ice spectra after 250 minutes of exposure to photons in soft X-rays (6 to 2000 eV)
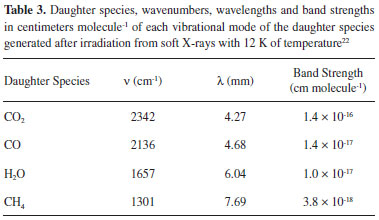
The band strength of each vibrational mode, from parent and daughter species, were properly listed from literature and present in Tables 2 and 3.
The change of molecular abundance as a function of radiation fluency (destruction or production) was evaluated by the analysis of infrared area evolution with fluence using:  where F is the fluence, in units of cm-2, A, A0 and A∞ are related to the band areas of the infrared spectrum, at a given fluence (A), for the un-irradiated sample (A0), and at the highest fluence (A∞). In this equation, sd,f represents the effective formation cross section (sf) new-formed species or the effective destruction cross section (sd) parent species, both in units of cm2.20 Figure 6 presents the subtracted band area (proportional to the molecular abundances) as a function of fluence. Lines are the best fits employing equation 1. The values for the effective cross section determined are also shown. The upper panel presents the new produced species and the bottom panel the destruction/dissociation of parts of methanol molecule (by quantifying the decreasing of bands associated with vibration mode of a selected part of the molecule).
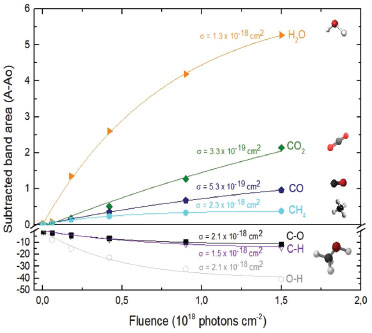 Figure 6. Evolution of the abundance of methanol daughter species and of the methanol bands destruction curve (irradiated with soft X-rays) indicated by the difference between column densities as a function of fluence
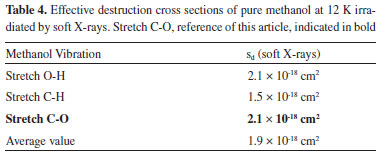
The numerical evolution equations of the abundance of methanol adjusted the curves of presented graphs and gave origin to the table (Table 4) with an indication of the effective destruction cross sections of each band. The C-O stretch ("backbone" of this molecule)23 is the chosen representant of effective destruction of methanol ice because this value is close to the average value (last line of Table 4) of the evaluated bands of methanol molecule.
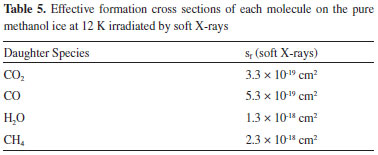
On the formation of daughter species in the soft X-rays irradiation, the data obtained experimentally were used to determine the numerical evolution of the abundance of each species indicated (CO2, CO, H2O and CH4). Table 5 shows the effective formation cross sections of each molecule.
Column mass and chemical equilibrium The column mass (Mi) of a given species i in the ice as a function of fluence is defined by the expression:  where Ni(F) is the column density in units of molecules cm-2 and  where To determine the sputtering yield it was assumed that, although we could not observe all the daughter species formed from the irradiation process, there is a tendency that its column mass is desorbed with a similar proportion to the column mass of the species we can observe in the infrared spectra. Thus the estimated Ydes = 0.18 molecule photon-1 was adopted indirectly indicating how MUNKNOWN was produced, which was later considered for the abundance of the system along the process and after reaching the chemical equilibrium. The column mass of unknown species (MUNKNOWN) can be estimated by the following equation:  where Si=parent Mi(F = 0) indicates the sum of the column masses of the parent species at the beginning of the experiment, ΣMj (F) indicates the sum of the column masses of the observed species (father and daughter) at a given fluence F and MDES(F) is the estimated column mass of the desorbed species (from equation 4). Thus, by knowing MUNKNOWN(F), we can estimate the column density of the unknown species by employing Equation (3) once more. The column mass as a function of fluence in the current experiment was presented in Figure 7. We observe that at the beginning of the experiment, the summed column mass of the observed species shows a decrease, suggesting the appearance of a reasonable number of reactant species in the ice, which is also incorporated in the inventory of column mass of unknown species. In addition, the figure shows that the summed column mass of observed species (black curve), as well as the estimated column mass of the unknown species (red curve), which were obtained by employing Equation (5), reach a tilted plateau at longer fluences. This fact reinforces the appearance of a steadystate regime in the ices after longer fluences. The small inclination of this plateau in the column masses discussed is due to the constant desorption rate which reduces the mass of ice with the fluence.
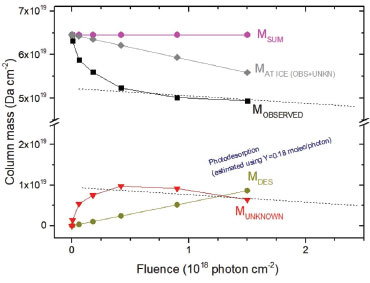 Figure 7. Evolution of column mass of material (observed and not observed) during methanol irradiation with broadband soft X-rays as a function of fluence
The percentage molecular abundance or branching ratio, as a function of fluence, can be obtained by the following expression  where Ni is the column density of a given species i (including parent, daughters and the unknown species) at a given fluence. The estimation of the column density of unknown species was performed employing Eq. 3 and Eq. 5 (adopting an average molecular mass for the unknown species equal to the parent species, MMUNKNOWN ~ Figure 8 presents the molecular abundance (in percentage) as a function of photon fluence. Dashed regions, in the right part, indicates the equilibrium fluence (FE) of the system.19 At this fluence chemical changes are not observed anymore with IR spectroscopy indicating that molecular abundances are virtually constant as well as similar destruction and formation rate at each molecular. In this equilibrium stage, the parent species produce the daughter molecules, which can also be intermediated in the formation of the new species and of the own parent molecule.19
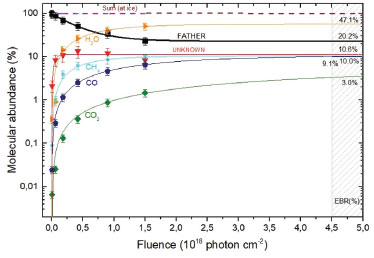 Figure 8. Percentage evolution and percentage destruction of the abundance of species of methanol irradiated with photons indicated as a function of photon fluence. The gray rectangle indicates the estimated region of the chemical equilibrium fluence (FE). From this fluence onwards the chemical composition of the sample practically does not change during the processing by the ionizing radiation
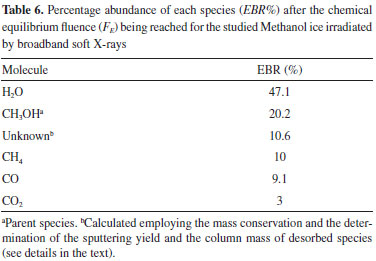
The evolution of molecular abundances as a function of radiation fluence tends to reach a plateau, indicating the appearing of chemical equilibrium in the sample as seen in Figure 8. In the current experiment, this occurs at fluences of about 4.5 x 10¹⁸ photons cm-2. The lines are the best fit employing a slightly modified version of Eq. 1 up to the fluences 5 x 10¹⁸ photons cm-2 to show the horizontal plateau at larger fluences. The Equilibrium Branching Ratio (in percentage) is defined as a relative abundance of a given species after the system reaches chemical equilibrium according to the expression:  where NE is the column density of a given species (parent or daughter or unknown) after the system reaches the chemical equilibrium (i.e. at the chemical equilibrium fluence or further). It is important to note that the accuracy of the EBR values depends on the determination or the estimation (current methodology) of the amount of material that desorbed from the sample during processing (sputtering) and also the molecule in the ices that could not be measured or identified in the infrared spectra (called unknown molecules). The calculated EBR value in this work during methanol irradiation at 12 K by broadband soft X-rays is listed in Table 6 (also indicated in Figure 8).
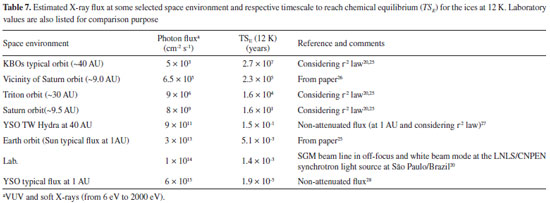
DISCUSSION AND ASTROPHYSICAL IMPLICATIONS The timescale (in years) required for an ice system reaches the chemical equilibrium phase during irradiation, at constant flux, and at a constant temperature, is given by the following expression:  where FE is the fluence of equilibrium (minimal fluence to reach chemical equilibrium) in units of photon cm-2, φ is the radiation flux in units of photon cm-2 s-1. Table 7 lists the estimated photon flux (from 6 to 2000 eV) for some selected space environments (including some location inside solar system and around some young stellar objects-YSOs), and the timescale to reach chemical equilibrium for methanol ice at 12 K calculated exposed to soft X-rays. Laboratory value was also listed for comparison.
The plot, indicated in Figure 9, identify the timescale to reach chemical equilibrium (TSE) as a function of photon flux (mainly soft X-rays). Vertical lines show the flux of selected space environments illuminated by in VUV and soft X-rays, as well as the laboratory photon flux employed in this work for comparison. In the case of the vicinity of Saturn (at 9 AU), we observe that considering only the incoming solar VUV and soft X-rays, the estimated timescale to reach chemical equilibrium is around 105 years.
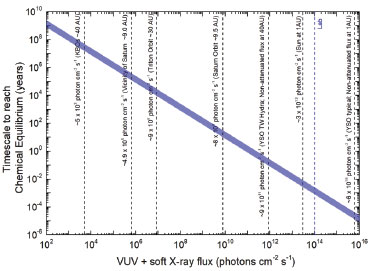 Figure 9. Timescale required for the icy system reaches chemical equilibrium as a function of photon flux (6-2000 eV). Vertical lines indicate fluxes in selected space environments
CONCLUSIONS In this work, we present experimental results on the irradiation of methanol ice (12K) employing broadband soft X-rays in an attempt to simulate the methanol rich ices processing by ionizing radiation in space environments. The experiments occurred at the Brazilian Synchrotron facility LNLS/CNPEM, employing a high vacuum chamber and infrared spectrometer (FTIR) coupled to the SGM beamline up to photon fluences of 1.5 × 10¹⁸ photons cm-2. The frozen sample was monitored and analyzed by infrared spectroscopy. The main conclusions were: i) New molecules produced during photolysis were identified, such as CO, CO2, H2O, and CH4, based on their characteristics of infrared absorption bands. The mass of unknown species was estimated by considering mass conservation in the system and molecular desorption. The desorption yield was estimated to be around 0.18 molecules per photon. ii) The effective destruction cross section for methanol due to the employed broadband X-rays was around 2.1 × 10⁻¹⁸ cm2. The determined effective formation cross section for daughter species with bands visible on infrared spectra were: 3.3 × 10⁻¹⁹ cm2 (CO2), 5.3 × 10⁻¹⁹ cm2 (CO), 1.3 × 10⁻¹⁸ cm2 (H2O), 2.3 × 10⁻¹⁸ cm2 (CH4). iii) Molecular abundance percentages at equilibrium chemistry (or Equilibrium Branching Ratio - EBR%) were determined considering parent species, daughter species, and unknown material. The main photolysis product at chemical equilibrium (at large fluence) was H2O (47.1% of the assigned species) followed by the CO and CH4 (10% and 9.1%, respectively) The abundances of unknown species at equilibrium was 10.6%. iv) The timescale to reach chemical equilibrium (TSE) of pure methanol ice irradiated by broadband soft X-rays was estimated for some astrophysical environments. For example, for the interplanetary medium in the vicinity of Saturn (with photon flux of 6.5 × 105 cm-2 s-1) was roughly 2.3 × 10⁵ years, while in orbit of Earth (with photon flux of 3 × 1013 cm-2 s-1) was roughly 5.1 × 10⁻³ years. This study helps to clarify better the effects of ionizing radiation on methanol abundant ices as well as the equilibrium chemistry phase that happens in icy surfaces in the interplanetary and interstellar medium and also corroborates that radiation induced chemistry by X-rays plays an essential collaboration in astrophysical environments.
ACKNOWLEDGEMENTS We thank the financial support from the agencies FAPESP (#2009/18304-0), FINEP, CAPES and CNPQ (#PQ306145/20154; #PQ302985/2018-2). The authors also acknowledge the staff of LNLS/CNPEM and FVE/UNIVAP for their support in this scientific production.
REFERENCES 1. Janot-Pacheco, E.; Boechat-Roberty, H.; Lage, C.; Picazzio, E.; Medeiros, J. R.; Sociedade Astronômica Brasileira 2017, 03, 01. 2. Parise, B.; Ceccarelli, C.; Tielens, A. G. G. M.; Castets, A.; Caux, E.; Lefloch, B.; Maret, S.; Astron. Astrophys. 2006, 453, 949. 3. Friberg, P.; Madden, S. C.; Hjalmarson, A.; Irvine, W. M.; Astron. Astrophys. 1988, 195, 281. 4. Bockelée-Morvan, D.; Crovisier, J.; Colom, P.; Despois, D.; Astron. Astrophys. 1994, 287, 647. 5. Grim, R. J. A.; Greenberg, J. M.; Groot, M. S.; Bass, F.; Schutte, W. A.; Schmitt, B.; Astron. Astrophys., Suppl. Ser. 1989, 78, 161. 6. Gibb, E. L.; Whittet, D. C. B.; Boogert, A. C. A.; Tielens, A. G. G. M.; The Astrophysical Journal Supplement Series 2004, 151, 35. 7. Öberg, K. I.; Boogert, A. C. A.; Pontoppidan, K. M.; Broek, S.; Dishoeck, E. F.; Bottinelli, S.; Blake, G. A.; Evans II, N. J.; The Astrophysical Journal 2011, 740, 109. 8. Ball, J. A.; Gottlieb, C. A.; Lilley, A. E.; Radford, H. E.; The Astrophysical Journal 1970, 162, 203. 9. Ehrenfreund, P.; Charnley, S. B.; Annu. Rev. Astron. Astrophys. 2000, 38, 427. 10. Allamandola, L. J.; Hudgins, D. M.; Solid State Astrochemistry 2003, 01, 251. 11. Hollis, J. M.; Lovas, F. J.; Jewell, P. R.; The Astrophysical Journal 2000, 540, 107. 12. Andrade, D. P. P.; Boechat-Roberty, H. M.; Martinez, R.; Homem, M. G. P.; Silveira, E. F.; Rocco, M. L. M.; Surf. Sci. 2009, 603, 1190. 13. Wang, S.; Bergin, E. A.; Crockett, N. R.; Goldsmith, P. F.; Lis, D. C.; Pearson, J. C.; Schilke, P.; Bell, T. A.; Comito, C.; Blake, G. A.; Caux, E.; Ceccarelli, C.; Cernicharo, J.; Daniel, F.; Dubernet, M. L.; Emprechtinger, M.; Encrenaz, P.; Gerin, M.; Giesen, T. F.; Goicoechea, J. R.; Gupta, H.; Herbst, E.; Joblin, C.; Johnstone, D.; Langer, W. D.; Latter, W. B.; Lord, S. D.; Maret, S.; Martin, P. G.; Melnick, G. J.; Menten, K. M.; Morris, P.; Müller, H. S. P.; Murphy, J. A.; Neufeld, D. A.; Ossenkopf, V.; Pérault, M.; Phillips, T. G.; Plume, R.; Qin, S. L.; Schlemmer, S.; Stutzki, J.; Trappe, N.; Tak, F. F. S.; Vastel, C.; Yorke, H. W.; Yu, S.; Zmuidzinas, J.; Astron. Astrophys. 2011, 527, A95. 14. Walsh, C.; Loomis, R. A.; Öberg, K. I.; Kama, M.; Hoff, M. L. R.; Millar, T. J.; Aikawa, Y.; Herbst, E.; Weaver, S. L. W.; Nomura, H.; The Astrophysical Journal Letters 2016, 823, L10. 15. Millar, T. J.; Rawlings, J. M. C.; Bennet, A.; Brown, P. D.; Charnley, S. B.; Astron. Astrophys., Suppl. Ser. 1991, 87, 585. 16. Pontoppidan, K. M.; Dartois, E.; Dishoeck, E. F.; Thi, W. F.; Hendecourt, L.; Astron. Astrophys. 2003, 404, L17. 17. Bonfim, V. S.; Castilho, R. B.; Baptista, L.; Pilling, S.; Phys. Chem. Chem. Phys. 2017, 19, 26906. 18. Rachid, M. G.; Faquine, K.; Pilling, S.; Planet. Space Sci. 2017, 149, 83. 19. Vasconcellos, F. A.; Pilling, S.; Rocha, W. R. M.; Rothard, H.; Boduch, P.; The Astrophysical Journal 2017, 850, 174. 20. Pilling, S.; Bergantini, A.; The Astrophysical Journal 2015, 811, 151. 21. Pilling, S.; Duarte, E. S.; Domaracka, A.; Rothard, H.; Boduch, P.; Silveira, E. F.; Phys. Chem. Chem. Phys. 2011, 13, 15755. 22. Hudgins, D. M.; Sandford, S. A.; Allamandola, L. J.; Tielens, A. G. G. M.; The Astrophysical Journal Supplement Series 1993, 86, 713. 23. Portugal, W.; Pilling, S.; Boduch, P.; Rothard, H.; Andrade, D. P. P.; Mon. Not. R. Astron. Soc. 2014, 441, 3209. 24. Pilling, S.; Rocha, W. R. M.; Freitas, F. M.; Silva, P. A.; RSC Adv. 2019, 09, 28823. 25. Gueymard, C. A.; Solar Energy 2004, 76, 423. 26. Bennett, C. J.; Chen, S. H.; Sun, B. J.; Chang, A. H. H.; Kaiser, R. I.; The Astrophysical Journal 2007, 660, 1588. 27. Fantuzzi, F.; Piling, S.; Santos, A. C. F.; Baptista, L.; Rocha, A. B.; Boechat-Roberty, H. M.; Mon. Not. R. Astron. Soc. 2011, 417, 2631. 28. Siebenmorgen, R.; Krügel, E.; Astron. Astrophys. 2010, 511, A6. |
On-line version ISSN 1678-7064 Printed version ISSN 0100-4042
Qu�mica Nova
Publica��es da Sociedade Brasileira de Qu�mica
Caixa Postal: 26037
05513-970 S�o Paulo - SP
Tel/Fax: +55.11.3032.2299/+55.11.3814.3602
Free access


 is the molecular mass of the given i species, in units of Da molecule-1. Therefore, the estimated column mass of the desorbed species (all species together including parent, daughter and unknown) from the sample during ion bombarded as a function of fluence, MDES(F), is given by:
 is s the molecular mass of the parent species initially in the sample (i.e. 32 Da molecule-1, for methanol), Y is the sputtering rate, in molecules photon-1, and F is the fluence, in photons cm-2.