Artigo
| Phytochemical and biological studies of constituents from roots of Salacia crassifolia (Celastraceae) |
|
Josana Pereira dos SantosI, Willian Xerxes Coelho OliveiraI, Sidney A. Vieira-FilhoII, Rafael C. G. PereiraI, Grasiely Faria de SouzaI, Viviane Alves GouveiaIII, Adriano de Paula SabinoIV, Fernanda C. G. EvangelistaIV, Jacqueline Aparecida TakahashiI, Marília A. F. MouraI, Filipe B. AlmeidaV and Lucienir Pains DuarteI,*
I. Departamento de Química, Instituto de Ciências Exatas, Universidade Federal de Minas Gerais, 31270-901 Belo Horizonte - MG, Brasil Recebido em 29/10/2019 *e-mail: lucienir@gmail.com Salacia crassifolia traditionally known as "Bacupari-do-Cerrado" is used to treat kidney problems, and as a healing agent for coughs and malaria. The phytochemical study of the S. crassifolia roots led to the isolation of thirteen compounds: abruslactone-A (1), urs-12-ene-3β,25,30-triol (2), carioprystimerin (3), β-sitosterol (4), pristimerin (5), dispermoquinone (6), netzahualcoyonol (7), 20-hydroxy-20-epi-tingenone (8), 6-oxo-pristimerol (9), 9β,10β-epoxi-3β-hydroxy-1βH,4βH,5βH,7βH,11αH-guaian-12,8β-olide (10), 3-O-b-D-glucosyl-b-sitosterol (11), 4`-O-methylepigalocatechin (12) and cerebroside (13). The chemical structures of 1-13 were determined by IR, 1D/2D NMR together with X-ray diffractometry. Compounds 2 and 10 are herein described for the first time. Extracts of S. crassifolia and compounds 3, 5, 8 and 9 were evaluated on acetylcholinesterase inhibition, in vitro cytotoxic activity and in vivo toxicity tests using Caenorhabditis elegans model. All tested compounds inhibited acetylcholinesterase, and compounds 3, 8 and 9 demonstrated a greater potential when compared to the standard eserine. The tested compounds showed low cytotoxicity against the THP-1, K562 and MDA-MB-231 cancer cell lines. None of the tested compounds and extracts were toxic against C. elegans since the larvae survival rate in L1 stage was higher than 90%. INTRODUCTION The Celastraceae family consists of 106 genera and 1300 species mainly distributed in tropical and subtropical regions. In Brazil, this family is represented by Maytenus Juss, Plenckia Lund, Franhofera Mart. and Salacia Mart. genera.1,2 Several pentacyclic triterpenes (PCTT) of varied scaffolds have been isolated from Celastraceae species and have been attributed some effects, such as anticancer (ursane),3 antineoplastic (lupane),4 antidiabetes (oleanane),5 antitumoral (quinonemethide),6 anti-inflammatory, analgesic and antipyretic (friedelane).7 In addition to being biologically active, the quinonemethides are restricted to Celastraceae members, hence they are considered chemotaxonomic markers of this family.8 The genus Salacia consists of 200 species distributed in tropical areas, including South America, India, South China and countries of Southeast Asia.9 In several countries, species of this genus are used in traditional medicine for treatment of diabetes and as anti-inflammatory drugs.10,11 In Brazil, S. crassifolia is popularly known as "Bacupari-do-Cerrado" and it is traditionally used for the treatment of kidney problems, cough, headache, and also as healing agent for malaria.12 Studies of Salacia species led to the isolation of friedelane, oleanane, ursane, quinonemethide and lupane triterpenes. As an example, the phytochemical study of S. impressifolia led to the isolation of fifteen compounds including six of the quinonemethide series (tingenone, pristimerin, 30-hydroxypristimerin, isoiguesterine, 22-hydroxytingenone and netzahualcoyonol), two with friedelane skeleton (regeol A and friedelin), four lupane PCTT (lupeol, salicillin, 2-oxo-20(29)lupen-3β-ol, 2β,3β-dihydroxylup-20(29)-ene), one oleanane and one ursane PCTT (mixture of α and β-amyrin), and one steroid (β-sitosterol).13 Pristimerin stands out for presenting pharmacological activities, such as antioxidant, antimalarial,14 antifungal,15 anti-inflammatory and antioxidant.16,17 The quinonemethides tingenone, pristimerin and 22-hydroxytingenone isolated from ethyl acetate stem extract of S. impressifolia showed in vitro activity on leukemia cell lines.9 Fifteen compounds were isolated from roots and stems of S. hainanensis. The triterpenoids lupeol, salaquinone and lup-20(29)en-3,16-diol showed in vitro inhibitory effect on α-glucosidase.18 From S. crassifolia leaves fourteen compounds were isolated, including 3β-palmitoxy-urs-12-ene, friedelin, friedelan-3β-ol, 28-hydroxyfriedelan-3-one, 29-hydroxyfriedelan-3-one, 28,29-dihydroxyfriedelan-3-one, 3,4-seco-friedelan-3-oic acid, olean-9(11):12-dien-3β-ol, α-amyrin, β-amyrin, β-sitosterol, gutta-percha polymer, squalene and eicosanoic acid.19 Bioassay-guided study of n-hexane root extract of S. crassifolia led to the isolation of pristimerin, hydroxyprystimerin, 6-oxopristimerol and vitideasin. The extract and the isolated PCTT displayed significant cytotoxic activity against the human cancer cell lines tested.20 Pristimerin was also isolated from S. reticulata,21 S. kraussi14 and S. amplifolia22 species, and inhibited the growth of several cancer cell types such as breast, prostate, pancreas and multiple myeloma tumors.23 The present work describes further studies on S. crassifolia roots. This study resulted in the isolation of two new compounds along with eleven known substances. The in vitro anticholinesterase inhibition, cytotoxicity properties and the in vivo toxicity on Caenorhabditis elegans were also evaluated.
MATERIAL AND METHODS Plant material Roots of Salacia crassifolia (Mart.) G. Don. (Celastraceae) (Figure 1S on supplementary material) were collected by Dr. Maria Olívia Mercadante-Simões of Universidade Estadual de Montes Claros, Montes Claros Municipality, Minas Gerais, Brazil. An exsiccate (Number BHCB 144624) of the plant material was deposited in Herbarium of the Department of Botany, Instituto de Ciências Biológicas of Universidade Federal de Minas Gerais. The plant material accessed was registered at Conselho de Gestão do Patrimônio Genético (CGEN/SisGen) under number A3D535B. General experimental procedures Melting point was determined in a digital device of Microquímica Equipamentos Ltda (MQAPF-302). The infrared spectra were recorded on a Shimadzu IR-spectrometer IR-408 as KBr pellets (~1%KBr). The high resolution mass spectrometry (HR-MS) spectra were obtained on a Bruker Maxis II ETD using ESI source. The 1H and 13C-NMR spectra were recorded at 400.129 and 100.613 MHz, respectively, as well as correlation spectroscopy (COSY), heteronuclear single quantum coherence (HSQC), heteronuclear multiple bond correlation (HMBC) and nuclear Overhauser effect spectroscopy (NOESY) experiments were performed on a Brüker DRX400 AVANCE spectrometer, with direct or inverse probes and field gradient. CDCl3 or CDCl3 with two drops of pyridine-d5 were used as solvents. The chemical shift assignments were registered in ppm (δ) using tetramethylsilane (TMS) as internal standard (δH = δc = 0). The coupling constants (J) were registered in hertz (Hz). Single crystal X-ray diffraction data were collected on a Bruker D8 Venture diffractometer at 298 K using Mo Kα radiation (λ = 0.71073 Å). The program CrysAlisPro, Agilent was used to data integration, scaling of the reflections and analytical absorption corrections. Final unit cell parameters were based on the fitting of all reflection positions. Space group identification was done firstly in CrysAlisPro and then in SUPERFLIP® among structure solution. Refinements were performed using SHELXL2018/3® software based on F2 through full-matrix least-squares routine, using the WinGX® graphical user interface. All non-hydrogen atoms were refined anisotropically, and hydrogen atoms were placed at calculated positions and refined isotropically with a riding model. Medium pressure liquid chromatography (MPLC) was performed on a Biotage® IsoleraTM Spektra One equipment, using a 10 g SNAP column. Classical chromatographic columns (CC) were prepared using silica gel 60 (70-230 or 230-400 Mesh) or Sephadex as stationary phase. The sample/silica ratio of 1/40 was adopted. Successive column chromatographic processes were performed using n-hexane, ethyl acetate and methanol pure or in mixtures of increasing polarity. When necessary a specific mobile phase was used and cited in each case. Analytical thin layer chromatography (TLC) processes were carried out using silica gel 60G (7 g/15 mL water) on a 0.25 mm thick glass plate previously activated at 100 ºC. The chromatographic plates were revealed by spraying solution (1:1) of 3% perchloric acid in water with 1% vanillin in ethanol. Isolated compounds with adequate purity, observed by melting point and TLC, were submitted to IR and 1H and 13C NMR and 2D spectral data when necessary. Complete spectral data are presented only for unknown compounds. Extracts preparation S. crassifolia roots (1.2 kg) were dried at room temperature (r.t.) and then grinded in a knife mill. A Soxhlet apparatus was used to obtain the n-hexane/ethyl ether (1:1) extract. The further extracts were obtained by exhaustive extraction maceration at r.t. After filtration, each extracting solvent was recovered in rotary evaporator, with temperature < 40 °C, and under reduced pressure when necessary. The following extracts were obtained from S. crassifolia roots: n-hexane/ethyl ether (EHE1, 27.0 g and EHE2, 49.0 g), chloroform (EC, 1.8 g), ethyl acetate (EAE, 5.0 g), acetone (ACE, 42.0 g) and methanol (EMet, 38.0 g). Isolation of compounds EHE1 (27 g) was obtained as a solid material of intense reddish color. 20 g of extract were submitted to CC (80 x 3.5 cm; 430 g of silica gel 60), eluted with n-hexane, EtOAc and MeOH, pure or in polarity gradient, obtaining 101 fractions of 100 mL each. Fraction 68-70 (Hex/EtOAc 1:1) was obtained as a brown solid (691 mg) which was fractioned by CC, yielding 113 fractions. Subfraction 7-14 (CH2Cl2/EtOAc 1:1) was obtained as a solid material. After analysis of IR and 1H and 13C NMR spectral data, this solid was identified as abruslactone-A (1, 18.0 mg). Subfraction 59-64 (EtOAc) was obtained as a white crystalline solid. Based on the IR and 1H and 13C NMR (1D/2D) spectral data, this solid was identified as urs-12-ene-3β,25,30-triol (2, 15.1 mg). The extract EHE2 (49 g) was obtained as a solid material of intense reddish color. EHE2 (38 g) was fractioned by silica gel CC (90 x 5.5 cm; 700 g of silica gel 60), yielding 108 fractions of 100 mL each. Fraction 7-13 (Hex/EtOAc 8:2) was obtained as a yellow solid. Based on its spectral data, this solid was identified as caryopristimerin (3, 26.4 mg). The fraction 17-20 (Hex/EtOAc 8:2) was obtained as a white solid, and by its 1H and 13C NMR data it was possible to identify this compound as β-sitosterol (4, 16.0 mg). Fraction 30-48 (Hex/EtOAc 7:3) yielded an orange solid (8.97 g), which was purified through silica gel CC. Subfractions 70-92 (Hex/EtOAc 7:3) furnished an orange crystalline solid that presented a single stain in TLC. After analysis of its spectral data, the solid was identified as pristimerin (5, 5.6 g). Fraction 49-51 (Hex/EtOAc 6:4) was obtained as a yellow solid, and identified as dispermoquinone (6, 12.0 mg). The fraction 53-54 (Hex/EtOAc 1:1) yielded a red solid (424.8 mg), which was then submitted to silica gel CC. Subfraction 22-31 (Hex/EtOAc 7:3) formed a red crystalline solid, identified as netzahualcoionol (7, 13.7 mg). Subfraction 41-61 (Hex/EtOAc 6:4) was obtained as a red solid material, identified as 20-hydroxy-20-epi-tingenone (8, 38.1 mg). Fraction 61-64 (EtOAc) yielded a reddish solid (1.14 g) that was submitted to silica gel CC. Subfraction 44-73 (Hex/EtOAc 6:4) was isolated as an orange solid material which by its spectral data was identified as being the 6-oxopristimerol (9, 29.1 mg). The chloroform extract from S. crassifolia roots (EC, 1.5 g) was submitted to silica gel CC (69 x 3.0 cm; 180 g of silica gel 60) eluted with CH2Cl2, EtOAc and MeOH, pure or in mixtures of increasing polarity, providing 150 fractions of 20 mL each. The fraction 19-42 (61.0 mg) was submitted to a CC eluted with CH2Cl2/EtOAc (9:1) yielded an orange solid which by its spectral data was identified as pristimerin (5, 8.0 mg). The fraction 17-24 (Hex/EtOAc 8:2) was obtained as colorless wax. Based on the IR and 1D/2D NMR spectral data, this wax was identified as being 9β,10β-epoxi-3β-hydroxy-1βH,4βH,5βH,7βH,11αH-guaian-12,8β-olide (10, 27.0 mg). The ethyl acetate extract from S. crassifolia roots (EAE) was obtained as a waxy material (5 g). This material was submitted to silica gel CC (83 x 4.5 cm; 260 g of silica gel 60) eluted with n-hexane, EtOAc and MeOH, pure or in mixtures of increasing polarity, yielding 113 fractions of 100 mL. Fractions 100-107 (EtOAc/MeOH 9:1) yielded a red solid (2.9 g) that was fractionated by MPLC using a Biotage® Snap ultra 100 g column using CHCl3 and MeOH as eluents. Subfraction 32-34 (CHCl3) was obtained as a white solid (17.5 mg) identified as 3-O-β-D-glucosyl-β-sitosterol (11). The acetonic extract from S. crassifolia roots (EAC) was obtained as a waxy material (42 g) and it was submitted to silica gel CC (90 x 5.5 cm; 750 g of silica gel 60). Fraction 35-40 (CHCl3/MeOH 9:1) yielded a pale-yellow solid. Based on its spectral data was possible to identify this solid as being the 4'-O-methyl-epigallocatechin (12, 40.4 mg). Fraction 40-41 (CHCl3/MeOH 8:2) provided a brown waxy material (87.9 mg) which was purified by CC. Subfraction 28-36 (CH2Cl2) was isolated as a pale-yellow solid. Based on GC-MS and 1D/2D NMR data this solid was identified as a cerebroside (13, 20.6 mg). Acetylcholinesterase inhibition The methodology used to evaluate acetylcholinesterase inhibition was described by Ellman et al.24 and adapted by Rhee et al.25 The experiments were performed using 96-well microplates, in which 50 µL of Tris-HCl buffer (50 mmol L-1 , pH 8.0) and 125 µL of 5.5'-dithio-bis (2-nitrobenzoic acid) (DTNB) (3 mmol L-1) were added. Sample of 25 µL of each extract [10 mg mL-1 (DMSO)] and each compound [1 mg mL-1 (DMSO)] were respectively distributed in the wells. After this, 25 µL of acetylcholine iodide solution (ATCI) (15 mmol L-1) was added in each well. DMSO was used as negative control and serine (10 mg mL-1 DMSO) was used as positive control. The tests were performed in quintuplets. Absorbance at 405 nm was measured every 1 min for eight times. Then, 25 µL of acetylcholinesterase enzyme solution (0.22 U mL-1 in buffer) was added to the wells. The absorbance was measured again every 1 min for 10 times. The percentage of inhibition was calculated by comparing the absorbance of the samples with the absorbance of the negative control. Cytotoxic activity For the evaluation of cytotoxicity, the following tumor cell lines were used: THP-1 (acute myeloid leukemia cells, ATCC-TIB-202), K562 (chronic myeloid leukemia cells, ATCC-CRL-3344) and MDA-MB-231 (breast carcinoma cells, ATCC-HTB-26). The cytotoxicity of the samples against the Wi-26VA4 line (healthy cells from lung fibroblasts, ATCC-CCL-75) was used to establish the selectivity index (SI). To evaluate cell viability, i.e., the cytotoxicity of the samples, the 3-(4,5-dimethyl-2-thiazolyl)-2,5-diphenyl-tetrazolium (MTT) method was used. For the evaluation of cytotoxic activity, a 1 x 10⁶ plating of cells was performed on 96-well plates in RPMI-1640 medium plus 10% FBS. After cell plating, the plates were incubated for 24 hours at 37 ºC in an atmosphere of 5% CO2 in a humid environment, for subsequent addition of the samples to be tested. The cytotoxicity tests were performed in four serial dilutions on a decimal scale from the stock solution (compounds and positive controls), using RPMI-1640 with 1% FBS supplementation. Each concentration was tested in triplicate and each assay was also repeated in triplicate. Cytarabine (for TPH-1 cells), imatinib (for K562) and etoposide (for MDA-MB-231) were used as positive controls. After 48 hours incubation, the medium in each well was collected. To determine the viability of the cells, 100 µL of the MTT tetrazolic salt (5 mg mL-1) were added to each well and the cells were additionally incubated for 3 hours. The supernatant was removed and 50 µL DMSO was applied to each well to solubilize the water-insoluble formazan product. The reading was performed on a SpectraMax Plus 384 microplate Reader at 550 nm. Cytotoxicity was expressed by concentration values that inhibit 50% of cell growth (IC50) in the presence and absence of the samples and the positive control. The SI was calculated by the ratio between the average inhibitory concentrations (IC50) obtained for normal cells (Wi-26VA4) and that obtained for cancer cell lines. Toxicity test on Caenorhabditis elegans The toxicity of compounds 3, 5, 8, 9 and 12, together with the acetone (ACE), n-hexane/ethyl ether (EHE), chloroform (EC) and methanol (EMet) extracts was evaluated using the C. elegans model. The samples were weighed and dissolved in DMSO in order to obtain solutions at the maximum possible concentration. Due to differences in solubility in DMSO, different concentration values were obtained for each sample. Table 2S (supplementary material) shows the concentrations of the stock solutions of each compound and extract, as well as the final concentration of these samples during the toxicity tests. The toxicity tests were performed on 96-well microplates. In each well, 100 µL of M9 buffer with 100 (± 10) L1 larvae of C. elegans and 20 µL of stock solutions were added. All exposures were performed at 25 °C during the 24-hour period. DMSO was used as a negative control. Viability was evaluated 24 hours after exposure using the MTT assay. The cell viability was evaluated through the colorimetric MTT method.26 The assays were performed in 96-wells plates. To the wells containing C. elegans and extracts and compounds in M9 medium (Sigma) were added 5 µL of MTT (10 mg mL-1) and the mixture was incubated for 18 h at 25 ºC. After the incubation period, 100 µL was removed from the test suspension and 100 µL of DMSO were added for formazan blue solubilization. Absorbance was measured in a spectrophotometer (570 nm) and used to determine cell viability. C. elegans survival assays were performed on a 96-well plate containing 100 µL of M9 medium supplemented with 5 µL of chlorafenicol 34 mg mL-1 and 5 µL of FUDR 50 µg mL-1 (5-fluoro-2'-deoxyuridine, SIGMA), an inhibitor of thymidylate synthase used to prevent the production of C. elegans offspring.27 Samples and the nematodes in L4 larval stage (n=10) were added to this solution. During plate incubation at 25 oC, the worm survival was evaluated every 48 hours by counting living individuals using a stereomicroscope. This procedure was repeated until the death of all nematodes or for 20 days.28 The time required for the death of 50% of the C. elegans population (LT50) was calculated and the survival evaluation was determined using the log-rank and Wilcoxon tests by Kaplan-Meyer using GraphPrism software, version 5.01. The p-value <0.05 was considered statistically significant. Each experiment was performed with three technical replicas and three independent biological replicas.28 C. elegans fertility or its reproductive capacity assays were performed on a 96-well plate containing 100 µL of M9 medium supplemented with 5 µL of chlorafenicol 34 mg mL-1. The C. crassifolia samples and nematodes in L4 larval stage (n=2) were added to this solution. The plates were incubated at 25 oC for 48 hours. Then, the progeny number was quantified by counting L1 individuals in stereomicroscopy. Each assay was performed with two independent technical and biological replicas. GraphPad Prism software, version 5.01 (two-way ANOVA) was used for statistical analysis and graphics construction.
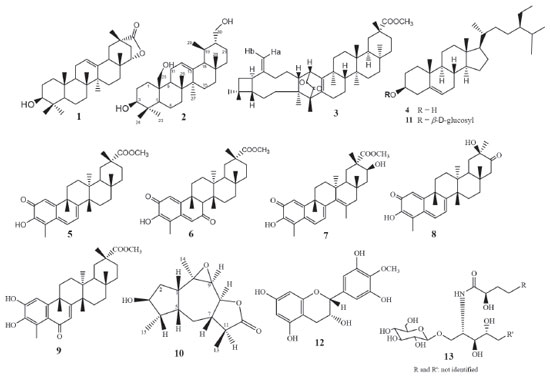
RESULTS AND DISCUSSION Phytochemical results As previously reported, the compounds caryopristimerin, 2α,3α,22β-trihydroxy-21-oxo-29-nor-friedelan-24-oic acid, 29-hydroxifriedelan-3-one, pristimerin, tingenone and netzahualcoyonol were isolated from the n-hexane/ethyl ether extract of S. crassifolia roots.29 In the present work, caryopristimerin (3), pristimerin (5), and netzahualcoyonol (7) were again isolated from roots extracts of S. crassifolia, along with eight known compounds and two new substances (Figure 1).
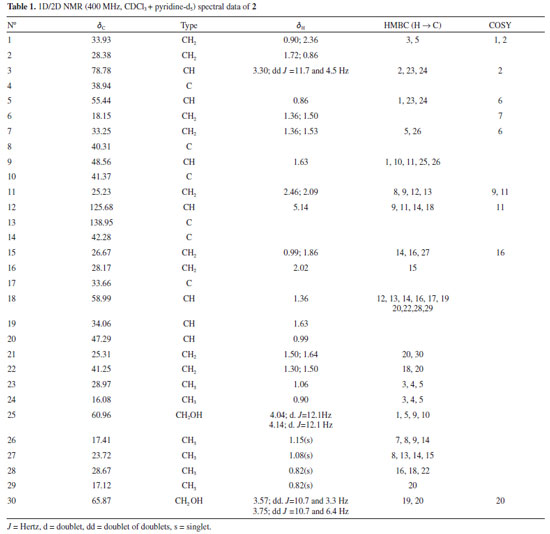
Chemical structures of compounds 1, 3 to 9, 11 to 13 isolated from S. crassifolia roots were confirmed by comparison to previously published 1H and 13C NMR data (1,30 3,29 4,31 5,29 6,32 7,29 8,33 9,34 11,35 12,36 1337). Complete elucidation of new compounds 2 and 10 are presented below. Urs-12-ene-3β,25,30-triol (2) Compound 2 was isolated from EHE1 as a white crystalline solid soluble in chloroform. The IR spectrum (Figure 2S) showed a broad and intense band at 3402-3430 cm-1 characteristic of the hydroxyl group and bands at 2860 and 2924 cm-1 characteristic of symmetric and asymmetric stretching of the CH bond. The ESI-MS showed a [M+H-H2O]+ peak at m/z 249.1491 (calcd. for C15H21O3, 249.1485) and a [2M+H]+ peak at m/z 533.3106 (calcd. for C30H45O8, 533.3109). The 1H NMR spectra showed a peak at δH 5.14 attributed to H-12 olefinic hydrogen, two doublets [δH 4.04 (d, J = 12.1 Hz, 1H) and δH 4.14 (d, J = 12.1 Hz, 1H)], and two double doublets [δH 3.57 (dd, J = 10.7 and 3.3 Hz, 1H) and δH 3.75 (dd, J = 10.7 and 6.4 Hz, 1H)] associated to the hydrogens atoms of hydroxymethyl groups (Figures 3S, 4S). The peak at δH 3.30 was attributed to H-3 and presented as a double doublet (dd, J = 11.7 and 4.5 Hz, 1H) indicating that H-3 is in axial position, thus the hydroxyl group must assume an equatorial orientation. The analysis of 13C NMR and DEPT-135 spectra (Figures 5S, 6S) indicated a total of 30 carbon peaks, which were classified as six CH3, eleven CH2, seven CH and six C. The peaks observed at δC 125.68 (C12) and 138.95 (C13) were attributed to olefinic carbon atoms, suggesting that 2 was an ursane-type triterpene according to similar data found in the literature.38 Using the chemical shift assignments at δH 5.14 (H-12), δC 125.68 (C-12) and 138.95 (C-13) as the starting point, a detailed analysis of the HSQC, HMBC and COSY contour maps (Figures 7S to 10S) was then performed in order to clarify the chemical structure of 2. H-12 correlated with carbon peaks at δC 25.23 (C-11), δC 42.28 (C-14), δC 48.56 (C-9) and δC 58.99 (C-18) in the HMBC contour map (Figures 8S and 9S). From the HSQC contour map (Figure 7S) it was possible to determine the assignments of H-11 (δH 2.46 and δH 2.09), H-9 (δH 1.63) and H-18 (δH 1.36). The HMBC contour map showed correlations of H-18 with peaks at δC 33.66 (C-17), δC 42.28 (C-14), δC 125.68 (C-12) and δC 138.95 (C-13). H-18 also correlated with peaks at δC 17.12 (C-29), δC 28.17 (C-16), δC 28.67 (C-28), δC 34.06 (C-19), δC 41.25 (C-22) and δC 47.29 (C-20). The hydrogen atoms H-20 (δH 0.99), H-16 (δH 2.02) and H-28 (δH 0.82) were also assigned by the correlations in HSQC. H-28 correlated in HMBC with the peaks at δC 28.17 (C-16), δC 33.66 (C-17), δC 41.25 (C-22) and δC 58.99 (C-18). A correlation between the peak at δH 2.02 (H-16) and δC 26.67 (C-15) was also observed (Figure 9S). The peaks at δH 0.99 and δH 1.86 were attributed to hydrogen H-15, which correlated with δC 28.17 (C-16), δC 23.72 (C-27) and δC 42.28 (C-14). Hence, the peak at δH 1.08 was attributed to H-27 due to the correlation with C-27 in HSQC. H-27 correlated with the peaks at δC 26.67 (C-15), δC 42.28 (C-14) and δC 138.95 (C-13). Also, in the HMBC, the peak at δC 40.31 (C-8) showed correlation with the hydrogen peak at δH 1.15 (H-26). H-26 correlated with the carbon peak at δC 33.25 (C-7), and with δC 48.56 (C-9). Based on the HSQC contour map, H-7 and H-9 shifts were established. H-9 (δH 1.63) correlates with carbon atoms at δC 17.41 (C-26), δC 33.93 (C-1), δC 41.37 (C-10) and δC 60.96 (C-25). H-25 chemical shift was assigned at δH 4.04 and δH 4.14 by HSQC analysis. In HMBC, H-25 correlated with the peaks at δC 33.93 (C-1), δC 41.37 (C-10), δC 48.56 (C-9) and δC 55.44 (C-5). The peaks at δH 0.90 and δH 2.36 were assigned to H-1 and at δH 0.86 to H-5 hydrogen. The HMBC contour map showed a correlation among the H-5 and the peaks at δC 16.08 (C-24) and δC 28.97 (C-23). H-24 (δH 0.90) correlated with the peaks at δC 38.94 (C-4), δC 55.44 (C-5) and δC 78.78 (C-3). It was also observed correlation between H-3 (δH 3.30) and C-2 (δC 28.38). In COSY contour map (Figure 10S), H-2 (δH 1.72) correlated with H-1 and with H-3. Correlations were observed between the peak at δH 2.46 and δH 2.09 (H-11) with H-9. H-16 (δH 2.02) correlated with H-15 (δH 0.99). Correlations of H-20 (δH 0.99) with the peaks at δH 3.57 and δH 3.75 attributed to the H-30 were also observed. Complete analysis of 1D (1H, 13C and DEPT-135) and 2D (HSQC, HMBC and COSY) NMR spectral data and chemical shift assignments of the hydrogen and carbon atoms of 2 are shown in Table 1. After thorough investigation, urs-12-ene-3β,25,30-triol (2) is herein described for the first time.
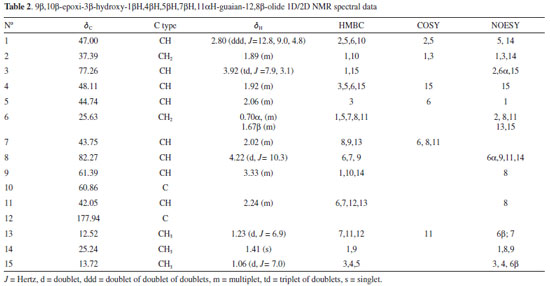
9β,10β-epoxi-3β-hydroxy-1βH,4βH,5βH,7βH,11αH-guaian-12,8β-olide (10) Compound 10 was isolated from chloroform extract of S. crassifolia roots, as a colorless wax, soluble in chloroform. The ESI-MS showed a [M+H-H2O]+ peak at m/z 441.3737 (calcd. for C30H49O2, 441.3727) and a [2M+H]+ peak at m/z 917.7671 (calcd. for C60H101O6, 917.7593). The 1H NMR spectra of 10 (Figure 11S) showed doublets at δH 1.23 (d, J = 6.9 Hz, 3H) and at δH 1.06 (d, J = 7.0 Hz, 3H), and a singlet at δH 1.41, which were attributed to three methyl groups. A doublet at δH 4.22 (d, J = 10.3 Hz, 1H) and a triplet of doublets at δH 3.92 (td, J = 7.9, 3.1 Hz, 1H) were associated with the hydrogen atoms H-8 and H-3, respectively. A peak at δH 2.80 presented as a doublet of doublet of doublets (ddd, J = 12.8, 9.0 and 4.8 Hz) corresponding to H-1. The 13C NMR spectrum (Figure 12S) and DEPT-135 spectrum (Figure 13S) showed 15 carbon atoms which were assigned as three CH3, two CH2, eight CH and two C, allowing to conclude that 10 is a sesquiterpene. Among the carbon peaks, one refers to carbonyl group (δC 177.94), and four to C-O carbons (δC 60.86, δC 61.39, δC 77.26 and δC 82.27). After a first analysis of the contour maps, COSY, HSQC and HMBC it was possible to suggest the sequence CH3-CH-CH-CH-CH and CH-CH2-CH-CH2-CH for compound 10. According to Wu et al.,39 this type of sequences is characteristic of sesquiterpene lactones belonging to guaianolide class. This fact was confirmed after NMR spectral data analysis of 10, which were similar to those published for 9β,10β-epoxy-4α-hydroxy-1βH,11αH-guaian-12,8α-olide.39 Then, from the basic skeleton of a guaianolide, a detailed analysis of the 1D and 2D NMR spectra of 10 was performed in order to elucidate its chemical structure. Beginning with the lactone carbonyl peak at δC 177.94 (C-12) as a starting point, the HMBC contour map (Figure 15S) showed correlations with the hydrogen peaks at δH 2.24 (H-11) and at δH 1.23 (H-13). There was also a correlation among H-13 and the carbon peaks at δC 43.75 (C-7) and δC 42.05 (C-11). C-7 also correlated with H-8 (δH 4.22) and H-9 (δH 3.33). H-7 (δH 2.02) correlated with the carbon peaks at δC 82.27 (C-8), δC 61.39 (C-9) and at δC 12.52 (C-13). In addition, the peak at δH 3.33 (H-9) correlated with C-14 (δC 25.24) and C-10 (δC 60.86). Correlations between C-10 with the peaks at δH 1.89 and δH 2.80 were observed and they were attributed to H-2 and H-1, respectively. Based on the HSQC contour map (Figure 14S), the chemical shift of H-14 (δH 1.41), H-5 (δH 2.06), and H-6 (δH 0.70 and 1.67) could be determined. In HMBC, H-1 (δH 2.80) correlated with the carbon peaks at δC 44.74 (C-5), δC 37.39 (C-2) and at δC 25.63 (C-6). C-5 correlated with the hydrogen peaks at δH 1.06 (H-15) and at δH 1.92 (H-4). H-15 correlated with the carbon peaks at δC 48.11 (C-4) and 77.26 (C-3). COSY contour map (Figure 16S) showed correlations among the peak at δH 2.24 (H-11) with δH 1.23 (H-13) and δH 2.02 (H-7). H-7 correlated with the peaks at δH 1.67 (H-6) and δH 4.22 (H-8). Correlations were observed among H-6 (δH 0.70) and H-7 (δH 2.02), and H-5 (δH 2.06). H-4 (δH 1.92) correlated with H-15 (δH 1.06). Correlations were also observed between H-2 (δH 1.89) and H-3 (δH 3.92), as well as H-1 (δH 2.80) with H-2 (δH 1.89) and H-5 (δH 2.06). These correlations confirmed the attributions made from HSQC and HMBC contour maps. NOESY contour map (Figure 17S) showed that H-13 (δH 1.23) correlated with H-7 (δH 2.02) and H-6β (δH 1.67) indicating these atoms are on the same side of the molecule. The peak at δH 1.67 (H-6β) correlated with the peak at δH 1.06 (H-15). H-15 correlated with H-3 (δH 3.92) and H-4 (δH 1.92). Correlations were also observed between the H-9 (δH 3.33) with H-14 (δH 1.41), H-14 with H-1 (δH 2.80) and H-1 with H-5 (δH 2.06). After a thorough analysis of the 1D and 2D NMR spectral data all chemical shift assignments for hydrogen and carbon atoms of compound 10 were attributed (Table 2).
Although compound 10 was isolated as a waxy material, it was possible to obtain a monocrystal after its dissolution in ethanol, followed by slow evaporation of the solvent. The resulting crystal was then subjected to X-ray diffraction analysis, and its chemical structure was unequivocally confirmed. The compound was crystallized in the form of an orthorhombic structure containing nonsymmetrical space P212121, which indicated that the crystals were enantiomerically pure. Through the ORTEP40 image, the chemical structure of 10 was characterized as containing four condensed rings (Figure 2). The central ring is a unit of seven members (C1 and C5-C10), with all carbon atoms in sp3 hybridization. An epoxy grouping was observed between the C9 and C10 carbon atoms. The other five-carbon rings are connected sideways to the epoxy ring. One ring (C7, C8, C11, C12 and O3) is a lactone and the other (C1-C5) is a cyclopentane, both at envelope conformation. In the cyclopentane ring, the hydroxyl group bound at C3 interacts through hydrogen bridges with hydroxyl groups of other nearby molecules, forming a supramolecular chain (Figure 2). The description of crystal structure is in Supplementary material together with the main crystallographic data of 10 (Table 1S). Based on the X-ray and ORTEP data the structure conformation of compound 10 was established (Figure 2).
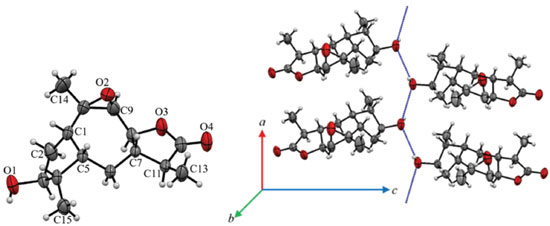 Figure 2. An ORTEP image (a) representative of the crystalline structure of 10 with atomic labeling. A circle represents carbon (black), hydrogen (white) and oxygen (red) atoms. (b) The blue dot line represents the hydrogen bond net in 10 between only hydroxyl groups that lead the formation of a supramolecular chain in its crystal packing
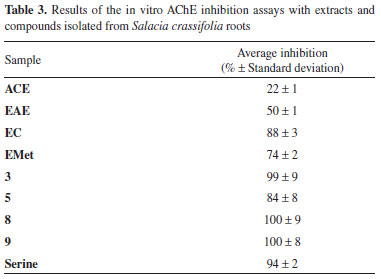
Based on the NMR features together with X-ray diffraction data the chemical conformation of 10 was established as being the 9β,10β-epoxi-3β-hydroxy-1βH,4βH,5βH,7βH,11αH-guaian-12,8β-olide (Figures 1 and 2). Compound 10 is hereby described for the first time. Crystal data of compound 10 C15H22O4, M (formula mass) = 266.32 g mol-1, orthorhombic, space group P212121, a = 5.6629(2) Å, b = 8.4104(3) Å, c = 29.4251(9) Å, V (unit cell volume) = 1401.44(8) Å3 , Z (No of formula units per unit cell) = 4, d (density) = 1.3 mg cm-3. The total number of measured independent reflections was 2863, of which 2458 were observed [F2 > 2σ(F2)]. Final indices: R = 0.0441 and wR = 0.1193, S = 1.046. *[R = σ||Fo|- |Fc||/σ|Fo|, where Fo is the observed structure factor and Fc is the structure factor calculated from proposed model; wR = [σw(|Fo|2-|Fc|2)2/σw|Fo|2]1/2, where w is a weighting factor defined as w = [σ2(Fo2)+(aP)2+bP] and P = [2Fc2+Max(Fo2,0)]/3; S = {σ[w(Fo2 - Fc2)2/(n-p)]}1/2 with n and p the number of reflections and the total number of refined parameters.] Crystallographic data of 10 has been deposited at Cambridge Crystallographic Data Center with CCDC reference number 1961806. Biological activity evaluation Acetylcholinesterase inhibition Cholinergic dysfunction has been widely studied and it is associated with early cognitive decline observed in patients with Alzheimer's disease due to premature loss of cholinergic neurons.41-43 This cognitive decline is due to decreased levels of the neurotransmitter acetylcholine (ACh), a chemical mediator of a series of neuronal functions, which is degraded in synaptic cleft by cholinesterases.44 One of these enzymes involved is acetylcholinesterase (AChE), which is key to restoring cholinergic neurotransmission by catalyzing hydrolysis of ACh in choline and acetic acid. Therefore, AChE regulates neurotransmission process and levels of acetylcholine in synaptic cleft.45 Currently, one of the strategies used in the treatment of Alzheimer's disease is therapy with anticholinesterase substances. To date, no treatments have been described that may interrupt or reverse the progression of Alzheimer's disease, but there are already drugs to inhibit AChE, thus increasing ACh activity and moderating the disease symptoms.46 Among the approved drugs are donepezil, rivastigmine and galantamine. Galantamine was developed from a natural source, consisting of an alkaloid extracted from species of Amaryllidaceae family.47 In addition to AChE inhibition, active molecules from natural sources may have other pharmacological properties, such as antioxidant activity, thus allowing them to be evaluated as a preventive form of Alzheimer's disease progression.46,48 In the present study, the ACE, EAE, EC and EMet extracts of the S. crassifolia roots together with compounds 3, 5, 8 and 9 were evaluated for inhibition of AChE. The extracts that induced greater inhibition of AChE were EC (88%), EMet (74%) and EAE (50%) (Table 3). According to Trevisan et al.,49 extracts that present inhibition equal to or greater than 50% are considered promising for obtaining pure compounds with potential activity for AChE inhibition. The compounds 3, 8 and 9 presented inhibition percentage similar or higher than that observed for serine (positive control), with values between 99-100%. Compound 5 also showed significant activity with 84% inhibition of AChE (Table 3).
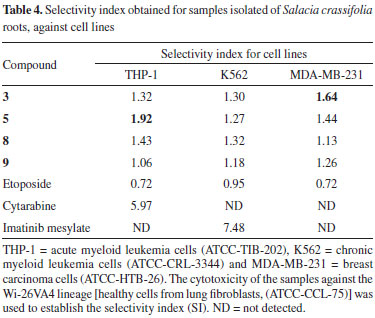
Cytotoxic activity Even with all technological and pharmaceutical development, cancer treatment remains a global problem.50 It was estimated that in 2018 there would be 18.1 million new cases and 9.6 million cancer deaths worldwide.51 In Brazil, it was estimated that 640 thousand new cases of cancer were diagnosed in 2018.52 Factors such as aging and population growth and also resistance to conventional treatment methods contribute to the increased incidence of cancer.51,53,54 Plants have contributed to the discovery of active substances for the treatment of various types of cancer. For example, vimblastine, vincristine and paclitaxel had been isolated from plants and they are among the most efficient chemotherapeutics available for cancer tratment.55 In the present work, some of the compounds obtained from S. crassifolia roots were submitted to cytotoxicity assays against THP-1, K562 and MDA-MB-231 tumor cell lines. All samples exhibited fair cytotoxicity (IC50 ≤ 78 µg mL-1) for all cell lines tested. However, none were more cytotoxic than the positive control (Table 2S). Regarding THP-1 cells, compound 5 showed the highest cytotoxicity activity (IC50 30.55 ± 1.30). Compound 3, 5 and 9 were the most cytotoxic for MDA-MB-231 cells. Samples tested did not show great selectivity when compared to the controls. Compound 5 exhibited the best SI against THP-1 among the samples, although inferior than cytarabine, and 3 was the most selective for MDA-MB-23 cells (Table 4).
Toxicity against Caenorhabditis elegans C. elegans is a free-living small nematode, easily observed by optical microscopy.56,57 Soon after hatching, they are 0.25 millimeters long and adults can reach up to 1 millimeter.58 It has a short life cycle, in three days the egg evolves at 25 ºC into an adult that already reproduces. C. elegans is hermaphrodite with self-fertilization, and males are found in low frequency in the population.59 For this reason, this nematode has been used as a model for in vivo toxicity assays.60 C. elegans model has proven to be very effective and advantageous due to its as small size, easy cultivation, low maintenance cost and fast reproduction.61 The results obtained using C. elegans are considered similar to those found using murine models, therefore it is a suitable alternative to traditional models.62 Samples from S. crassifolia (Figure 3) showed low toxicity at the tested concentration. The toxicity assay evaluated a 24-hour period of C. elegans survival rate. Rates were higher than 90% for all samples. A 20-days survival rate was also evaluated, and the results shown in Figure 4 considered the time needed for the death of 50% of the larval population. ACE caused the death of 50% of the worms in L4 stage in approximately two days. The other samples only induced the death of 50% of the nematodes after nineteen days. None of the tested samples exhibited toxicity against C. elegans (Figure 4). However, compound 5 inhibited more than 80% of nematodes reproduction in L4 stage, followed by 9 which inhibited 30%. The other compounds showed no inhibition to the reproduction of worms. ACE had the highest inhibition rate to C. elegans reproduction (Figure 5).
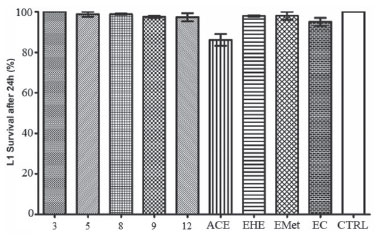 Figure 3. Survival graph of the C. elegans larvae at the L1 stage, 24 h after being exposed to samples obtained from roots of S. crassifolia. CTRL = control based on untreated animals
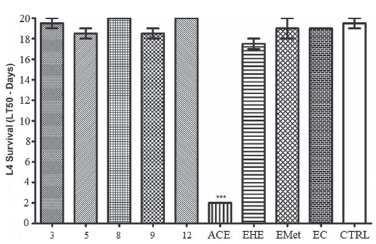 Figure 4. Survival graph (LT50) of C. elegans larvae at the L4 stage after being exposed to samples obtained from roots of S. crassifolia. CTRL = control based on untreated animals
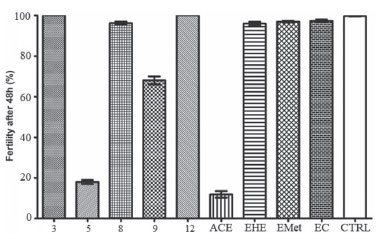 Figure 5. Graph of the fertility percentage of C. elegans larvae in the L4 stage, 48 hours after treatment with S. crassifolia samples. CTRL = control based on untreated animals
CONCLUSIONS From the roots of Salacia crassifolia, thirteen compounds were isolated. Two compounds are herein described for the first time, the sesquiterpene 9β,10β-epoxi-3β-hydroxy-1βH,4βH,5βH,7βH,11αH-guaian-12,8β-olide and the triterpene urs-12-ene-3β,25,30-triol. None of the evaluated compounds presented expressive toxicity against THP-1, K562 and MDA-MB-231 cell lines, nor in vivo toxicity against C. elegans. However, all the compounds tested showed significant inhibition of acetylcholinesterase and were considered promising for studies related to the treatment of Alzheimer's disease.
SUPPLEMTARY MATERIAL Complementary data (IR, NMR and crystallography) of compounds 2 and 10 and of the known compounds are available, free of charge, at http://quimicanova.sbq.org.br as PDF file.
ACKNOWLEGMENTS The authors thank the Conselho Nacional de Desenvolvimento Científico e Tecnológico (CNPq), Fundação Coordenação de Aperfeiçoamento de Pessoal de Nível Superior (CAPES) and Fundação de Amparo à Pesquisa do Estado de Minas Gerais (FAPEMIG) for financial suporte, and Dra. Maria O. Mercadante-Simões, Departamento de Biologia Geral, Centro de Ciências Biológicas e da Saúde, Universidade Estadual de Montes Claros, Minas Gerais, for collecting S. crassifolia roots.
REFERENCES 1. Bukhari, S. N. A.; Jantan, I.; Seyed, M. A.; Anti-Cancer Agents Med. Chem. 2015, 15, 681. 2. Simmons, M. P.: Cappa, J. J.; Archer, R. H.; Ford, A. J.; Eichstedt, D.; Clevinger C. C.; Mol. Phylogenet. Evol. 2008, 48, 745. 3. Salvador, J. A. R.; Leal, A. S.; Valdeira, A. S.; Gonçalves B. M. F.; Alho, D. P. S.; Figueiredo, S. A. C.; Silvestre, S. M.; Mendes, V. I. S.; Eur. J. Med. Chem. 2017, 142, 95. 4. Hill, R. A.; Connolly, J. D. T.; Nat. Prod. Rep. 2017, 34, 90. 5. Manna, P.; Sil, P. C.; Free Radical Res. 2012, 46, 815. 6. Yousef, B. A.; Hassan, H. M.; Guerram, M.; Hamdi A. M.; Wang, B.; Zhang, L. Y.; Jiang Z. Z.; Biomed. Pharmacother. 2016, 79, 112. 7. Antonisamy, P.; Duraipandiyan, V.; Ignacimuthu, S.; J. Pharm. Pharmacol. 2011, 63, 1070. 8. Corsino, J.; Carvalho, P. R. F.; Kato, M. J.; Latorre, L. R.; Oliveira, O. M. M. F. O.; Araújo, A. R.; Bolzani, V. S.; França, S. C.; Pereira, A. M. S.; Furlan, M.; Phytochemistry 2000, 55, 741. 9. Rodrigues, A. C. B. C.; Oliveira, F. P.; Dias, R. B.; Sales, C. B. S.; Rocha, C. A. G.; Soares, M. B. P.; Costa, E. V.; Silva, F. M. A.; Rocha, W. C.; Koolen, H. H. F.; Bezerra, D. P.; J. Ethnopharmacol. 2019, 231, 516. 10. Gomes, N. G. M.; Oliveira, A. P.; Cunha, D.; Pereira, D. M.; Valentão, P.; Pinto, E.; Araújo, L.; Andrade, P. B.; Molecules 2019, 24, 2530. 11. Tanabe, G.; Ueda, S.; Kurimoto, K.; Sonoda, N.; Shinsuke, M.; Ishikawa, F.; Xie, W.; Muraoka, O.; ACS Omega 2019, 4, 7533. 12. Carneiro, C. C.; Silva, C. R.; Menezes, A. C. S.; Pérez, C. N.; Chen-Chen, L.; GMR, Genet. Mol. Res. 2013, 12, 2167. 13. Silva, F. M. A.; Paz, W. H. P.; Vasconcelos, L. S. F.; Silva, A. L. B.; Silva-Filho, F. A.; Almeida, R. A.; Souza, A. D. L.; Pinheiro, M. L. B.; Koolen, H. F. K.; Biochem. Syst. Ecol. 2016, 68, 77. 14. Figueiredo, J. N.; Räz, B.; Séquin, U.; J. Nat. Prod. 1998, 61, 718. 15. Luo, D. Q.; Wang, H.; Tian, X.; Shao, H. J.; Pest Manage. Sci. 2005, 61, 85. 16. Jin, Y.; Wang, Y.; Zhao, D.; Ma, S.; Lu, J.; Immunopharmacol. Immunotoxicol. 2016, 38, 221. 17. Shaaban, A. A.; El-Kashef, D. H.; Hamed, M. F.; El-Agamy, D. S.; Int. Immunopharmacol. 2018, 59, 31. 18. Yu, M. H.; Shi, Z. F.; Yu, B. W.; Pi, E. H.; Wang, H. Y.; Hou, A. J.; Lei, C.; Fitoterapia 2014, 98, 143. 19. Rodrigues, V. G.; Duarte, L. P.; Silva, R. R.; Silva, G. D. F.; Mercadante-Simões, M. O.; Takahashi, J. A.; Matildes, B. L. G.; Fonseca, T. H. S.; Gomes, M. A.; Filho, S. A. V.; Quim. Nova 2015, 38, 237. 20. Espindola, L. S.; Dusi, R. G.; Demarque, D. P.; Braz-Filho, R.; Yan, P.; Bokesch, H. R.; Gustafson, K. R.; Beutler, J. A.; Molecules 2018, 23, 1494. 21. Brüning, R.; Wagner, H.; Phytochemistry 1978, 17, 1821. 22. Wang, Y.; Chen, W. S.; Wu, Z. J.; Zhong, X. X.; Biochem. Syst. Ecol. 2011, 39, 205. 23. Yousef, A. Y.; Hpzeifa, M. H.; Zhang, L. Y.; Jiang, Z.; Phytomedicine 2018, 40, 140. 24. Ellman, G. L.; Courtney K. D.; Andres, V.; Featherstone, R. M.; Biochem. Pharmacol. 1961, 7, 88. 25. Rhee, I. K.; Van de Meent, M.; Ingkaninan, K.; Verpoorte, R.; J. Chromatogr. A 2001, 915, 217. 26. Hjertstedt, J.; Hahn, B. L.; Kos, W. L.; Sohnle, P. G.; Mycoses 1998, 41, 487. 27. Mitchell, D. H.; Stiles, J. W.; Santelli, J.; Sanadi, D. R.; J. Gerontol. 1979, 34, 28. 28. Huang, R. E.; Ren, X.; Qiu, Y.; Zhao, Z.; PLoS One 2014, 9, e110957. 29. dos Santos, J. P.; Rodrigues, B. L.; Oliveira, W. X. C.; Silva, F. C.; de Souza, G. F.; Vieira Filho, S. A.; Duarte, L. P.; Silva, R. R.; J. Braz. Chem. Soc. 2019, 30, 1558. 30. Silva, G. D. F.; Duarte, L. P.; Paes; H. C. S.; de Sousa, J. R.; Nonato, M. C.; Portezani, P. J.; Mascarenhas, Y. P.; J. Braz. Chem. Soc. 1998, 9, 461. 31. De-Eknamkul, W.; Potduang, B.; Phytochemistry 2003, 62, 89. 32. Tezuka, Y.; Kikuchi, T.; Dhanabalasingham, B.; Karunaratne, V.; Gunatilaka, L.; J. Nat. Prod. 1994, 57, 270. 33. Likhitwitayawuid, K.; Bavovada, R.; Lin, L.; Cordell, G. A.; Phytochemistry 1993, 34, 759. 34. Shirota, O.; Morita, H.; Takeya, K.; Itokawa, H.; Iitaka, Y.; J. Nat. Prod. 1994, 57, 1675. 35. Rai, N.; Adhikari, B.; Paudel, A.; Masuda, K.; Mckelvey, R.; Manandhar, M.; J. Nepal Chem. Soc. 2006, 21, 1. 36. Hussein, G.; Nakamura, N.; Meselhy, M. R.; Hattori, M.; Phytochemistry 1999, 50, 689. 37. Cateni, F.; Zilic, J.; Zacchigna, M.; Procida, G.; Gaggeri, R.; Rossi, D.; Collina, S.; Chem. Phys. Lipids 2014, 181, 90. 38. Sukumar, E.; Balakrishna, K.; Bhima Rao, R.; Kundu, A. B.; Phytochemistry 1995, 38, 275. 39. Wu, H.-B.; Wang, W.-S.; Liu, T.-T.; Jiao, Y.-G.; Helv. Chim. Acta 2014, 97, 88. 40. Burnett, M. N.; Johnson, C. K.; ORTEP-III: Oak Ridge Thermal Ellipsoid Plot Program for Crystal Structure Illustrations, Oak Ridge National Laboratory Report ORNL-6895: Tennessee, 1996. 41. Bartus, R. T.; Dean, R. L.; Beer, B.; Lippa, A. S.; Science 1982, 217, 408. 42. Craig, L. A.; Hong, N. S.; McDonald, R. J.; Neurosci. Biobehav. Rev. 2011, 35, 1397. 43. Tarawneh, R.; Holtzman, D. M.; Cold Spring Harbor Perspect. Med. 2012, 2, a006148. 44. Colovic, M. B.; Krstic, D. Z.; Lazarevic-Pasti, T.; Bondzic, A. M.; Vasic, V. M.; Curr. Neuropharmacol. 2013, 11, 315. 45. Ventura, A. L. M.; Abreu, P. A.; Freitas, R. C. C.; Sathler, P. C.; Loureiro, N.; Castro, H. C.; Revista de Psiquiatria Clinica 2010, 37, 74. 46. Sahoo, A. K.; Dandapat, J.; Dash, U. C.; Kanhar, S.; J. Ethnopharmacol. 2018, 215, 42. 47. Heinrich, M.; Lee Teoh, H.; J. Ethnopharmacol. 2004, 92, 147. 48. Ayaz, M.; Sadiq, A.; Junaid, M.; Ullah, F.; Subhan, F.; Ahmed, J.; Front. Aging Neurosci. 2017, 9, 168. 49. Trevisan, M T. S.; Macedo, F. V. V.; Meent, M.; Rhee, I. K.; Verpoorte, R.; Quim. Nova 2003, 26, 301. 50. Sabnis, R. W.; Stud. Nat. Prod. Chem. 2018, 61, 85. 51. Seyed, M. A.; Jantan, I.; Bukhari, S. N.; Vijayaraghavan, K.; J. Agric. Food Chem. 2016, 64, 725. 52. Bray, F.; Ferlay, J.; Soerjomataram, I.; Siegel, R. L.; Torre, L. A.; Jemal, A.; Ca-Cancer J. Clin. 2018, 68, 394. 53. http://www1.inca.gov.br/estimativa/2018/introducao.asp, accessed in April 2020. 54. Shanmugam, M. K.; Lee, J. H.; Chai, E.; Mathi, K. M.; Semin. Cancer Biol. 2016, 40, 35. 55. Yuan, R.; Hou, Y.; Sun, W.; Yu, J.; Liu, X.; Niu, Y.; Lu, J. J.; Chen, X.; Ann. N. Y. Acad. Sci. 2017, 1401, 19. 56. Thomford, N. E.; Senthebane, D. A.; Rowe, A.; Munro, D.; Seele, P.; Maroyi, A.; Kevin, D.; Int. J. Mol. Sci. 2018, 19, 1578. 57. Brenner, S.; Genetics 1974, 77, 71. 58. Félix, M. A.; Braendle, C.; Cutter, A. D.; PLoS One 2014, 9, e0118327. 59. Kobet, R. A.; Pan, X.; Zhang, B.; Pak, S. C.; Asch, A. S.; Lee, M. H.; Biomol. Ther. 2014, 22, 371. 60. Leung, M. C. K.; Williams, P. L.; Benedetto, C. A.; Helmcke, K. J.; Aschner, M.; Meyer, J. N.; Toxicol. Sci. 2008, 106, 5. 61. Arvanitis, M.; Glavis-Bloom, J.; Mylonakis, E.; Curr. Opin. Pharmacol. 2013, 13, 769. 62. Kennedy, M. W. In Ascaris: The Neglected Parasite; Holland, C., ed.; Academic Press: Cambridge, 2013, ch. 3. |
On-line version ISSN 1678-7064 Printed version ISSN 0100-4042
Qu�mica Nova
Publica��es da Sociedade Brasileira de Qu�mica
Caixa Postal: 26037
05513-970 S�o Paulo - SP
Tel/Fax: +55.11.3032.2299/+55.11.3814.3602
Free access


