Artigo
| Multivariate analysis of digital images as an alternative to monitor dye degradation by the fenton process |
|
Victor Hugo Jacks Mendes dos SantosI,II,*,#, Darlan PontinI,II, Gabriele Sória OliveiraI, Tiago de Abreu SiqueiraII,# and Marcus SeferinI,#
I. Escola Politécnica, Pontifícia Universidade Católica do Rio Grande do Sul, 90619-900 Porto Alegre - RS, Brasil Recebido em 04/12/2019 *e-mail: victor.santos@pucrs.br The present work proposed the application of a multivariate regression model based on image data to monitor the decolorization process. Thus, a PLS regression based on the color histogram was applied to monitor the methylene blue degradation by the Fenton reaction. The results obtained by the digital imaging and UV-Vis methods were compared and the initial (Co) and final (C) methylene blue concentrations, as well as the kinetic parameters, coefficients of determination (R2), half time degradation (t½), intercept (ρ), and slope (σ), were evaluated. From our results, the digital imaging and UV-Vis methods have equivalent potential to monitor the color removal profile, similar kinetic term, and low measurement errors. While the coefficient of determination (R2) of all PLS models and kinetics curves are close to 1.00, the half time degradation (t½) parameter ranged between 0.29 to 1.39 min for the UV-Vis model, and 0.80 min to 2.17 min for the digital imaging model. Furthermore, the efficiency of methylene blue removal ranged between 92.04% and 97.78% for the UV-Vis model and 91.30% to 93.72% for the digital imaging model. Then, based on statistical comparison tests, it was concluded that the digital imaging method is an alternative to monitor dye degradation processes. INTRODUCTION Dyes comprise a large class of chemicals with chromophore and auxochrome groups that strongly absorb light and stably promote color sensations.1,2 Dyeing generates large amounts of colored effluent with high organic load and poor biodegradability.3,4 Although the removal of wastewater color is the main concern, reducing the organic content is also important for human health and environmental protection.5-7 Thus, as biostabilization and conventional treatment methods have low efficiency to reduce color and organic load in the effluent,7-9 advanced oxidation processes (AOP) are described as alternatives to wastewater treatment due to their efficiency in promoting mineralization of refractory organic compounds.7 AOPs constitute a group of processes with complex oxidation chains, involving single or multiple simultaneous reaction systems with the intent to generate hydroxyl free radicals (•OH).1 Among AOPs, the Fenton reaction comprises methods with the technological potential and flexibility to promote chemical oxygen demand and color removal, generating hydroxyl radicals from H2O2 decomposition by Fe2+ (Fenton), Fe3+ (Fenton-like) and Fe0/FenOm (heterogeneous Fenton) reagents, and that can be intensified by ultrasound (sono-Fenton), light (photo-Fenton), and electricity (electro-Fenton).10-12 The Fenton process has been applied in several dye degradation studies.13-20 In the Fenton process, hydrogen peroxide (H2O2) is decomposed by Fe2+ species, producing hydroxyl radicals, following the Haber-Weiss mechanism presented in Equation 1.  Dyes, such as Reactive Black,13 Orange G,14 C. I. Acid Yellow,3 Direct Red,15 Amido Black 10B,7 Magenta MB,16 methyl orange,17 brilliant green,18 malachite green,19 and methylene blue,20 were efficiently removed from wastewater by the Fenton process. Methylene blue (C16H18ClN3S.3H2O) is one of the most studied cationic dyes and is useful in areas such as clinical medicine, cosmetic dyes, and textile dyes.21-24 Although methylene blue is not associated with high human toxicity, it still constitutes an environmental pollutant and must be removed from wastewater before being released into water resources.20 Several spectroscopic techniques for dye analysis are described in the literature. Among them, ultraviolet-visible spectroscopy (UV-Vis) is the analytical technique most commonly used to monitor dye degradation due to its cost, simplicity and easy data handling.25 Additionally, by combining UV-Vis with data analysis methods, it is possible to deal with interferences in colored effluents, avoid misinterpretations, and improve the fit of the analytical model.25-29 However, although the costs are relatively low, the UV-Vis spectrophotometer still requires a laboratory infrastructure and maintenance resources that may not be accessible. Visual perception has always been one of the most powerful tools in exploratory science, and at some point, many of the known scientific methods use imaging resources.30 However, using data analysis tools for image processing, modeling, and exploration is necessary to refine the extraction of chemical information from the images. Thus, the combination of digital imaging devices with data processing methods can become an alternative for laboratory and field monitoring studies.31,32 Digital imaging methods are fast, non-destructive, easy to handle, and generate large amounts of data, perfectly compatible with multivariate tools.30,33 From this combination, low-cost instrumentation and control systems can be developed through real-time online imaging devices.34 Many studies on image-based analytical methods have been performed using a multivariate approach for exploratory (multivariate image analysis - MIA)34-36 and quantitative (multivariate image regression - MIR)37-42 analysis of digital,41-43 multispectral,37 and hyperspectral44,45 images. However, despite all the advantages, the main obstacle for conducting studies using digital images is the need for trained human resources capable of handling large data sets to extract physical and chemical information from the pixel array. One of the simplest approaches to image analysis is using the primary Red-Green-Blue (RGB) color space available in almost all electronic image capturing devices. In a three-dimensional arrangement, the pixel coordinate is given by the X and Y axes, while Z is related to the color channel (RGB), numerically characterized from 0 to 255.39 From combining the RGB channels, it is possible to cover all the visible color grid.46,47 Nevertheless, many multivariate methods cannot handle three-dimensional data arrays; therefore, data transformation procedures may be required. Thus, one of the simplest ways to deal with image data is from color histograms.47-52 The histogram is obtained by unfolding the image into two-dimensional arrays that represent the statistical distribution of pixel counts relative to color components (RGB channels).31,49 Although color histograms have no direct physical or chemical significance, they can be applied as input data to build useful multivariate models through proper data handling.41,42 To date, color histograms have been applied to develop chemometrics models for pattern recognition and adulteration control, but only a few studies assess the potential of this approach for quantitative purposes and dynamic process analysis. Thus, the present work describes the application of a multivariate regression model based on the color histogram of images to monitor methylene blue decolorization by Fenton's reaction and conduct a preliminary kinetic study of the degradation process. Therefore, we propose a combination of digital imaging devices (universally available) with data processing methods as an alternative for laboratory and field monitoring studies of dye degradation.
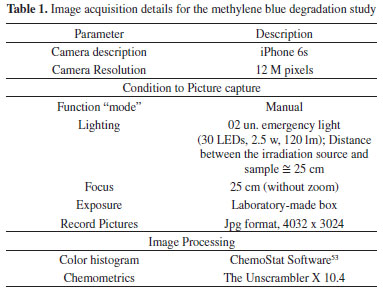
EXPERIMENTAL The combination of digital imaging devices with data processing methods can become an alternative to monitor decolorization processes. In this work, we proposed to use a multivariate model based on digital image data to monitor methylene blue degradation by the Fenton process. To validate the proposed method, all digital imaging method results (model accuracy and kinetics parameters) were compared with UV-Vis outcomes. Materials All chemicals were used without further purification. The reagents are methylene blue trihydrate (>95%), iron (II) sulfate heptahydrate (99%), hydrogen peroxide (30%), sulfuric acid (98%), and sodium hydroxide (98%). Instrumentation The instrumentation is divided into two parts: the reference method using UV-Vis spectroscopy and the alternative method using digital imaging, both briefly detailed below. UV-Vis spectroscopy UV-Vis measurements were performed on a Hewlett Packard 8453 spectrometer using a 200-800 nm spectral range, 1 nm resolution, and quartz cell (1 cm optical path). Digital imaging method Image acquisitions were made with an iPhone 6s through a small hole in a photo box and using a 25 cm focal length. The samples were placed inside a wooden box (30 x 25 x 25 cm) to reduce the influence of external light and standardize the image acquisition conditions. Five faces of the photo box (top and sides) were painted black to prevent light scattering, while the base was painted white to improve contrast and color perception. To standardize lighting conditions, the photo box was illuminated by two 30-LED emergency lights with a 45° tilt angle. The image acquisition details are described in Table 1. The camera parameters were not evaluated, and the images were acquired in the device's standard configuration (iPhone 6S).
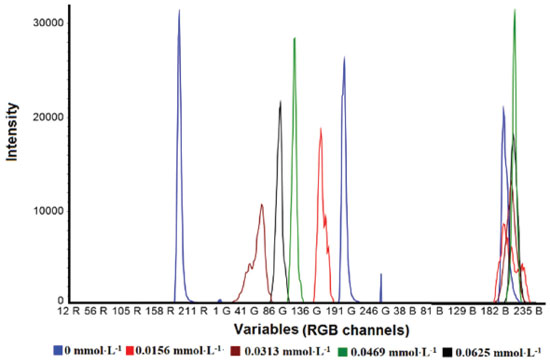
Multivariate regression model Before using the digital imaging method to monitor dye decolorization by the Fenton process, it is necessary to calibrate and validate the multivariate regression model to assess its potential application. The multivariate regression method applied in this study was Partial Least Square Regression (PLS). PLS is a chemometrics tool that aims to optimize the covariance relationship (X/Y) between predictive input (X variables) and response property (Y) using latent variables (factors) and loadings weights.35,53 To develop the multivariate regression model, 31 methylene blue solutions with different concentrations were prepared, 20 samples for calibration (from 0.0000 to 0.06253 mmol L-1) and 11 for validation (from 0.00469 to 0.05471 mmol L-1). UV-Vis chemometrics procedure Prior to chemometric analysis, UV-Vis spectra in the 400-800 nm range were preprocessed by smoothing, using the Savitzky−Golay method with 11 point windows. For PLS regression, the NIPALS algorithm was used with mean-centered data. Digital image chemometrics procedure Prior to chemometric analysis, the image was unfolded into the RGB color histogram using ChemoStat® v.1.0.1.4 open source software.54 Image processing was performed by selecting a 400 × 400 pixel region of interest around the central pixel. Three images were captured for each sample, and the average color histogram was used as input data for multivariate analysis. The color histogram profiles of methylene blue solutions with different concentrations are shown in Figure 1.
For PLS regression, the NIPALS algorithm was used with mean-centered data. All 256 color variables (0-255) of the Blue and Green channels were used as input data for the multivariate model. From the Red channel, the first three variables were removed and the 253 remaining (3-255) were used in the PLS regression. The red variables (0-2) were removed due to their high pixel counts, which reduce the sensitivity of the others. Methylene blue degradation The Fenton reaction for dye degradation was performed in a 250 mL beaker, using 100 mL of methylene blue (20 mg L-1) solution, different concentrations of Fe2+ and H2O2 at room temperature, pH 3, and constant magnetic stirring. The reactions were monitored for 20 minutes and sixteen periodic samples were applied to evaluate the reduction of dye concentration. Eight methylene blue decolorization Fenton reactions (Table 1S) were monitored for each method (UV-Vis and digital imaging), totaling 16 independent reactions. As reaction parameters of the Fenton reaction, two levels of initial H2O2 concentration (0.586 and 0.879 mmol L-1) and two levels of Fe (II) (0.073 and 0.146 mmol L-1) were used, while the methylene blue concentration was maintained constant in all tests (0.0625 mmol L-1). Then, Reactions 1 to 4 were used to evaluate the sensitivity of the imaging method using the two levels of H2O2 and Fe (II) to promote color removal, while Reactions 4 to 8 (five replicates) were used to evaluate the reproducibility and equivalence between the digital imaging and UV-Vis methods. Fenton reaction kinetics The study of decolorization kinetics is fundamental to optimizing the dye degradation process. Thus, as the processes of dye degradation by AOPs are not always well represented by first- and second-order kinetics equations, the present work applied Equation 2, which is described in the literature as suitable for studies involving wastewater decolorization by the Fenton reaction.3,55  In Equation 2, Cois the initial dye concentration and C is the remaining dye concentration at a given reaction time. The intercept ρ (minutes) and slope σ (dimensionless) are the kinetic terms of the equation, respectively related to the initial decay rate and oxidative capacity.3,55 To solve the equation and find the kinetic terms (ρ and σ), it is necessary to linearize Equation 2 to the form of Equation 3.  Thus, the results obtained by the digital imaging and UV-Vis methods were compared and the initial (Co) and final (C) concentrations of methylene blue, as well as the coefficients of determination (R2), half time degradation (t½), intercept (ρ), and slope (σ) were evaluated. Data analysis Image processing to obtain the color histograms was performed using ChemoStat® v.1.0.1.4 open access software,54 while Unscrambler X 10.4 (CAMO) software was used to perform multivariate analysis of the color histogram and UV-Vis spectra.
RESULTS AND DISCUSSION The results of this work were divided into calibration and validation of multivariate models and monitoring methylene blue degradation by the Fenton process. Calibration and validation of multivariate models Before using the digital imaging method to monitor dye decolorization by the Fenton process, it is necessary to calibrate and validate the multivariate regression model. Then, the color histogram of the calibration and validation samples were applied as input data to the PLS regression model. The same procedures for developing multivariate models were also performed with UV-Vis data as the reference method. Thus, the model parameters obtained by the digital imaging and UV-Vis methods are presented in Table 2.
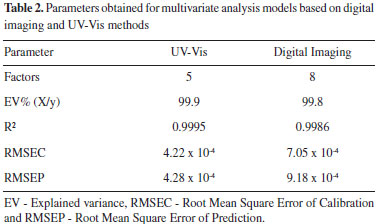
The best PLS regression with UV-Vis data was obtained using 5 factors (99.9% of explained variance) and presented an R2 of 0.9995, Root Mean Square of Calibration (RMSEC) of 4.22 x 10⁻⁴ and Root Mean Square of Prediction (RMSEP) of 4.28 x 10⁻⁴, while the optimal model for digital image data requires 8 factors (99.8% of explained variance) and exhibited an R2 of 0.9986, RMSEC of 7.05 × 10⁻⁴ and RMSEP of 9.18 × 10⁻⁴. Multivariate models were optimized based on the RMSEP of the external validation set. Thus, PLS models obtained by UV-Vis (5 factors) and digital imaging (8 factors) methods presented the smallest measurement errors (RMSEP) for samples not included in the calibration model (V1 to V11). Figure 2 shows the PLS regression models obtained by the UV-Vis (Figure 2A) and digital imaging (Figure 2C) methods, as well as their respective first-factor loadings (Figure 2B and Figure 2D).
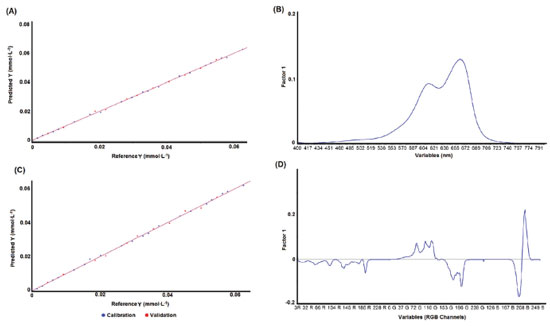 Figure 2. PLS regression for methylene blue quantification: A) UV-Vis method, B) UV-Vis loading, C) digital imaging method and D) digital image loading
Figure 2 shows that the PLS model fits the UV-Vis (Figure 2A) and digital imaging (Figure 2C) data, presenting good coefficients of determination (R2 > 0.998) and low measurement errors (RMSEC and RMSEP). Variables between 520-720 nm, with a maximum at 665 nm, presented the highest loading for the UV-Vis PLS model (Figure 2B). These variables include the spectral region of methylene blue with the highest absorbance and are the most sensitive to color changes.21-24 For the PLS model based on digital image data, the Blue and Green channels are the most important for PLS regression due to their high loadings. Therefore, the GB (Green-Blue) channels of the color histogram are more sensitive to changes in color perception of methylene blue at different concentrations. It is also important to evaluate the measurement error profile presented by both methods (UV-Vis and digital imaging). The reference and predicted values obtained from digital image data are shown in Table 3, while the UV-Vis results are available in Table 2S in the supplementary material.
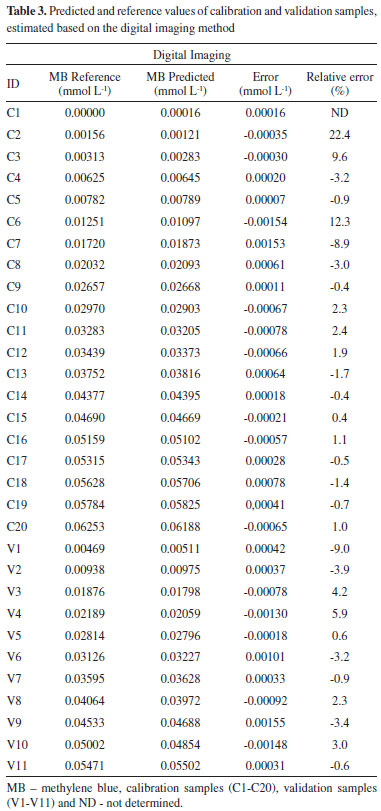
From the RMSEC and RMSEP data, it was concluded that both PLS models (UV-Vis and digital imaging) present errors on the same order of magnitude (10-4). From Table 3, the digital imaging model has low measurement errors, with a maximum difference of ± 0.0015 mmol L-1 between predicted and reference values. Thus, from Student's t-test, it was concluded that there is no significant difference between UV-Vis and digital imaging measurement errors. Furthermore, Figure 1S (Supplementary Material) shows that data from both methods (UV-Vis and digital imaging) have a random error profile and no systematic errors were observed, regardless of the methylene blue concentration. From our results, it was concluded that both methods (UV-Vis and digital imaging) can identify the color profile of methylene blue solutions within the delimited range (0.0000 to 0.06253 mmol L-1). Moreover, both models have good predictive accuracy, with good coefficients of determination (R2 > 0.998) and low measurement errors (RMSEC and RMSEP). PLS models were applied to monitor methylene blue decolorization by the Fenton reaction and to conduct a preliminary kinetic study of the degradation process. Monitoring methylene blue degradation by the Fenton process After calibrating and validating the multivariate models based on UV-Vis and digital image data, monitoring methylene blue dye decolorization was performed by applying PLS regression models. The initial concentration of methylene blue solution was 20 mg L-1 (0.06253 mmol L-1) and all reactions presented in Table 1S (Supplementary Material) were monitored by both methods (UV-Vis and digital imaging). Reactions were monitored for 20 minutes and sixteen periodic samples were taken to evaluate the reduction of dye concentration. Thus, Figure 3 illustrates the color removal profile obtained by the digital imaging method throughout the degradation process.
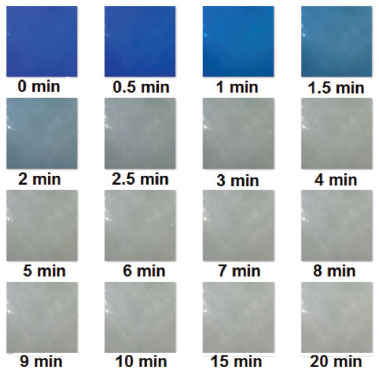 Figure 3. Digital image sequence obtained during Fenton reaction monitoring
Figure 3 shows that the color of the methylene blue solution fades rapidly in the first minutes of degradation (0 to 2 minutes), and after this period (2.5 to 20 minutes), it is difficult for the naked eye to notice significant changes in color. The decolorization profile of methylene blue observed in Figure 3 is similar to that described in the literature, but to assess the extent of the degradation reaction it is necessary to apply sensitive and reproducible analytical methods using appropriate strategies and equipment.20,24 Thus, the PLS models obtained in this work, developed based on the UV-Vis and digital image data, were applied to monitor dye degradation and the results are shown in Figure 4.
 Figure 4. Monitoring methylene blue degradation by the Fenton reaction: A) UV-Vis method and B) digital imaging method
Figure 4 shows that UV-Vis (Figure 4A) and digital imaging (Figure 4B) methods have similar decolorization profiles, with all proposed reactions (Reactions 1 to 8) promoting a final removal of methylene blue higher than 90%. Thus, the reaction profile (Figure 4A and 4B) indicates that the digital imaging model can obtain a similar chemical information as the UV-Vis method for the monitored system. From Reactions 1 to 4, it was expected to observe the effect of different levels of Fe2+ and H2O2. While iron (Fe2+) content are expected to influence on the initial dye decay rates, the hydrogen peroxide (H2O2) dosage usually regulate the reaction extent and final color removal.3,55 However, no significant variables influence were observed from our results. Fenton reaction kinetics After calibrating the PLS models and preliminary evaluation of the decolorization profile obtained by both methods (UV-Vis and digital imaging), it is also important that the PLS models obtain similar kinetic parameters for the methylene blue degradation process. Thus, the initial (Co) and final (C) concentrations of methylene blue, as well as the coefficients of determination (R2), half time degradation (t½), intercept (ρ) and slope (σ) were evaluated. Figure 5 shows the kinetics curves for Reactions 1 to 8 based on Equation 3.
 Figure 5. Kinetics curve of methylene blue degradation: A) UV-Vis method and B) digital imaging method
Figure 5 shows that UV-Vis (Figure 5A) and digital imaging (Figure 5B) methods have similar kinetics curve profiles. Then, the kinetics terms ρ and σ, as well as the coefficient of determination (R2), for each reaction were obtained from the kinetics curves, while the half time degradation (t½) was estimated using Equation 3 and the final concentrations of methylene blue (C) were measured directly by the respective PLS model (UV-Vis and digital imaging) at the final monitoring time (20 minutes). Thus, the results of the preliminary kinetics study are shown in Table 4.
From Figure 5 and Table 4, it was concluded that the kinetics model represented by Equation 3 is adequate to evaluate methylene blue degradation by the Fenton process since all reactions presented a coefficient of determination (R2) close to 1. For the half time degradation (t½) parameter, a minimum of 0.29 min and a maximum of 1.39 min were obtained for the UV-Vis model, and a minimum of 0.80 min and a maximum of 2.17 min for the digital imaging model. The efficiency of methylene blue removal had a minimum of 92.04% and a maximum of 97.78% for the UV-Vis model and a minimum of 91.30% and a maximum of 93.72% for the digital imaging model. Initially, UV-Vis appears to be more sensitive than the digital imaging method to monitor the initial color decay. However, these results may be related to experimental issues, since the measurement by UV-Vis is not instantaneous and requires the transfer of the solution to the equipment cuvette, while the measurement by digital image is taken instantly at the sampling time. Since this delay in the measurement time can be important to the estimated methylene blue concentration, especially in early sampling time, the equivalence between the techniques (UV-Vis and digital imaging) will be posteriorly evaluated by means of statistical equivalence test and reaction replicate data (Reactions 4 to 8). Reactions 1 to 4 were applied to evaluate whether both methods (UV-Vis and digital imaging) could evaluate the effect of different Fe2+ and H2O2 levels on methylene blue degradation. Comparing the results obtained by the monitoring methods (UV-Vis and digital imaging) when changing the dosages of Fenton's reagents (Fe2+ and H2O2), both methods have similar response profiles. From the kinetic term ρ, Fe2+ has a greater influence on initial dye decay rates, but higher levels of H2O2 also accelerate the process of methylene blue degradation. From the kinetic term σ, all reactions have similar oxidative capacity within the monitored time (20 minutes). Thus, it was not possible to significantly correlate the changes in σ with the different Fe2+ and H2O2 levels applied. Although the UV-Vis model appears to be slightly more sensitive than the digital imaging method for detecting initial decay rates, a discussion on the equivalence between the methods (UV-Vis and digital imaging) is conducted below based on the reaction quintuplicate (Reactions 4 to 8) and appropriate statistical tests. Evaluation with replicates is necessary to consider the variability of methylene blue degradation by the Fenton process as each of the 16 monitored reactions (8 by UV-Vis model and 8 by digital imaging model) are independent processes. After assessing the accuracy of the digital imaging method for predicting methylene blue concentration, monitoring the degradation process and performing a preliminary kinetics study, it is also necessary to prove that the PLS model based on the color histogram is equivalent to the UV-Vis reference method. Reactions 4 to 8 (five replicates) were used to evaluate the reproducibility and equivalence of the digital imaging and UV-Vis methods. Two replicates of each calibration model are plotted in Figure 6 to demonstrate similarity between them, while the parameters (C and t½) and kinetic terms (ρ and σ) were analyzed using Student's t-test, to evaluate the equivalence between the methods (UV-Vis and digital imaging) based on data from the five replicas.
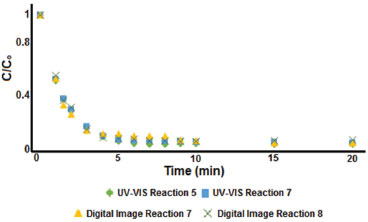 Figure 6. Comparison of the methylene blue decolorization curve obtained by UV-Vis and digital imaging methods
From our results, the digital imaging and UV-Vis methods have equivalent potential to monitor color removal profile, similar kinetics equation terms, and low measurement errors. According to Student's t-test results, all parameters are statistically equivalent (σ and C with a 95% confidence level and ρ and t½ with a 99% confidence level). Thus, it has been shown that color histograms can be applied as multivariate input data for robust model calibration, and the combination of digital imaging devices with data processing methods is an alternative for laboratory and field monitoring studies of dye degradation.
CONCLUSIONS The present work proposed combining digital imaging devices with data processing methods to monitor decolorization processes. A PLS regression model based on the color histogram of images was applied to monitor the decolorization of methylene blue by the Fenton reaction and to conduct a preliminary kinetics study of the degradation process. Thus, the results obtained by the digital imaging and UV-Vis methods were compared and the initial (Co) and final (C) methylene blue concentrations, as well as the coefficients of determination (R2), half time degradation (t½), intercept (ρ), and slope (σ), were evaluated. From our results, the digital imaging and UV-Vis methods have equivalent potential to monitor color removal profile, similar kinetics equation terms and low measurement errors. While the coefficient of determination (R2) of all PLS models and kinetics curves are close to 1.00, the half time degradation (t½) parameter ranged between 0.29 to 1.39 min for the UV-Vis model, and 0.80 min to 2.17 min for the digital imaging model. Furthermore, the efficiency of methylene blue removal ranged between 92.04% to 97.78% for the UV-Vis model and 91.30% to 93.72% for the digital imaging model. Then, based on statistical comparison tests, it was concluded that the digital imaging method is an alternative to monitor dye degradation processes. To our knowledge, this was the first application of digital image analysis to study dynamic processes such as the dye decolorization by the Fenton process. Thus, based on statistical comparison tests, it is concluded that the combination of digital imaging devices (universally available) with data processing methods is an alternative for laboratory and field monitoring studies of dye degradation. It is also possible to develop fast and inexpensive methods for process control and environmental monitoring and the proposed method can be adapted to monitor other colored systems. In order to advance the development of the proposed method to monitor the dye degradation process by Fenton reaction, future works should study the application of the proposed method in real wastewater samples, with matrix effect influence, monitor the degradation of other dyes, as well as evaluate different devices for acquiring digital images (e.g. digital camera, smartphones, scanners, and others) and the influence of image acquisition parameters (e.g. camera parameters, irradiation source, focal distance, among others).
SUPPLEMENTARY MATERIAL The supplementary material is available free of charge in the online version at http://quimicanova.sbq.org.br. Reactions conditions for methylene blue degradation by Fenton process (Table 1S), Predicted and reference values of calibration and validation samples, estimated based on digital imaging and UV-Vis methods (Table 2S) and Sample prediction error for multivariate models (Figure 1S).
ACKNOWLEDGMENTS The authors would like to thank the Pontifical Catholic University of Rio Grande do Sul for the infrastructure, the Hewlett Packard - HP (PUCRS) for the research scholarships and the Engineering and Materials Technology Graduate Program for the support.
REFERENCES 1. Gupta, V. K.; Suhas; J. Environ. Manage. 2009, 90, 2313. 2. Yagub, M. T.; Sen, T. K.; Afroze, S.; Ang, H. M.; Adv. Colloid Interface Sci. 2014, 209, 172. 3. Behnajady, M. A.; Modirshahla, N.; Ghanbary, F.; J. Hazard. Mater. 2007, 148, 98. 4. Behnajady, M.; Modirshahla, N.; Fathi, H.; J. Hazard. Mater. 2006, 136, 816. 5. Pandey, A.; Singh, P.; Iyengar, L.; Int. Biodeterior. Biodegrad. 2007, 59, 73. 6. Mohey El-Dein, A.; Libra, J. A.; Wiesmann, U.; Chemosphere 2003, 52, 1069. 7. Sun, J.-H.; Sun, S.-P.; Wang, G.-L.; Qiao, L.-P.; Dyes Pigm. 2007, 74, 647. 8. Yu, R.-F.; Chen, H.-W.; Cheng, W.-P.; Hsieh, P.-H.; J. Environ. Eng. (Reston, VA, U. S.) 2009, 135, 325. 9. Liu, J. T.; Gao, H.; Liu, S. J.; Adv. Mater. Res. (Durnten-Zurich, Switz.) 2011, 295, 1447. 10. Nidheesh, P. V.; Gandhimathi, R.; Ramesh, S. T.; Environ. Sci. Pollut. Res. 2013, 20, 2099. 11. Babuponnusami, A.; Muthukumar, K.; J. Environ. Chem. Eng. 2014, 2, 557. 12. Yoo, S. H.; Jang, D.; Joh, H.-I.; Lee, S.; J. Mater. Chem. A 2017, 5, 748. 13. Lucas, M.; Peres, J.; Dyes Pigm. 2006, 71, 236. 14. Cai, M.; Su, J.; Lian, G.; Wei, X.; Dong, C.; Zhang, H.; Jin, M.; Wei, Z.; Ultrason. Sonochem. 2016, 31, 193. 15. Harichandran, G.; Prasad, S.; Ultrason. Sonochem. 2016, 29, 178. 16. Xavier, S.; Gandhimathi, R.; Nidheesh, P. V.; Ramesh, S. T.; Desalin. Water Treat. 2015, 53, 109. 17. Wang, F.; Zhang, H.; Chen, Z.; Zhang, M.; Zhang, L.; 5th International Conference on Bioinformatics and Biomedical Engineering - IEEE, Wuhan, China, 2011. 18. Rao, C. V.; Giri, A. S.; Goud, V. V.; Golder, A. K.; Int. J. Ind. Chem. 2016, 7, 71. 19. Elhalil, A.; Tounsadi, H.; Elmoubarki, R.; Mahjoubi, F. Z.; Farnane, M.; Sadiq, M.; Abdennouri, M.; Qourzal, S.; Barka, N.; Water Resources and Industry 2016, 15, 41. 20. Jiménez-Lima, L.; Silva-Martínez, S.; Hernández, J. A.; Sierra, F. Z.; Alvarez-Gallegos, A.; Desalin. Water Treat. 2015, 55, 3646. 21. Melgoza, D.; Hernández-Ramírez, A.; Peralta-Hernández, J. M.; Photochem. Photobiol. Sci. 2009, 8, 596. 22. Zhang, L.; Nie, Y.; Hu, C.; Hu, X.; J. Hazard. Mater. 2011, 190, 780. 23. Liu, S.-T.; Huang, J.; Ye, Y.; Zhang, A.-B.; Pan, L.; Chen, X.-G.; Chem. Eng. J. (Amsterdam, Neth.) 2013, 215, 586. 24. Li, M.; Qiang, Z.; Pulgarin, C.; Kiwi, J.; Appl. Catal., B 2016, 187, 83. 25. Kalejahi, B. M.; Bahram, M.; Naseri, A.; Bahari, S.; Hasani, M.; J. Iran. Chem. Soc. 2014, 11, 241. 26. Fernández, C.; Callao, M. P.; Larrechi, M. S.; J. Hazard. Mater. 2011, 190, 986. 27. López-Cueto, G.; Ostra, M.; Ubide, C.; Zuriarrain, J.; Anal. Chim. Acta 2004, 515, 109. 28. Sales, F.; Callao, M. P.; Rius, F. X.; Chemom. Intell. Lab. Syst. 1997, 38, 63. 29. Naseri, A.; Ayadi-Anzabi, H.; Anal. Methods 2012, 4, 153. 30. Geladi, P.; Esbensen, K.; J. Chemom. 1989, 3, 419. 31. Diniz, P. H. G. D.; Dantas, H. V.; Melo, K. D. T.; Barbosa, M. F.; Harding, D. P.; Nascimento, E. C. L.; Pistonesi, M. F.; Band, B. S. F.; Araújo, M. C. U.; Anal. Methods 2012, 4, 2648. 32. dos Santos, P. M.; Pereira-Filho, E. R.; Anal. Methods 2013, 5, 3669. 33. Grasel, F. S.; Marcelo, M. C. A.; Ferrão, M. F.; RSC Adv. 2016, 6, 32358. 34. Duchesne, C.; Liu, J. J.; MacGregor, J. F.; Chemom. Intell. Lab. Syst. 2012, 117, 116. 35. Prats-Montalbán, J. M.; De Juan, A.; Ferrer, A.; Chemom. Intell. Lab. Syst. 2011, 107, 1. 36. Esbensen, K.; Geladi, P.; Chemom. Intell. Lab. Syst. 1989, 7, 67. 37. Lied, T. T.; Geladi, P.; Esbensen, K. H.; J. Chemom. 2000, 14, 585. 38. Lied, T. T.; Esbensen, K. H.; Chemom. Intell. Lab. Syst. 2001, 58, 213. 39. Yu, H.; MacGregor, J. F.; Chemom. Intell. Lab. Syst. 2003, 67, 125. 40. Ghasemzadeh-Barvarz, M.; Ramezani-Kakroodi, A.; Rodrigue, D.; Duchesne, C.; Ind. Eng. Chem. Res. 2013, 52, 12426. 41. Shariati-Rad, M.; Irandoust, M.; Mohammadi, S.; Chemom. Intell. Lab. Syst. 2016, 158, 48. 42. Botelho, B. G.; Dantas, K. C. F.; Sena, M. M.; Chemom. Intell. Lab. Syst. 2017, 167, 44. 43. Pierini, G. D.; Fernandes, D. D. S.; Diniz, P. H. G. D.; De Araújo, M. C. U.; Di Nezio, M. S.; Centurión, M. E.; Microchem. J. 2016, 128, 62. 44. Gosselin, R.; Rodrigue, D.; Duchesne, C.; Comput. Chem. Eng. 2011, 35, 296. 45. Vidal, M.; Amigo, J. M.; Chemom. Intell. Lab. Syst. 2012, 117, 138. 46. Lopez-Molinero, A.; Liñan, D.; Sipiera, D.; Falcon, R.; Microchem. J. 2010, 96, 380. 47. Domínguez, M. A.; Diniz, P. H. G. D.; Di Nezio, M. S.; De Araújo, M. C. U.; Centurión, M. E.; Microchem. J. 2014, 112, 104. 48. Costa, G. B.; Fernandes, D. D. S.; Almeida, V. E.; Araújo, T. S. P.; Melo, J. P.; Diniz, P. H. G. D.; Véras, G.; Talanta 2015, 139, 50. 49. Costa, G. B.; Fernandes, D. D. S.; Almeida, V. E.; Maia, M. S.; Araújo, M. C. U.; Véras, G.; Diniz, P. H. G. D.; Anal. Methods 2016, 8, 4949. 50. Marcelo, M. C. A.; Mariotti, K. C.; Ortiz, R. S.; Ferrão, M. F.; Anzanello, M. J.; Microchem. J. 2016, 127, 87. 51. Valderrama, L.; Valderrama, P.; Chemom. Intell. Lab. Syst. 2016, 156, 188. 52. Cruz-Fernández, M.; Luque-Cobija, M. J.; Cervera, M. L.; Morales-Rubio, A.; De La Guardia, M.; Microchem. J. 2017, 132, 8. 53. Wold, S.; Sjöström, M.; Eriksson, L.; Chemom. Intell. Lab. Syst. 2001, 58, 109. 54. Helfer, G. A.; Bock, F.; Marder, L.; Furtado, J. C.; Da Costa, A. B.; Ferrão, M. F.; Quim. Nova 2015, 38, 575. 55. Chan, K. H.; Chu, W.; Chemosphere 2003, 51, 305.
#Programa de Pós-Graduação em Engenharia e Tecnologia de Materiais |
On-line version ISSN 1678-7064 Printed version ISSN 0100-4042
Qu�mica Nova
Publica��es da Sociedade Brasileira de Qu�mica
Caixa Postal: 26037
05513-970 S�o Paulo - SP
Tel/Fax: +55.11.3032.2299/+55.11.3814.3602
Free access


