Artigo
| Vibrational spectroscopic investigation and molecular structure of a 5α-reductase inhibitor: finasteride |
|
Lin-Jie WangI,*; William B. ZengII; Song GaoIII
I. School of Chemical Engineering, Shengli College, China University of Petroleum, 257000 Dongying, Shandong Province, China Recebido em 26/11/2019 *e-mail: linjiewang1989@hotmail.com By way of Density Functional Theory (DFT)-based computational methods with commercially available software, the computational work of which about the molecular properties, the vibrational modes and vibrational frequencies of finasteride were accomplished for the first time. In order to gain a deeper and more thorough understanding of the molecular structure and infrared spectrum of finasteride, the equilibrium geometry harmonic vibrational frequencies and geometric parameters (bond lengths, bond angles and dihedral angles) were calculated by Generalized Gradient Approximations (GGAs) with five different density functional methods (PBE, RPBE, HCTH, PW91 and BLYP), using Material Studio 8.0 program. Theoretical vibrational frequencies and theoretical optimized geometric parameters were compared with the corresponding experimental data, which concluded that the GGA/PW91 method were shown to be in a good agreement with the results of experiment. In addition, the highest occupied molecular orbital (HOMO) energies, the lowest unoccupied molecular orbital (LUMO) energies and electron density isosurface calculations were done with an aim at a better understanding of the stability and reactivity of the molecule, indicating that the alkene and lactam conjugated system on the ring A is more likely to interact with other species. And, the atomic charge distribution was also calculated to understand the charge effect caused by electronegative atoms, which shows that the possible active-sites in chemical reactions are N1 and O1. INTRODUCTION Finasteride (FIN) belongs to the family compounds which referred to as 4-azasteroids, well-known as the most potent 5α-reductase enzyme inhibitor, an enzyme which could converts testosterone to dihydrotestosterone (DHT).1 It appears to be the most effective and widely used drug for the treatment of benign prostate hyperplasia and androgenetic alopecia (AGA), which is believed to be the first selected therapeutic drug for the treatment of benign prostate hyperplasia besides operation therapy.2-4 Finasteride have three crystal structures and six solvates,5-8 while form I is pharmaceutically preferred due to its better stability.7,9 The present study showed that finasteride has new pharmacodynamic activities in polycystic ovary syndrome (PCOS) therapy and the ability of reducing the risk of bladder cancer and high-grade prostate cancer,10-12 which could demonstrate the great research value of finasteride. In the pharmaceutical industry, the stability of the formulations and the drug-excipients compatibility studies have a great relationship with the structure and the spectroscopy and physicochemical properties in regard to orbital and atomic charge of the active pharmaceutical ingredient (API) molecules.13-15 Combined with the continuous increase of available computing capacities, density function theory (DFT) has been used to invest these on an atomistic level.16 Since the 1960s, when Quantitative Structure-Activity Relationship (QSAR) was proposed by Hansch, Fujita, Free and Wilson,17-19 the great progress have been made in drug molecular simulation, especially in the computer-aided drug design and molecular-property calculations. In 2011, Jasmine Gupta et al.20 successfully constructed the models for molecular dynamics simulation to develop the computational model to predict the miscibility of indomethacin with carriers. The simulation results were consistent with the experimental values, indicating that molecular dynamics simulation computation provided a molecular level insight into the underlying mechanisms and intermolecular energy contributions. It also has the potential application for selecting the lead excipients during development of amorphous formulations and minimizing the need for extensive physical stability assessment studies. Drug design by molecular simulation can improve medicinal properties and intellectual property value of certain drugs. Milan Remko accurately simulated stable conformations, solvent effect, pKa, lipophilicity, solubility, absorption and polar surface area of hypoglycemic agents.21 Such properties are very important factors for the designing of highly active ligands selectively acting on individual SUR receptors, and useful in design of new drugs in the treatment of non-insulin dependent diabetes mellitus. Above all, it is important to research the structure, spectroscopy and molecular properties of drug by using molecular modeling method, promoting the development of the pharmaceutical industry. However, to the best of our knowledge, there was no simulation study about finasteride published in the literature. And, for the topic of this study, there was almost no literature using Material Studio program. In this paper, the theoretical and experimental datas of finasteride studies have been performed to give a detailed description of the molecular structure and vibrational harmonic spectra of finasteride. Geometrical parameters and vibrational spectroscopic were calculated by five different density functionals of Generalized Gradient Approximations (GGAs) and compared with experimental results of finasteride compound (form I), which used to screen out the appropriate simulation functional for model molecular and discussion of the agreement. The frontier orbitals and electron density isosurface analysis was used to explain the most important orbital information of the title compound. Furthermore, Mulliken atomic charge analysis has been performed to understand the molecular information such as electron delocalization and intra-molecular charge transfer of finasteride. The presented study on finasteride can provide theoretical basis for the study of photostability and finding new indications, dosage forms and ligands. It also screened out an adaptive algorithm for finasteride improvement and application.
METHOD Experimental Finasteride was obtained from Hunan Qianjin Xiangjiang Pharm. Inc. (Hunan, China). The sample was recrystallized using absolute ethanol by slow evaporation method. FT-IR spectrum of powder Finasteride was recorded in the range of 4000-400 cm-1 on NICOLET 380 spectrometer using KBr pellet technique with a spectral resolution of 2.0 cm-1. Computer details The structural model and atom numbering scheme of finasteride molecule was given in Figure 1. Initial molecular structure of finasteride (form I, CCDC Code: WOLXOK02) which obtained from the Cambridge Crystallographic Database (CCDC, Cambridge, UK) with Conquest 1.8 software was used as a starting point for the calculation. The Generalized Gradient Approximations (GGAs) were performed to optimize the conformation of the molecular structure of Finasteride with PW91, PBE, RPBE, HCTH and BLYP functionals in vacuum condition. The convergence criteria was specified independently for maximum energy change, Max. force and Max. displacement, in which, 1x10⁻⁵ Hartree, 0.002 Hartree Å-1 and 0.005 Å, respectively. Frequencies and the Frontier Molecular Orbital were also calculated at the same level of theory as geometry optimizations and the mean absolute deviations between the calculated and observed for each method were compared. The absence of imaginary frequencies confirmed that the stationary points found correspond to real minima, instead of being saddle points. Mulliken population analysis on atomic charges was calculated using PW91 functional to find the active-site in molecular. All above calculations (vibrational wavenumbers, geometric parameters and molecular properties) were performed by using DMol3 module in Material Studio 8.0 program package.22 And all the vibrational frequencies calculated by different density functionals were assigned by Material Studio Visualizer module. Therefore, some assignments may correspond to its previous or next vibrational frequency value at other levels.
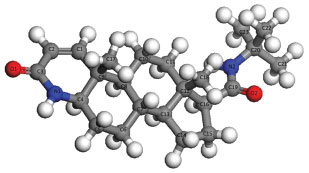 Figure 1. Molecular model and atom numbering scheme of finasteride
Kohn-Sham density functional theory (KS-DFT) is widely used for self-consistent-field electronic structure calculations of the ground-state properties of atoms, molecules, and solids.23-25 A first-principles numerical GGA can be constructed by starting from the second-order density-gradient expansion for the exchange-correlation hole surrounding the electron in a system of slowly varying density, then cutting off its spurious long-range parts to satisfy sum rules on the exact hole.26 In comparison with LSDA (local spin density approximation), GGAs tend to improve total energies,27 atomization energies,27-29 energy barriers and structural energy differences.30-32 PBE is the default exchange-correlation functional which is recommended, especially, for studies of molecules interacting with metal surfaces, although it is also fairly reliable for bulk calculations.25 The PW91 functional should be used for comparisons with literature data, as it is the most widely used GGA functional.33 Hammer, Hansen, and Norskov suggested a revised PBE (RPBE) functional, another nonlocal functional, which is a slightly modified version of PBE with different enhancement factor for exchange.34 HCTH is one of the Handy's family functionals including gradient-corrected correlation.35-37 The Becke-Lee-Yang Parr (BLYP) functional combines Becke's exchange functional with the correlation functional of Lee, Yang, and Parr (LYP).38,39
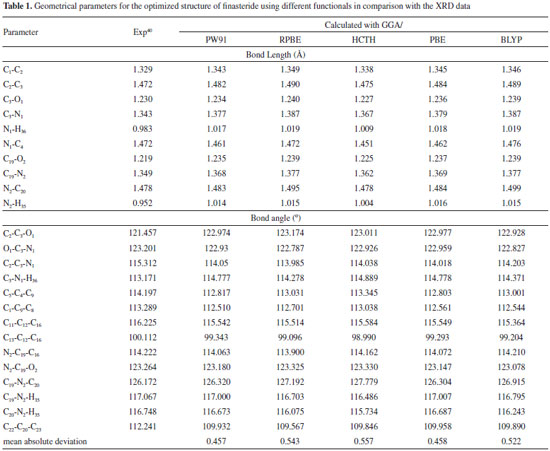
RESULTS AND DISCUSSION Molecular geometry The optimized structural parameter of finasteride calculated by GGA method with PW91, RPBE, HCTH, PBE and BLYP functuionals were listed in Table 1. Most of the optimized bond lengths and bond angles at GGAs level were slightly different to the experimental values, due to the model in theoretical calculations belong to isolated molecule in vacuum, while the experimental results were in crystal state. In the five density functionals, the optimized C-C bond lengths vary from 1.523 to 1.565 Å. The calculated bond lengths are located in the theoretical range which means the optimized structure is stable.41 Besides, all of the C-H bond lengths are longer than the experimental values.40 Maybe this can explain the reason that while the crystal structure parameters were determined by using the X-Ray single crystal diffractometer, the hydrogen atom was difficult to located, however, the theoretical calculation corrected this error. The C3-O1 bond length of 1.236 Å and N1-H36 of 1.018 Å are slightly larger than the experimental value. This is caused by the inter-molecular hydrogen bonding in crystalline state, which will reduce bond length due to the π-π conjugated effect.
Some significant differences of bond angles are seen between the calculated and experimental parameters. The increases in the angles C2-C3-O1 and C3-N1-H36 and the decreases in the angles H36-N1-C4 and O1-C3-N1 are due to the inter-molecular hydrogen bonding C-O···H and N-H···O, which influence the position of C-O and N-H. The decreases in the endo angels C5-C4-C9, C1-C9-C8, C11-C12-C16, C13-C12-C16 and C22-C20-C23 are due to the attachment of electron donating amino group and methyl group. The dihedral angles also determine the similarity between the calculated and experimental results (data not shown). C1-C2-C3-O1 dihedral angle is calculated as 167.889° (PBE), 169.211° (RPBE), 167.290° (HCTH), 167.854° (PW91) and 169.570° (BLYP), respectively. C3-N1-C4-C5 is calculated as 178.527° (PBE), 179.944° (RPBE), 178.071° (HCTH), 178.416° (PW91) and 178.889° (BLYP). The experimental data of the two decisive angles are 162.724° and 174.566°, respectively. Mean absolute deviations is conducted to linear regression analysis the differences between the theoretical and experimental structure parameters. As seen in Table 1, the bond lengths and angles are found to be similar between the finasteride molecules of the crystal and the calculated monomer. The mean absolute deviations between the calculated and experimental value of geometrical parameters are 0.457 for PW91, 0.543 for RPBE, 0.557 for HCTH, 0.458 for PBE, 0.522 for BLYP, respectively. Compared with the available experimental values,40 it is easy to find that GGA/PW91 shows the best agreement between the calculated and experimental values of bond lengths and angles of Finasteride. And the computed geometry parameters obtained by GGA/PW91 also fairly agree well with the experimental structural parameters. Vibrational analysis The calculated and experimented spectra were shown in Figure 2. Finasteride molecules in solid state have C=O···H and N-H···O hydrogen bonds on ring A.40 This might cause the different frequencies between the observed and calculated which were simulated by single molecule.
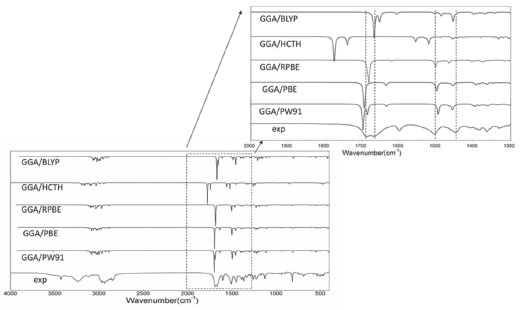 Figure 2. Experimental and simulated FT-IR spectra of finasteride
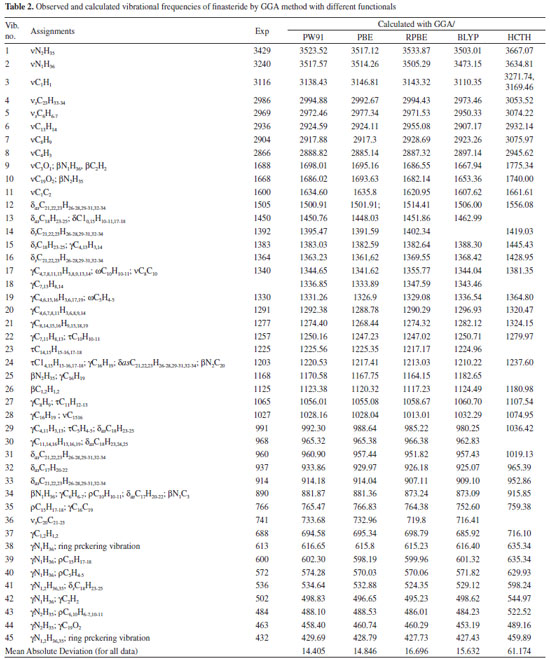
Up to our knowledge, so far, there is no study on systematical conformational analysis or theoretical frequency calculations reported for finasteride. The frequencies calculated by GGA method with PBE, RPBE, HCTH, PW91 and BLYP functionals were collected in Table 2. The observed FT-IR frequencies for various modes of vibrations were also presented in same table comparison reason. And the mean absolute deviations between the calculated and experimental methods for infrared spectra results were also compared. N-H vibrations The title molecule is comprised of two N-H group located on the ring A and side chain, respectively.40 The stretching vibrations of the N-H bonds appear in the region of 3600-3300 cm-1.42,43 N-H stretching modes have been calculated as 3517.57 cm-1 (PW91), 3514.26 cm-1 (PBE), 3505.29 cm-1 (RPBE), 3473.15 cm-1 (BLYP) and 3634.81 cm-1 (HCTH) on the ring A, respectively. In the present investigation, the band at 3240 cm-1 (FT-IR) assigned to it. The discrepancy can be explained by the single molecule in gas loose the intermolecular N-H···O interactions. At higher wavenumbers, another calculated N-H stretching vibration which is assigned to the frequency of 3429 cm-1 in experimental spectra is also found. Moreover, N-H and N-C stretching vibrations which is assigned to 1203 and 890 cm-1 (FT-IR) in the experimental spectra contributed to the frequencies at 1220.53 and 881.87 cm-1, calculated by using PW91 functional. The plane bending vibration in the range of 410-620 cm-1 are calculated out, which are assigned to IR peaks shown in Table 2, concretely.
C=O The most characteristic feature of carbonyl group is a sharp band, which are usually observed in the range of 1870-1540 cm-1, especially located in 1690-1630 cm-1 for carbonyl in amide group.44 The C=O stretching vibration are found very strong band at 1688 and 1668 cm-1 in FT-IR spectrum which is assigned to carbonyl group vibration on the ring A and side chain, respectively. The C=O vibration on the ring A calculated by GGA method with PW91, PBE, RPBE, HCTH, and BLYP functionals have peaks at 1698.01, 1695.16, 1686.55, 1667.94 and 1775.34 cm-1, respectively. Despite intermolecular C=O···H hydrogen bonding interactions in the solid state, PW91 result is in a good agreement with our experimental spectrum for carbonyl stretching mode. The stretching vibration of C=O on the side chain is corresponding to the calculated wavenumbers of 1686.02 cm-1 (PW91), 1693.63 cm-1 (PBE), 1682.14 cm-1 (RPBE), 1653.36 cm-1 (BLYP) and 1740.00 cm-1 (HCTH), respectively. As seen from Table 2, the observed band at 766 cm-1 (FT-IR) can be assigned to C19=O2 in plane bending vibration. Furthermore, the assignments of out of plane bending vibration mode is calculated at 458.40 cm-1 by PW91 functional. C=C The C=C stretching vibrations usually form a band in the region of 1430-1650 cm-1.45,46 In the experimental spectrum, the C=C stretching vibration of Finasteride is observed at 1600 cm-1 with strong band. The theoretically calculated frequencies are at 1634.60, 1635, 1620.95, 1607.62 and 1661.61 cm-1 by PW91, PBE, RPBE, HCTH, and BLYP functionals, respectively. These assignments are in accordance with the literature. C-C The C-C stretching vibrations usually occur in the reign 1200-800 cm-1.44 In our study, the range of characteristic C-C stretching modes are calculated at 1210-786 cm-1 in PW91, which means that the calculated values can reflect the experimental values accurately. The multi-carbon rings are mainly composed by carbon atoms in finasteride. The C-C bending vibration lead to skeletal stretching of ring. The frequencies around 500-400 cm-1 are extensively assigned to bending vibrations of C-C bands.44 In our calculation, C-C bending modes are located at 420-680 cm-1 with PW91, PBE, RPBE, HCTH, and BLYP functionals. The calculated values are in good agreement with experimental data as given in Table 2. C-H The saturated C-H stretching vibration is assigned at 2840-3000 cm-1.44 In our present work, the calculated saturated C-H stretching modes are observed at 3200-2880 cm-1 (PW91), 3125-2885 cm-1 (PBE), 3140-2887 cm-1 (RPBE), 3086-2897 cm-1 (BLYP) and 3247-2945 cm-1 (HCTH) which are in agreement with theoretical values. At higher wavenumbers, the unsaturated C-H stretching vibration is assigned at 3100-3000 cm-1. The C1-H and C2-H stretching modes have been calculated as these two separate peaks as shown in Table 2, but under the experimental condition, the counterparts of C1-H1 and C2-H2 bands are noticed at 3116 cm-1, which are overlapped to one peak. This might be caused by the low resolution of FT-IR equipment. The frequencies corresponding to the C-H bending modes (in-plane or out-of-plane) of the title compound are listed with consistent agreement by using PW91, PBE, RPBE BLYP and HCTH functionals in Table 2. The mean absolute deviations between the calculated and experimental infrared spectra for each method were compared. They are 14.40 cm-1 for PW91, 14.85 cm-1 for PBE, 16.70 cm-1 for RPBE, 15.63 cm-1 for BLYP and 61.17 cm-1 for HCTH, respectively. It is clear that the GGA/PW91 is distinctly superior to all the remaining levels in predicting all the vibrational spectra on average of Finasteride. Frontier molecular orbitals The highest occupied molecular orbital (HOMO) energies, the lowest unoccupied molecular orbital (LUMO) energies, and the gap energy value of HOMO-LUMO are key parameters in determining molecular properties and the way the molecule interacted with other species,47,48 which constitute frontier orbital theory. Frontier molecular orbitals play an important role in the electric and optical properties. The LUMO as an electron acceptor represents the ability to obtain an electron and the HOMO represents the ability to donate an electron and the energy gap reflect the stability and chemical activity of the molecule.49 The frontier molecular orbitals and total electron density isosurface at GGA/PW91 level was given in Figure 3 and Figure 4.
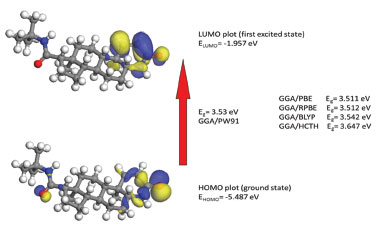 Figure 3. Calculated HOMO-LUMO plot and energy gap of finasteride
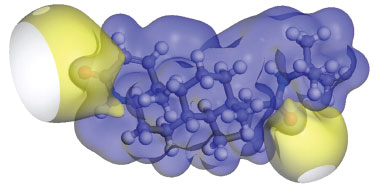 Figure 4. Electron density isosurface of finasteride
The HOMO is located on C=C, amide group on the ring A and the carboxyl group on the side chain. And, it is also obviously from the Figure 4 that the region around oxygen and nitrogen atoms (O1 and N1) have the largest electron density which might be due to the conjugate system (yellow). The N2 region have a lower electron density might due to the strong space resistance by the methyl groups nearby which might inhibit the occurrence of chemical reactions. The LUMO is more focused on the C=C and amide group on the ring A. The HOMO-LUMO transition implies an electron density transfer to the ring A from amide group on the side chain. Overall, the alkene and lactam groups are more likely to be attracted by other species.41,50 Mulliken atomic charges Pharmacological studies showed that the electronic interactions between drug molecular and receptor is the key point to play effect. Analysis of the atomic charge distribution in the drug molecule can reveal its action sites with the receptor.51-53 The illustration of atomic charge distribution of Finasteride at GGA/PW91 level of theory was shown in Figure 5.
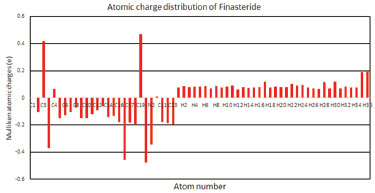 Figure 5. Atomic charge distribution of finasteride with PW91 functional
Because the carbon atom have stronger electronegativity than hydrogen atoms, most of the carbon atom attached with hydrogen atoms was negative. For C3 and C4, they were positively charged conversely, which might be due to the attachment of olefin and lactam groups which received electronic from C atoms. The oxygen atoms have more negative charges while all the hydrogen atoms have positive charges. Compared to other atoms, the maximum positive atomic charge is obtained from C19, which is due to the attachment of two negatively charged atoms (O2 and N2). Negatively charged nitrogen (N1 and N2) atoms shows that the charges are transferred from H to N (H35→N1 and H36→N2), and the charges of oxygen (O1 and O2) atoms shows that electronics were transferred from C to O (C3→O1 and C19→O2). These sites were more likely to be attracted by electrophilic reagent for finasteride molecule, and the possible sequence of reactions is O2>O1>N1>N2. However, due to the steric effect of tert-butyl group, the chemical reaction was difficult occurred at N2 and O2 site, which is consistent with the results of orbital and electronic density analysis, conforming with the previous experiment result.54 The reason why O1>N1 is that the presence of the nitrogen atom increases the nucleophilicity of the carbonyl groupand O is more electronegative than N atom.55 The methyl carbon atoms (C17, C18, C21, C22 and C23) are more negatively charged which indicates the charge transfer from H to C.
CONCLUSIONS A complete vibrational frequencies and geometry parameters were firstly performed by PW91, PBE, RPBE, BLYP and HCTH functionals for finasteride. Vibrational frequencies of the fundamental modes of finasteride were precisely assigned and compared with the experimental vibrations. The mean absolute deviations were conducted to analysis the differences between the five functionals. The surveyed results allows us to conclude that PW91 is a reliable functional that can be used in the confirmation of experimental spectroscopic, the explanations of structure studies and the prediction of physicochemical properties about finasteride. The HOMO, LUMO and electron density isosurface analysis indicated that the electron density transfer to ring A from amide group on the side chain when chemical reaction occurs. And the alkene and lactam groups on the ring A was more likely to be attacked by other species. Moreover, N1 and O1 are the active-sites which were analyzed by Mulliken atomic charges theory and the steric effect. Above all, this paper screened out an appropriate density functional methods of Generalized Gradient Approximations (GGA) to calculate the fundamental physicochemical properties of finasteride, which could provide the mechanism and adaptive functional for photocatalytic degradation and molecular docking of finasteride.
SUPPLEMENTARY MATERIAL Figure 1S and Tables 1S - 3S can be freely accessed at http://www.quimicanova.sbq.org.br, in PDF format.
ACKNOWLEDGEMENTS The authors would like to thank Xiangtan University for assistance with the copyright of the Material Studio software. This research did not receive any specific grant from funding agencies in the public, commercial, or not-for-profit sectors.
REFERENCES 1. McClellan, K. J.; Markham, A.; Drugs 1999, 57, 111. 2. Steiner, J. F.; Clin. Pharmacokinet. 1996, 30, 16. 3. Motofei, I. G.; Rowland, D. L.; Georgescu, S. R.; Tampa, M.; Baconi, D.; Stefanescu, E.; Baleanu, B. C.; Balalau, C.; Constantin, V.; Paunica, S.; J. Dermatol. Treat. 2016, 27, 495. 4. Ahmed, T. A.; Int. J. Nanomed. 2016, 11, 515. 5. Othman, A.; Evans, J. S.; Evans, I. R.; Harris, R. K.; Hodgkinson, P.; J. Pharm. Sci. 2007, 96, 1380. 6. Reddy, M. S.; Rajan, S. T.; Rao, M. B.; Vyas, K.; Reddy, S. V.; Rekha, K. S.; US Pat 7,501,515 2009. 7. Wawrzycka, I.; Stȩpniak, K.; Matyjaszczyk, S.; Kozioł, A. E.; Lis, T.; Abboud, K. A.; J. Mol. Struct. 1999, 474, 157. 8. Frelek, J.; Górecki, M.; Dziedzic, A.; Jabƚońska, E.; Kamieński, B.; Wojcieszczyk, R. K.; Luboradzki, R.; Szczepek, W. J.; J. Pharm. Sci. 2015, 104, 1650. 9. Antonio, S. G.; Paiva-Santos, C. O.; Bezzon, V. D.; J. Pharm. Sci. 2014, 103, 3567. 10. Diri, H.; Bayram, F.; Simsek, Y.; Caliskan, Z.; Kocer, D.; Acta Endocrinol. (Bucharest, Rom.) 2017, 13, 84. 11. Morales, E. E.; Grill, S.; Svatek, R. S.; Kaushik, D.; Thompson Jr., I. M.; Ankerst, D. P.; Liss, M. A.; Eur. Urol. 2016, 69, 407. 12. Dai, J. Y.; LeBlanc, M.; Goodman, P. J.; Lucia, M. S.; Thompson, I. M.; Tangen, C. M.; Cancer Prev. Res. 2019, 12, 113. 13. Datta, S.; Grant, D. J.; Nat. Rev. Drug Discovery 2004, 3, 42. 14. Bajaj, S.; Singla, D.; Sakhuja, N.; J. Appl. Pharm. Sci. 2012, 2, 129. 15. Önal, A.; Quim. Nova 2011, 34, 677. 16. Milman, V.; Refson, K.; Clark, S. J.; Pickard, C. J.; Yates, J. R.; Gao, S. P.; Hasnip, P. J.; Probert, M. I. J.; Perlov, A.; Segall, M. D.; J. Mol. Struct.: THEOCHEM 2010, 954, 22. 17. Hansch, C.; Maloney, P. P.; Fujita, T.; Muir, R. M.; Nature 1962, 194, 178. 18. Hansch, C.; Fujita, T.; J. Am. Chem. Soc. 1964, 86, 1616. 19. Free, S. M.; Wilson, J. W.; J. Med. Chem. 1964, 7, 395. 20. Gupta, J.; Nunes, C.; Vyas, S.; Jonnalagadda, S.; J. Phys. Chem. B 2011, 115, 2014. 21. Remko, M.; J. Mol. Struct.: THEOCHEM 2009, 897, 73. 22. Delley, B.; J. Chem. Phys. 2000, 113, 7756; Perdew, J. P.; Burke, K.; Ernzerhof, M.; Phys. Rev. Lett. 1996, 77, 3865. 23. Kohn, W.; Sham, L. J.; Phys. Rev. 1965, 140, 1133. 24. Burke, K.; J. Chem. Phys. 2012, 136, 150901. 25. Perdew, J. P.; Burke, K.; Ernzerhof, M.; Phys. Rev. Lett. 1996, 77, 3865. 26. Perdew, J. P.; Burke, K.; Wang, Y.; Phys. Rev. B 1998, 57, 14999. 27. Perdew, J. P.; Chevary, J. A.; Vosko, S. H.; Jackson, K. A.; Pederson, M. R.; Singh, D. J.; Fiolhais, C.; Phys. Rev. B 1993, 48, 4978. 28. Becke, A. D.; J. Chem. Phys. 1992, 96, 2155. 29. Proynov, E. I.; Ruiz, E.; Vela, A.; Salahub, D. R.; Int. J. Quantum Chem. 1995, 56, 61. 30. Hammer, B. J. K. N.; Nørskov, J. K.; Surf. Sci. 1995, 343, 211. 31. Hamann, D. R.; Phys. Rev. Lett. 1996, 76, 660. 32. Zupan, A.; Perdew, J. P.; Burke, K.; Causà, M.; Int. J. Quantum Chem. 1997, 61, 835. 33. Perdew, J. P.; Wang, Y.; Phys. Rev. B 1992, 45, 13244. 34. Hammer, B. H. L. B.; Hansen, L. B.; Nørskov, J. K.; Phys. Rev. B 1999, 59, 7413. 35. Hamprecht, F. A.; Cohen, A. J.; Tozer, D. J.; Handy, N. C.; J. Chem. Phys. 1998, 109, 6264. 36. Boese, A. D.; Doltsinis, N. L.; Handy, N. C.; Sprik, M.; J. Chem. Phys. 2000, 112, 1670. 37. Boese, A. D.; Handy, N. C.; J. Chem. Phys. 2001, 114, 5497. 38. Becke, A. D.; Phys. Rev. A 1988, 38, 3098. 39. Lee, C.; Yang, W.; Parr, R. G.; Phys. Rev. B 1988, 37, 785. 40. Wenslow, R. M.; Baum, M. W.; Ball, R. G.; McCauley, J. A.; Varsolona, R. J.; J. Pharm. Sci. 2000, 89, 1271. 41. Reis, R. H. D.; Paula, F. R.; Machado, M. M.; Duarte, J. A.; Oliveira, L. F. S. D.; Paim, C. S.; Malesuik, M. D.; J. Chromatogr. Sci. 2018, 56, 531. 42. Gunasekaran, S.; Kumaresan, S.; Balaji, R. A.; Anand, G.; Seshadri, S.; Pramana 2008, 71, 1291. 43. Wang, Y.; Pittman Jr., C. U.; Saebo, S.; J. Org. Chem. 1993, 58, 3085. 44. Goldman, S.; Vibration Spectrum Analysis: A Practical Approach, Industrial Press Incorporated: New York, 1991. 45. Gunasekaran, S.; Anita, B.; Seshadri, S.; Indian J. Pure Appl. Phys. 2010, 48, 183. 46. Varsányi, G.; Assignments for vibrational spectra of seven hundred benzene derivatives, Wiley: New York, 1974. 47. Lewis, D. F. V.; Ioannides, C.; Parke, D. V.; Xenobiotica 1994, 24, 401. 48. Padmaja, L.; Ravikumar, C.; Sajan, D.; Hubert Joe, I.; Jayakumar, V. S.; Pettit, G. R.; Faurskov Nielsen, O.; J. Raman Spectrosc. 2009, 40, 419. 49. Ravikumar, C.; Joe, I. H.; Jayakumar, V. S.; Chem. Phys. Lett. 2008, 460, 552. 50. Tian, G.; Chen, S. Y.; Facchine, K. L.; Prakash, S. R.; J. Am. Chem. Soc. 1995, 117, 2369. 51. Karakaya, M.; Kürekçi, M.; Eskiyurt, B.; Sert, Y.; Çırak, Ç.; Spectrochim. Acta, Part A 2015, 135, 137. 52. Garcia-Viloca, M.; Truhlar, D. G.; Gao, J.; J. Mol. Biol. 2003, 327, 549. 53. Guo, M.; Wang, Y.; Wang, X.; Guo, M.; Jiang, Y.; Zhang, Y.; J. Chem. Soc. Pak. 2018, 40, 145. 54. Takano, T.; Hata, S.; J. Chromatogr. B 1996, 676, 141. 55. Guarna, A.; Occhiato, E.; Danza, G.; Conti, A.; Serio, M.; Steroids 1998, 63, 355. |
On-line version ISSN 1678-7064 Printed version ISSN 0100-4042
Qu�mica Nova
Publica��es da Sociedade Brasileira de Qu�mica
Caixa Postal: 26037
05513-970 S�o Paulo - SP
Tel/Fax: +55.11.3032.2299/+55.11.3814.3602
Free access


