Artigo
| Cellulose nanofibers from Cassava Agro-industrial Waste as reinforcement in PVA films |
|
Marcilene N. SchoelerI; Fernando Reinoldo ScreminI,II; Nayara Fernandes de MendonçaI; Viviane Prima BenettiI; Jhonatan Alves de JesusI; Rodrigo L. de Oliveira BassoII; Paulo R. Stival BittencourtI,*
I. Departamento Acadêmico de Química, Universidade Tecnológica Federal do Paraná, 85884-000 Medianeira - PR, Brasil Recebido em 10/12/2019 *e-mail: paulob@utfpr.edu.br Cellulose nanofibers (CNF) have been applied in composite systems due to the abundance of raw material, excellent mechanical and thermal properties. In this work, CNF was prepared from agroindustrial waste and used in specified amounts in polyvinyl alcohol (PVA) composites. The FTIR spectra of CNF, chemically purified cellulose (CPC) and Cassava Agro-industrial Waste (CAW) indicate the removal of hemicellulose and lignin. The increase of the crystallinity phase in CNF was observed, by XRD analysis and neither is observed the transition from cellulose I to II. Thermogravimetric analysis showed displacement that the initial degradation of the CNF over 43 °C degradation proceeds at single step. The chemical and dimensional homogeneity of CNF can be observed with the calculation of the crystalline phase content obtained by deconvoluted dTG curve and XRD spectra, obtaining 80% crystallinity by both techniques. SEM micrographs showed fibers with diameters of 22.30 ± 1.52 nm. An increase in the mechanical properties of PVA was observed with the addition of CNF. With 2.5% CNF in the PVA, the elastic module increased by approximately three times, with the addition of 10% CNF, a saturated system with poor mechanical properties was observed. INTRODUCTION The development of biodegradable polymeric materials from renewable sources such as cellulose is highly viable due to the abundance and variety of raw materials,1 which is the main reason for the development of this work. Cellulose is a natural polymer derived from vegetables and has a structural and energetic functions for plants and some animals.2,3 From cellulose-rich raw materials, it is possible to obtain cellulose nanofibers (CNF). These are crystalline organic structures that have nanometric dimensions due to their renewability, biodegradability,4 biocompatibility,5 functionality,6 high mechanical strength,7 large specific surface area, low visual light scattering, and other features, nanocellulose has found a wide range of applications including areas as materials engineering, biomedical8 and sensor development.9 There are several sources of natural cellulose fibers used to obtain nanomaterials (nanocrystals, nanofibers/nanowhiskers and cellulose nanoparticles), such as corn straw, cotton, wood, sisal, sugar cane bagasse and even some marine animals.10,11 Cassava (Manihot esculenta) is one of the most traditional crops in Brazil whose annual production is about 23 million tons. The cassava agroindustry for food purposes has increased significantly with the construction of several flours and starch producing plants in this country.12 The industrial production of starch generates a large amount of residual biomass, the dry residue of this waste has up to 23% of cellulosic fiber.13 Polyvinyl alcohol (PVA) is a polymer with relative malleability and high solubility in water. this material is highly applicable due to its ease of processing, biodegradability14 and biocompatibility.15 It is a fact that this polymer does not have high mechanical resistance so the production of composites with nanocrystalline cellulose structures is one of the most promising alternatives. The sustainability of the production and use of CNF has encouraged researchers in the development of polymer composites aiming to improve the mechanical properties of the original polymer network, considering that these products are biodegradable and generated in abundance as waste.16,17 In this work CNF was prepared from fibrous waste cellulose from a starch industry that processes 53,000 tons/year of cassava. The industrialization of the final product, starch, is 14,840 tons, and the process generates approximately 3,500 tons of residual biomass. The obtained CNF, as well as the crude fiber (CAW) and bleached (CPC), were characterized by infrared spectrometry (FTIR-UATR mode), X-ray diffraction (XRD), scanning electron microscopy (SEM) and thermogravimetry (TG). This work also aims to contribute to the development of green chemistry and the valorization of residual biomass from starch processing industries.
EXPERIMENTAL Raw materials and reagents Cassava agro-industrial waste (CAW) was obtained from the starch-producing Cooperativa Agro-industrial Lar (Paraná, Brazil). The raw material in natura consists of a powder fibrous material, this powder was washed in distilled water at 50 °C to remove impurities, after washing the material was dried at 60 °C for 24 hours. Polyvinyl alcohol used in the composite films was Sigma-Aldrich, average Mw 130,000 and >99% hydrolyzed CAS Number 9002-89-5. Chemical purification of fibrous material The CAW (10 g) was treated with 200 mL of aqueous solution NaOH 2%, by 2 hours at 50 °C with constant stirring. CAW was removed from the solution by filtration and washed successively with distilled water until it reached pH 7.18,19 For the bleaching process, the fibers were treated with 200 mL of solution NaOH (2%):H2O2 (11%) (1:1; v:v) by 90 minutes at 55 °C, under stirring. CAW was removed from the solution by filtration and successively washed with distilled water until reaching neutral pH. The resulting material was dried at 70 oC for 24 h.20 By this process was obtained chemically purified cellulose (CPC) which appears as a fiber cluster. Extraction of cellulose nanofibers CPC was dispersed in 40 mL of deionized water (1:20; w:v), in that dispersion 60 mL of H2SO4 (98%) was added dropwise to the system, the dispersion was maintained under constant agitation and with the temperature at 50 oC for 75 minutes.21,22 The suspension was centrifugated at 6,000 rpm (10 °C), the supernatant was discarded and the precipitate was redispersed in deionized water and centrifuged until pH 5-6, was obtained as table suspension. This suspension was sonicated (Elma Sonic) at 25 °C using a frequency of 37 kHz for 5 minutes and was subjected to dialysis in cellulose membrane (Membra-Cel® dialysis tubing, MWCO 3500, diameter of 22 mm) in deionized water. The dialysis water was changed every 12 hours for 7 days, the pH value was monitored until it remained constant (6 to 7). The suspension solvent was evaporated at 70 °C for 24 hours resulting in 0.9 g of solid (CNF), representing a mass yield of 9%. Application of cellulose nanofibers as a reinforcement in the polymer network of PVA To observe the mechanical effect of the CNFs in a polymer polymer network, PVA:CNF composites were obtained in form of films using casting method. In this method, a PVA solution (1% w/w) and the CNF suspension (1% w/w) were mixed to form solutions with 2.5%, 5% and 10% (w/w) of CNF. The resulting solutions were homogenized under magnetic stirring for 24 h, 10 mL of each solution was poured into a circular Teflon templates with a 7 cm diameter. The solvent of the solutions was removed in an oven at 70 oC for 24 h. After removing the material from the templates, a polymeric film in proportions equivalent to the solution and with a thickness of approximately 500 μm (± 17 μm) was obtained. Characterization analysis Thermogravimetric analyses (TGA) were carried out in a simultaneous thermal analyzer STA 6000 (PerkinElmer), 8 mg of sample was placed in a platinum crucible and pre-heated at 100 °C by 5 min in order to remove the residual moisture. Analyses were performed with temperature range from 50 to 600 oC, heating rate of 10 oC min-1 and 20 mL cm-1 N2 flow. Infrared Spectroscopy (FTIR) was performed on a PerkinElmer Frontier spectrometer, using attenuated total reflectance (ATR) mode. Samples were analyzed between 600 and 4000 cm-1, with 16 scans and resolution of 2 cm-1. X-ray diffractograms were determined using a Panalytical diffractometer, Model Empyrean using Ni-filtered CuKα radiation (λ = 1.5406 Å) at 40 kV and 40 mA. Scattered radiation was detected in the step-scan node with a 2θ angle ranging from 5° to 40o with a scanning rate of 4o min-1.23 The deconvolution of the crystalline fraction was obtained from gaussian curve fitting according to Park.24 The simulated peaks areas at the respective 2θ angles were obtained and compared according French.25 Scanning electron microscopy (TM 3000 Tabletop Scanning Electron Microscope, HITACHI, Schaumburg, USA) was used to determine the samples morphology. Samples were coated with gold and operated at an accelerating voltage of 10 kV. The average of the fiber diameter was carried out measuring 120 fibers. Tensile tests were carried out in a texturometer Stable Micro Systems, model TA.HD plus, according to ASTM D882-02. The samples were dimensioned 50 mm x 20 mm and test speed of 0.8 mm s-1, clamp-to-clamp distance of 30 mm and a load cell of 5.0 kg.
RESULTS AND DISCUSSION Morphological characterization by Scanning Electron Microscopy As observed in Figure 1(a) micrography, CAW is highly fibrous and composed of several cellulose microfibers, in natural state and before to chemical extraction, the CAW surface has waxes and other fouling substances, such as hemicellulose, lignin and pectin, which form an external layer thick to protect the cellulose inside.26 The presence of encrusting substances causes the fibers to have an irregular appearance when observed by SEM. In the CNF micrography, shown in Figure 1(b), it is possible to observe a fibrous morphology.
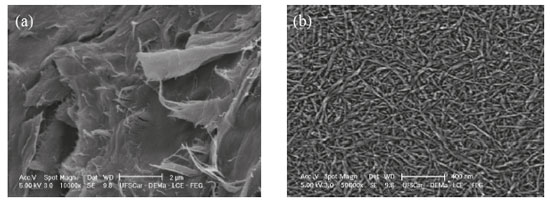 Figure 1. SEM micrographs of (a) Cassava Agro-industrial Waste (CAW) and (b) Cellulose Nanofibers (CNF) obtained from acid hydrolysis
The chemical treatment employed seems to be efficient to remove impurities from CAW, without hardly affect cellulose crystalline domains. The average of the nanofibers diameters obtained was 22.30 ± 1.52 nm, which is in agreement with the diameter obtained in the production of nanofibers from the commercial cellulose.27 The fibers have a wide length range, producing interconnected distributions even at higher dilutions. The length of the fibers could not be measured due to the difficult to recognize the beginning and end of an individual fiber chain, however, it was observed that the chemical treatment employed removed the impurities as well as the non-crystalline fraction of the CAW, resulting in a homogeneous material composed thoroughly of crystalline structures. Chemical structure analysis with FTIR spectroscopy In the IR spectrograms of the CAW, CPC and CNF showed in Figure 2, it is possible to observe some changes in the chemical functionality of the samples, which has been extensively used for structural analysis of the material before and after chemical treatments.
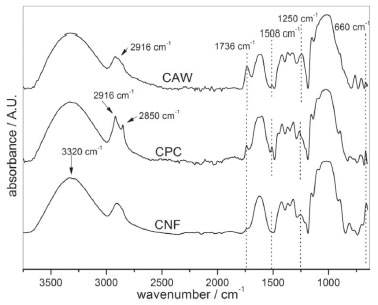 Figure 2. FTIR spectra of diffractograms of cassava agro-industrial waste (CAW), chemically purified cellulose (CPC) and cellulose fibers (CNF) produced by acid-hydrolysis
The spectral bands at 3320 cm-1 (O-H stretching intramolecular hydrogen bonds for cellulose I) appear in all samples without significant changes, 2916-2850 cm-1 (C-H stretching), in the CPC sample, these bands are more intense due the presence of the amorphous fraction of the cellulose, thus, it is possible to attribute the absence of this profile in CNF due to the highly crystalline arrangement. Spectral bands at 1736 cm-1 which is attributed either to the acetyl and uronic ester groups of the hemicellulose or to the Ester linkage of the carboxylic groups of the ferulic and p-coumaric acids of lignin and/or hemicellulose. This spectral band has a higher intensity in the CAW and decreases the intensity after the purification process step in CPC, and practically disappears after the acid hydrolysis. This effect indicates that most of the hemicellulose and lignin were removed from the CAW during the chemical treatment.26,28 The band at 1507 cm-1 and 1250 cm−1 of CAW is assigned to aromatic ring vibration of lignin and C-O out of plane stretching due to the aryl group in lignin respectively. The intensity of these peaks decreases in the chemical-purified cellulose fibers and disappeared in the CNF.29 The signal at 660 cm-1 is relative to the hydrogen bonds out of the deformation plane, this band appears prominently in CNF, indicating higher crystallinity in this sample.29 Comparing the functional groups of cellulose to the raw material and the corresponding ones concerning CNF, it is not possible to observe a reduction of the intensity of the spectral band in 1150 cm-1, that appears as a shoulder overlapped in a band of higher intensity, this effect can be attributed to the non-transition from cellulose I to cellulose II.30 Spectral bands attributed to sulphonic groups are not observed, this occurs due the milder chemical treatment was done by slow dripping the sulfuric acid on fiber, and not the direct poured on CPC, avoiding the cellulose sulfonation. These results confirm that there are any sulphonic groups in the fiber and that therefore does not occur the catalytic effect that decreases the thermal stability of the material as observed in the thermogravimetric analyzes.28 Another aspect related to non-sulfonation is the difficulty of obtaining the fibers in isolation for SEM images, it is believed that the absence of negative charges from the sulfonic groups reduces the dispersion of the fibers in the aqueous solution as well as affecting the pH of the solution assuming a value higher than CO2 saturated pure water. Crystalline pattern by X-ray diffraction The XRD diffractograms of CAW, CPC, and CNFs are shown in Figure 3.
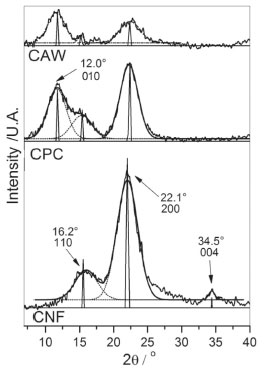 Figure 3. X-ray diffractograms of cassava agro-industrial waste as raw material (CAW); chemically purified cellulose (CPC); cellulose fibers (CNF) produced by acid-hydrolysis
CNF samples showed a diffraction pattern with peaks at 2θ = 16.2o, 22.1o and 34.5o, these peaks are assigned to 110, 200 and 004 crystallographic planes, respectively, this pattern is related to the typical crystalline structure of cellulose-I.31,32 XRD diffractogram of CAW presents peaks with low intensity at 12.0o, 16.2° and 22.1o, this result was coherent with the sample condition, due to the presence of amorphous components in the sample, as lignin, oily residues and others. After the chemical treatment, it is observed higher crystalline diffraction peaks in the same 2θ values, which demonstrates the removal of some components of the sample.27 The crystallinity index of the samples was calculated according to XRD deconvolution method and the areas of the simulated peaks at the respective 2θ angles.24,25 According to the deconvolution method, the crystallinity index is determined by the relation of the areas delimited by the deconvoluted curves, the sum of the areas which refer to the peaks arising at about 22.1o and 34.5o, i.e., the area related to planes 200 and 004 which are attributed to the crystalline fraction of the cellulose. In Figure 4 it is possible to observe the comparison of the relative are as obtained from the diffractograms deconvolution curves and the areas of the simulated peaks for the samples CPC and CNF,25,33,34 the values of the crystallinity rates obtained by both methods were similar.
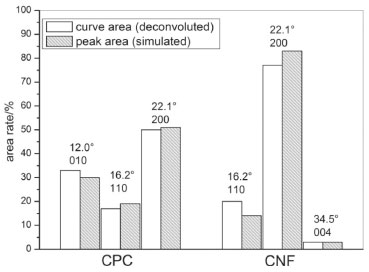 Figure 4. Crystallinity rates in CNF and CPC obtained by deconvolution of the XRD spectrum and simulated peaks
The crystallinity index was 48.73% for CPC and 79.66% for CNF, these values were higher than those presented by Chen and collaborators, whose developed cellulose nanofibers with a crystallinity of 69%, using high-intensity ultrasonic waves for the removal of the amorphous phase.28 The obtained crystallinity index is similar to the crystallinity obtained in nanowhiskers that assumes values around 80%.27 This result can be attributed to the treatment used in this work, which is similar to the used in the nanowhiskers synthesis. It is probable that the sulfuric acid dripping in the CPC sample at the moment of the hydrolysis and the temperature control should have prevented the cleavage of chemical bonds in crystalline cellulose chains, hence, producing nanofibers. It is possible to affirm that the treatment applied in the nanofibers production does not generate cellulose II, since this structure normally leads to the appearance of a diffraction peak around 20°,35 this fact corroborates with the results observed in the FTIR analyses. Thermal analysis In Figure 5 the thermogravimetric curves of CAW, CPC and CNF show that the thermal degradation of the samples are distinct, the initial mass loss, before 200 °C, was approximately 4% for all samples, this process can be related due to the residual water evaporation in samples.36 Observing the onset temperature of the second step of the mass loss, it's possible to note that CNF has higher thermal stability, with the onset temperature exceeding CPC at 22 °C and CAW at 43 °C.
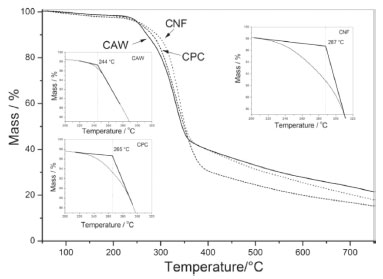 Figure 5. Thermogravimetric curve of CAW, CPC and CNF and, into the graph, the Tonset obtained for the pyrolysis start of each sample
Thermal degradation of the CAW starts at temperatures lower than the other samples (244 °C), this process can be explained due to the sample heterogeneity. In the CPC sample, the onset temperature is 265 °C, it occurs due to the purification processes that remove oily residues and the remaining lignin, causing the bleaching of the sample, these purifications procedures allow the cellulose and hemicellulose to remain in the system. In the CNF the onset temperature was 287 °C because the chemical process for obtaining nanofibers aims to remove the amorphous fraction of the system, maintaining only the CNF that presents higher thermal stability than the other samples. Some studies describe that acid hydrolysis usually results in materials with lower thermal stability due to the introduction of sulfate groups in the cellulosic structure, which results in catalytic degradation of the obtained nanofiber.27,37 Thus, in order to avoid sulphonation and even degradation caused by a rapid increase in temperature the slow dripping of sulfuric acid was performed in CPC, following this procedure may result in long-chain fibers and, hence, high crystallinity and thermal stability.28 The presence of bands related to the sulfate group in the IR spectra and the absence of the diffraction peak at 2θ = 22° in the XRD diffractogram can be attributed to the presence of cellulose II in samples that underwent intense acid hydrolysis.27 The deconvolution of the first derivative in TG curves is a procedure that aims to improve the quantitative interpretation of the obtained results.38 Figure 6 shows the graphs of the differential thermogravimetric curve (dTG) of CAW, CPC and CNF and their respective deconvoluted Gaussian curves (DdTG), these curves allow to evaluate the sample homogeneity according to the number and curves profiles in the thermal-degradation steps.39
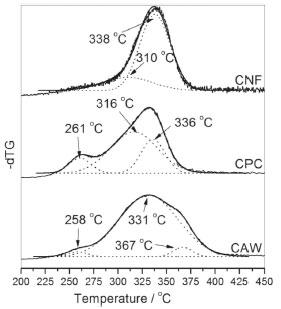 Figure 6. Curve deconvoluted (DdTG) from CAW, CPC and CNF dTG analysis
Due to the symmetrical profile of the CNF-dTG curve, the sample has chemical and dimensional homogeneity, since the DdTG provides two distinct curves, in Tmax at 310 °C, which can be attributed to the amorphous structure of the remaining cellulose in the process of purification, and another more stable thermally, at 338 °C, attributed to the crystalline cellulose. DdTG for CPC provided three distinct curves, with peaks at 261 °C, 316 °C and 336 °C, these curves can be attributed to hemicellulose, amorphous fraction and the crystalline fraction of cellulose, respectively. In CPC the curve of the greater area is relative to the amorphous fraction of the cellulose which means that this sample has low crystallinity. In CAW it was possible to obtain three DdTG curves with Tmax at 258, 331 and 367 °C, these curves can be attributed to thermal degradation of hemicellulose, cellulose and an oily fraction, respectively.40-42 In the CAW sample, at the peak attributed to cellulose, it is not possible to distinguish the amorphous phase from crystalline due to heterogeneity of this system, since there are several other components in this mixture that influence the cellulose pyrolysis in this temperature range. The crystallinity estimation of the samples was calculated by the ratio of the peak area (DdTG) assigned to the crystalline phase and the sum of the peak areas, the results are shown in Table 1. In CNF the area of the DdTG curve at 338 °C predominates, i.e., CNF is the sample with the highest crystallinity.
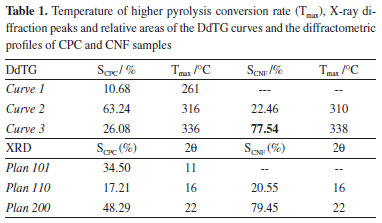
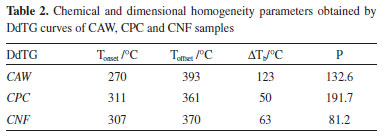
The CNF crystallinity was determined from two different analyzes that provided similar results, the crystallinity calculated from the thermogravimetric analysis was 77.54% and X-ray diffraction was 79.45%, thus, confirming the high crystallinity of the CNF. These results are in agreement with those reported in several studies, which reported similar crystallinity with fibers obtained from other raw materials.27 In both analyzes an increase of the CNF crystallinity in relation to CPC was observed, however, it was not possible to obtain a correlation between the results of CPC crystallinity by DdTG and XRD due to heterogeneity of the sample composition. For systems containing cellulosic polymers, a proposal is to evaluate the temperature range in which the DdTG is calculated (ΔTb - temperature variation of the base peak), taking in to account the area of this curve, which is related to the quantity of a determined phase in the sample.43 Thus, calculating the ratio (P) between ΔTb and the relative area of the DdTG (S) it is possible to evaluate the chemical and/or dimensional homogeneity of the component, and it can be verified that the smaller this values more homogeneous will be the phase. The range can be calculated by the difference between offset (Toffset) and onset (Tonset) temperature of the DdTG curve, according to equations 1 and 2.  Table 2 presents the Tonset, Toffset, ΔTb and P values of DdTG curves related to cellulose samples, showing that the CNF DdTG has a lower P value, thus confirming its homogeneity.
Nanofibers as reinforcement of the polymeric Polymer Network of PVA Figure 7 presents the stress-strain curves of PVA and its nanocomposites under tensile tests. Tensile characteristics as, tensile strength, elastic modulus and elongation break, of the samples, have also been presented in Table 3.
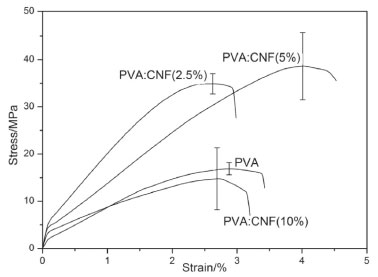 Figure 7. Stress-strain curves of PVA and nanocomposites PVA:CNF(2.5%), PVA:CNF(5%) and PVA:CNF(10%)
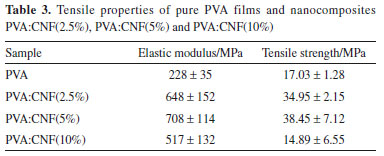
These results showed that occurs an improvement in the tensile modulus of PVA in films that have 2.5% and 5% in mass of CNF. This increase in tensile properties values occurs due to hydrogen bonds formed between cellulose nanofibers and PVA, which contributes to the dispersion of nanofibers in the polymer network, further was observed that an increase in the CNF content up to 2.5% also increased the stiffness of the composites. Besides, an increase in the concentration of the nanofibers up to 5% also increased the stiffness of the composites comparing to the PVA, higher dispersion of the tensile strength values obtained because from this concentration it is probable that phase segregation starts due to CNF saturation in PVA. In samples of PVA:CNF (10%), a relative decrease of the tensile modulus is observed compared to pure PVA samples, however, this value is lower than that observed in the other composites. This fact may be related to components saturation, resulting in phase segregation and, hence, heterogeneity of the sample, thus affecting their mechanical properties. Qua and coworkers44 produced PVA/cellulose nanofiber composites using nanofiber from flax fiber and microcrystalline cellulose (MCC). They reported that the inclusion of 5% of cellulose nanofiber resulted in an increase in the strength of the composites, from 141.8 MPa for PVA to 152.17 MPa for MCC composites. Incorporation of CNF in the polymer network did not significantly affect the elongation break results, only in the sample PVA:CNF (5%) showed an increase in this property. The introduction of CNF in PVA systems decreases the elongation break, however, the characteristics of the nanofibers used are different, since in this work was observed long length fibers.45 Differences in the reinforcing effects of nanofibers obtained from CAW, used in this work, could be ascribed to (i) different processing technique and conditions for isolation of the fibers and also (ii) the fact that cellulose nanofibers from different plants have different characteristics.46 Considering the results, it is clear that the best composition for the composite was PVA:CNF (2.5%) because even presenting lower properties than the PVA:CNF (5%), this composition showed the best mechanical property improvement with the smaller amount of nanofibers.
CONCLUSIONS This work showed the possibility of obtaining cellulose nanofibers with high crystallinity from the agro-industrial residue from the extraction of cassava starch. The production of cellulose nanofibers from this residue is a possibility to add value and generate a destination for the waste that is abundant in the food industry. Usual treatments used in manufacturing of CNF generally lead to the formation of cellulose II due to the aggressiveness of the acid hydrolysis, as observed by the XRD and FTIR analysis, there is no evidence of the transition to cellulose II from cellulose I, as there is no evidence of cellulose sulphation which does not affect the thermal stability of the material produced. XRD and TGA analysis corroborate each other and demonstrate that the treatment applied generated material with a crystallinity of 80%, approximately. Electron microscopy images demonstrate a material with nanometric dimensions relative to the fiber radius but it was not possible to define the length of the fibers due to the difficulty in defining the limits of a specific fiber, however, it is evident that the obtained fiber has high length. The nanofibers used as a mechanical reinforcement in a polymer network of PVA which generated satisfactory results about the increase of the resistance of the material when used in certain amounts, thus, showing that the material is viable for tentative application as thougher, biocompatible and biodegradable food packing composite film.
ACKNOWLEDGEMENTS The authors would like to thank the financial support of Fundação Araucária, CAPES, CNPq for financial support and State University of Ponta Grossa-UEPG by the SEM images.
REFERENCES 1. Jesus Silva, D.; D´Almeida, M. L. O.; O Pap. 2009, 70, 34. 2. Pereira, A. L. S.; Nascimento, D. M. Do; Souza Filho, M. D. S. M.; Morais, J. P. S.; Vasconcelos, N. F.; Feitosa, J. P. A.; Brígida, A. I. S.; Rosa, M. D. F.; Carbohydr. Polym. 2014, 112, 165. 3. Borsoi, C.; Zattera, A. J.; Ferreira, C. A.; Appl. Surf. Sci. 2016, 364, 124. 4. Kumar, S.; Mukherjee, A.; Dutta, J.; Trends Food Sci. Technol. 2020, 97, 196. 5. Dorishetty, P.; Balu, R.; Athukoralalage, S. S.; Greaves, T. L.; Mata, J.; Campo, L.; Saha, N.; Zannettino, A. C. W.; Dutta, N. K.; Choudhury, N. R.; ACS Sustainable Chem. Eng. 2020, 8, 2375. 6. Hu, D.; Ma, W.; Zhang, Z.; Ding, Y.; Wu, L.; ACS Appl. Mater. Interfaces 2020, acsami.0c01425. 7. Liu, X.; Jiang, Y.; Wang, L.; Song, X.; Qin, C.; Wang, S.; Ind. Crops Prod. 2020, 146, 112201. 8. Moohan, J.; Stewart, S. A.; Espinosa, E.; Rosal, A.; Rodríguez, A.; Larrañeta, E.; Donnelly, R. F.; Domínguez-Robles, J.; Appl. Sci. 2019, 10, 65. 9. Dai, L.; Wang, Y.; Zou, X.; Chen, Z.; Liu, H.; Ni, Y.; Small 2020, 1906567. 10. Da Silva, J. B. A.; Nascimento, T.; Costa, L. A. S.; Pereira, F. V.; Machado, B. A.; Gomes, G. V. P.; Assis, D. J.; Druzian, J. I.; Mater. Today: Proc. 2015, 2, 200. 11. Wang, H.; Pudukudy, M.; Ni, Y.; Zhi, Y.; Zhang, H.; Wang, Z.; Jia, Q.; Shan, S.; Cellulose 2019, 27, 657. 12. Aplevicz, K. S.; Demiate, I. M.; Ciênc. Tecnol. Aliment. 2007, 27, 478. 13. Virunanon, C.; Ouephanit, C.; Burapatana, V.; Chulalaksananukul, W.; J. Clean. Prod. 2013, 39, 273. 14. O'Donnell, K. L.; Oporto-Velásquez, G. S.; Comolli, N.; Nanomaterials 2020, 10, 301. 15. Khalaji, S.; Golshan Ebrahimi, N.; Hosseinkhani, H.; Int. J. Polym. Mater. Polym. Biomater. 2020, 1. 16. Nascimento, D. M.; Almeida, J. S.; Dias, A. F.; Figueirêdo, M. C. B.; Morais, J. P. S.; Feitosa, J. P. A.; Rosa, M. D. F.; Carbohydr. Polym. 2014, 110, 456. 17. Abdul Khalil, H. P. S.; Davoudpour, Y.; Islam, M. N.; Mustapha, A.; Sudesh, K.; Dungani, R.; Jawaid, M.; Carbohydr. Polym. 2014, 99, 649. 18. Pinheiro, I. F.; Morales, A. R.; Mei, L. H.; Cellulose 2014, 21, 4381. 19. Rambabu, N.; Panthapulakkal, S.; Sain, M.; Dalai, A. K.; Ind. Crops Prod. 2015, 83, 746. 20. Ye, D.; Montané, D.; Farriol, X.; Carbohydr. Polym. 2005, 62, 258. 21. Teixeira, E. D. M.; Oliveira, C. R.; Mattoso, L. H. C.; Corrêa, A. C.; Paladin, P. D.; Polímeros 2010, 20, 264. 22. Sá, R. M.; Miranda, C. S.; José, N. M.; Mat. Res. 2015, 18, 225. 23. Robles, E.; Salaberria, A. M.; Herrera, R.; Fernandes, S. C. M.; Labidi, J.; Carbohydr. Polym. 2016, 144, 41. 24. Park, S.; Baker, J. O.; Himmel, M. E.; Parilla, P. A.; Johnson, D. K.; Biotechnol. Biofuels 2010, 3, 1. 25. French, A. D.; Cellulose 2014, 21, 885. 26. Moon, R. J.; Martini, A.; Nairn, J.; Simonsen, J.; Youngblood, J.; Chem. Soc. Rev. 2011, 40, 3941. 27. Ludueña, L. N.; Vecchio, A.; Stefani, P. M.; Alvarez, V. A.; Fibers Polym. 2013, 14, 1118. 28. Chen, W.; Yu, H.; Liu, Y.; Chen, P.; Zhang, M.; Hai, Y.; Carbohydr. Polym. 2011, 83, 1804. 29. Sun, R.; Tomkinson, J.; Wang, Y.; Xiao, B.; Polymer (Guildf). 2000, 41, 2647. 30. Zuluaga, R.; Putaux, J. L.; Cruz, J.; Vélez, J.; Mondragon, I.; Gañán, P.; Carbohydr. Polym. 2009, 76, 51. 31. Wada, M.; Heux, L.; Sugiyama, J.; Biomacromolecules 2004, 5, 1385. 32. Kumar, A.; Negi, Y. S.; Bhardwaj, N. K.; Choudhary, V.; Carbohydr. Polym. 2012, 88, 1364. 33. Rambo, M. K. D.; Ferreira, M. M. C.; J. Braz. Chem. Soc. 2015, 26, 1491. 34. Valentim, A. C. S.; Inês, M.; Tavares, B.; Silva, E. O.; Quim. Nova 2014, 37, 255. 35. Garvey, C. J.; Parker, I. H.; Simon, G. P.; Macromol. Chem. Phys. 2005, 206, 1568. 36. Teodoro, K. B. R.; Teixeira, E. M.; Corrêa, A. C.; Campos, A.; Marconcini, J. M.; Mattoso, L. H. C.; Polímeros 2011, 21, 280. 37. Lin, N.; Huang, J.; Dufresne, A.; Nanoscale 2012, 4, 3274. 38. Gallagher, P. K. In Handbook of Thermal Analysis and Calorimetry; Brown, M. E., ed.; Elsevier: Amsterdam, 1998, vol. 1, ch. 4. 39. Jin, E.; Guo, J.; Yang, F.; Zhu, Y.; Song, J.; Jin, Y.; Rojas, O. J.; Carbohydr. Polym. 2016, 143, 327. 40. Amutio, M.; Lopez, G.; Aguado, R.; Artetxe, M.; Bilbao, J.; Olazar, M.; Fuel 2012, 95, 305. 41. Amutio, M.; Lopez, G.; Alvarez, J.; Moreira, R.; Duarte, G.; Nunes, J.; Olazar, M.; Bilbao, J.; Chem. Eng. Res. Des. 2013, 91, 2682. 42. Stolarek, P.; Ledakowicz, S.; Thermochim. Acta 2005, 433, 200. 43. Oladokun, O.; Ahmad, A.; Abdullah, T. A. T.; Nyakuma, B. B.; Bello, A. A.-H.; Al-Shatri, A. H.; Appl. Therm. Eng. 2016, 105, 931. 44. Qua, E. H.; Hornsby, P. R.; Sharma, H. S. S.; Lyons, G.; McCall, R. D.; J. Appl. Polym. Sci. 2009, 113, 2238. 45. Abe, K.; Iwamoto, S.; Yano, H.; Biomacromolecules 2007, 8, 3276. 46. Ramezani Kakroodi, A.; Cheng, S.; Sain, M.; Asiri, A.; J. Nanomater. 2014, 2014, 1. |
On-line version ISSN 1678-7064 Printed version ISSN 0100-4042
Qu�mica Nova
Publica��es da Sociedade Brasileira de Qu�mica
Caixa Postal: 26037
05513-970 S�o Paulo - SP
Tel/Fax: +55.11.3032.2299/+55.11.3814.3602
Free access


