Artigo
| An electrochemiluminescence sandwich biosensor for the detection of lipopolysaccharide |
|
Xuemei FanI,II,*; Zhejian LiI; Shumin WangI; Yimeng WangI; Lingmin YuII; Xinhui FanI,II
I. College of Chemical Engineering and Modern Materials, Shangluo University, Shangluo, 726000, P. R. China Recebido em 02/02/2020 *e-mail: fanxuemei527@163.com A novel electrochemiluminescence (ECL) biosensor for the determination of lipopolysaccharide (LPS), a biomarker of endotoxemia, was designed. The nanoprobe (Ru1@SiO2-peptide) with a specific peptide (CIGKLHSAGK) labeled with a carboxyl functionalized Ru@SiO2 (Ru1@SiO2) was prepared by the acylation reaction. The ECL peptide biosensor was obtained by the strong gold-sulfur bond between Au on the gold electrode (AuE) surface and thiol group in the peptide. In the present of LPS, the peptide on the ECL biosensor can capture effectively LPS and the LPS/peptide/AuE was fabricated. When the Ru1@SiO2-peptide nanoprobe was bound, a sandwich compound of Ru1@SiO2-peptide/LPS/peptide was formed, and Ru(bpy)32+, in the sandwich compound, will do the ECL performance. The effective ECL amplification of Ru1@SiO2 exhibited excellent analytical performance to LPS with a wide detection linear range of 1.0~500 ng mL-1 and the detection limit was 0.3 ng mL-1. The biosensor could provide an evaluate of LPS expression on the bacteria surface and guide a new path to the clinical analysis of LPS related diseases. INTRODUCTION Lipopolysaccharides (LPS), also known as 'endotoxins', is the main component of the outer membrane of gram-negative bacteria, generally considered as contaminants found in food, environmental and clinical products.1 LPS can induce the internalization of mammalian cells to produce an immune response, leading to fever, multiple body failure, or sepsis.2 So, the detection of LPS is of great help to study the cell function and disease diagnosis. Biosensor is a kind of analytical device that converts biological signals combined with recognition molecules and target analytes into detectable signals, which is widely used in life analysis and environmental detection. Up to now, some biosensors were established for LPS detection. Rangin3 developed a colorimetric biosensor by using the functionalized liposomes to provide various responses to specific LPS strains. Gao4 designed a fluorescent biosensor based on the electrostatic interaction between positively charged aggregation induction probe and negatively charged of LPS. Wang5 designed an electrochemical sensor by using copper ion-assisted gold nanoparticle polymer as a signal amplification material and the specific interaction between aptamers and LPS. Oliu6 established an electrochemical impedance biosensor by using a three-dimensional electrode array modified with globulin A. Electrochemiluminescence (ECL) is the process through which species generated at electrodes undergo homogeneous high-energy electron transfer reactions to give excited states that emit light.7 Due to its low background, high sensitivity, good reproducibility and selectivity, ECL biosensor has been widely used in immunoassay,8,9 DNA analysis,10,11 and clinical diagnosis.12,13 To date, detection of LPS with ECL technology has been reported. A MoS2 QDs-incidental ECL biosensor with aptamer recognition-driven target-cycling synchronized rolling circle amplification for LPS.14 A triple-helix molecular switch-based versatile "off-on" ECL biosensing platform for LPS was established by multiple-amplification strategy.15 Peptide is a compound formed by peptide bond between different amino acid, it is the intermediate product of proteolysis. Due to its good stability, good biological compatibility and easy design and synthesis, peptide is widely used in the area of biosensors. Currently, peptides are used as recognition molecules in colorimetric,15 fluorescent,16,17 electrochemical,18 and ECL.19 Up to now, some peptide biosensors have been developed for LPS. Fan reported an electrochemical impedance spectroscopy biosensor by employing peptide as recognition molecule.20 Based LPS binding peptide to a specific aggregation induced emission fluorophore, a fluorescent biosensor was developed.21 A peptide functionalized polydiacetylene liposomes as a fluorescent biosensor for LPS was also established.22 In this paper, a sandwich biosensor for LPS was designed and implemented by integrating Ru1@SiO2-tagged peptide as an ECL probe. Peptide, as the recognizer with specific affinity to LPS, was used to form the sandwich architecture (Figure 1).
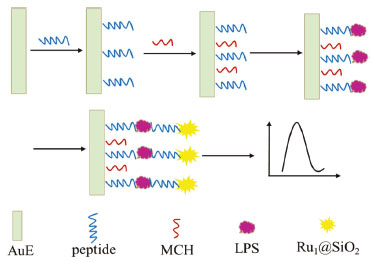 Figure 1. Schematic illustration of the ECL biosensor for LPS detection
The selectivity of the biosensor could be enhanced by utilizating the peptide for twice to capture the LPS. When Ru1@SiO2-peptide nanoprobes was bound to the LPS/peptide/MCH/AuE, the expression of LPS could be evaluated by the ECL signal. This biosensor established could provide a way to evaluate the LPS expression on the bacteria surface, as well as open up new avenues to known the physiological functions of LPS in bacteria processes and the clinical analysis of LPS related diseases.
EXPERIMENTAL Apparatus and reagents Peptide (CIGKLHSAGK) was purchased from Shanghai Sangon Biological Engineering Technology & Service Co. Ltd. (China). Lipopolysaccharides from Escherichia coli O55:B5 was purchased from Sigma-Aldrich and was purified by the manufacturer. Tris-(2,2'-bipyridyl)-dichlororuthenium(II) hexahydrate (Ru(bpy)3Cl2·6H2O), Tripropylamine (TPA), 6-Mercapto-1-hexanol(MCH), N-1-(3-dimethylaminopropyl)-3-ethylcarbodiimide (EDC), hydroxysuccinimide (NHS), Triton X-100, tetraethoxysilane (TEOS) and vinyltriethoxysilane (VTES) were purchased from Sigma-Aldrich (U.S.A.). Cyclohexane, n-hexanol, acetone, ethanol, potassium ferricyanide and potassium ferrocyanide were obtained from Xi'an Chemical Reagent Company (China). Peptide and LPS solutions were prepared by 0.1 mol L-1 phosphate buffer saline (PBS, 0.1 mol L-1 KH2PO4/Na2HPO4-0.1 mol L-1 KCl, pH 7.0), while PBS was used as washing solution. All other solutions were prepared with ultrapure water (> 18.2 MΩ cm-1) supplied by a Milli-Q Lab system. ECL measurements were performed by an MPI-E ECL detector (Xi'an Remax Electronics, Xi'an, China), with the voltage of the PMT was set at -800 V in the process of detection. A cylindroid glass cell was used as an ECL cell, contained a three-electrode system consisting of a 3 mm gold electrode as the working electrode, an Ag/AgCl (saturated KCl) and a platinum sheet served as the reference and counter electrodes, respectively. A Zennium electrochemical workstation (ZAHNER, Germany) was used to record the cyclic voltammetric curves. The UV-vis and fluorescence spectra were recorded by a UV-vis spectrophotometer (UV-1600PC, Meipuda Instruments Co., Shanghai, China) and an F-4600 spectrofluorometer (Hitachi, Japan), respectively. Preparation of Ru1@SiO2 The Ru1@SiO2 nanoparticles were synthesized according to the literature.23 Firstly, cyclohexane, Triton x-100 and 1-hexanol were mixed by the volume ratio of 4.2:1:1, together with 500 µL of ultrapure water, stirred for 30 min. Then, added 50 µL 0.01 mol L-1 Ru(bpy)32+ and adjusted the pH to neutral with NaOH, concurrently stirred for 1 h. After that, a polymerization reaction was initiated and the hydrolysis reaction was allowed by adding 90 µL of TEOS and 60 µL of NH4OH, this process continued for 24 h. Finally, acetone was employed to destroy the emulsion, with centrifuging and washing with ethanol and water for three time and the orange Ru@SiO2 nanoparticles were obtained. The precipitation (Ru@SiO2) was dispersed in 1.0 mL ethanol solution, then added 500 µL of VTES, followed reacting for 12 hours under continuous stirring. Then, the nanoparticles were dispersed in the mixed solutions containing 4.2 mg mL-1 NaIO4 and 0.1 mg mL-1 KMnO4, reacting for 6 h, and the Ru1@SiO2 was obtained. Preparation of the ECL nanoprobe The Ru1@SiO2-peptide nanoprobe, was synthesized according to the reference literature with some modification.24 A newly prepared mixed solution containing 5 mg mL-1 NHS and 2 mg mL-1 EDC was added to the Ru1@SiO2 nanoparticle to activate the carboxyl groups in Ru1@SiO2 for 30 min, and then the peptide solution, prepared by dissolved 1.0 mg peptide (1.0 µmol) in 1.0 mL of 0.1 mol L-1 PBS (pH 7.0), was added, followed by incubation at 4 °C for 12 h. The ECL nanoprobe was purified using gelfiltration chromatography on Sephadex G-15 by 0.1 mol L-1 PBS (pH 7.0) containing 0.1 mol L-1 KCl. Preparation of the ECL sensor The AuE was polished with 0.3 µm and 0.05 µm alumina slurry and ultrasonicated for 5 min in ultrapure water. Then the AuE was electrochemically cleaned with cyclic voltammetry in 0.10 mol L-1 H2SO4 for 20 cycles between +0.2 V and +1.5 V. The cleaned electrode was thoroughly rinsed with 0.1 mol L-1 PBS and dry in air. 10 µL of 1.0 µg mL-1 peptide was dropped onto the cleaned AuE for 2 h, followed by a thorough washing with 0.1 mol L-1 PBS in order to remove any unbound peptide. Then, the peptide modified electrodes were immersed in 100 µL of 1.0 mmol L-1 MCH for 30 min to block the nonspecific binding sites and washed with the washing buffer. So, the ECL peptide biosensor was obtained and stored at 4 °C in refrigerator. ECL Measurements The prepared ECL biosensor was immersed in 100 µL of different concentrations of LPS for 50 min, washed with the washing buffer and dry in air. The LPS-bound electrode was then immersed in 200 µL of ECL nanoprobe for 60 min and washed with the washing buffer. At last, the ECL signal was detected in 2.0 mL of 50 mmol L-1 TPA (0.1 mol L-1 PBS, pH = 7.0) at a constant potential of +1.25 V, and LPS was quantified by the ECL signal.
RESULTS AND DISCUSSION Characterization of ECL nanoprobe Figure 2A showed that the resultant Ru1@SiO2 were yellow and with an average diameter of about 50 nm. Figure 2B were the UV-visible spectra of Ru(bpy)32+, Ru1@SiO2, peptide and Ru1@SiO2-peptide. The absorption spectrums were much the same for the pure Ru(bpy)32+ (line a) and synthesized Ru1@SiO2 (line b), while two maximum absorption peaks at about 290 nm and 458 nm. A characteristic absorption peak at 257 nm was observed for peptide (line c). As can be seen, the Ru1@SiO2-peptide showed absorption peaks at 287 nm, 457 nm and 248 nm, respectively (line d). Compared with the 290 nm and 458 nm of Ru1@SiO2, 257 nm of the peptide, the blue shift occurred, indicating that the Ru1@SiO2-peptide synthesis was successful. The concentration of nanoprobe was estimated to be 6.5 × 10⁻⁶ mol L-1, according the UV-visible absorption of Ru(bpy)32+ at 458 nm.25 Figure 2C was the fluorescence spectra of the pure Ru(bpy)32+ and Ru1@SiO2-peptide. It showed that their maximal emission were at 568 nm and 570 nm, respectively, while the excitation at 458 nm, which also indicated the success of our nanoprobe preparation.
 Figure 2. TEM images of Ru1@SiO2 (A), UV-vis absorption spectra (B) of Ru(bpy)32+ (a), Ru1@SiO2 (b), peptide (c) and Ru1@SiO2-peptide (d) and the fluorescence spectra (C) of Ru(bpy)32+ (a), and Ru1@SiO2-peptide (b)
Characterization of the ECL biosensor The fabrication process of the ECL biosensor was characterized by cyclic voltammetry. As shown from Figure 3, compared to the bare AuE (line a), the current at peptide/AuE (line b) was decreased, which attributed to the fact that the Au-S bond was formed on the surface of AuE. The self-assembly of MCH on peptide/AuE blocked the electron transfer of [Fe(CN)6]3-/4- and thus led to a reduction of current (line c). After immobilization of LPS onto the surface of peptide/MCH/AuE, the current further reduced (line d), due to the fact that peptide on ECL biosensor can capture effectively LPS, owing to the LPS, a negatively charged glycolipid, bound to the peptide.26 After interaction of LPS/peptide/MCH/AuE with the ECL nanoprobe, the current value increased (line e), this was attributed to the good conductivity of Ru@SiO2 nanoparticles, the result demonstrated that a number of ECL nanoprobe with high specific affinity to LPS were successfully bound to LPS, which also indicated that the probe has been immobilized on the surface of the LPS/peptide/ MCH/AuE.
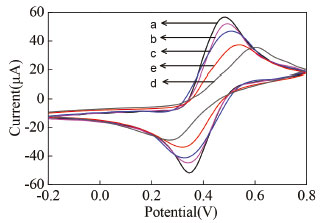 Figure 3. Cyclic voltammograms obtained at different electrodes in 0.05 mol L-1 [Fe(CN)6]3-/4 (0.10 mol L-1 PBS, pH=7.0) (A). AuE (a), peptide/AuE (b), peptide/MCH/AuE (c), LPS/peptide/MCH/AuE (d), Ru1@SiO2-peptide/LPS/peptide/MCH/AuE (e). LPS: 10 ng mL-1
Optimization of experiment conditions The incubation time of LPS was optimized using 10 ng mL-1 LPS as a model (Figure 4A). The results indicated the ECL signal increased with the incubation time from 20 to 50 min. Further prolonged the incubation time, the ECL strength only a low increase. This indicated that the incubation time reached equilibrium in 50 min. So, 50 min was chosen as the LPS incubation time. The reaction time between LPS and the ECL nanoprobe was also investigated (Figure 4B). The ECL intensity sharply increased with the reaction time and reached the maximum at 60 min, this indicated the quantity of nanoprobe were reached saturation. Therefore, the reaction time for the nanoprobe to recognize LPS was 60 min.
 Figure 4. Effect of binding time between peptide and LPS (A), LPS and Ru1@SiO2-peptide (B) on the ECL intensity in 50 mmol L-1 TPA (0.1 mol L-1 PBS, pH = 7.0). LPS: 10 ng mL-1
Performance of the biosensor for LPS The ECL intensity was determined for different concentrations of LPS under the optimized conditions. The ECL signal increased with the increasing of LPS concentration and was linearly proportional to the logarithm of LPS concentration, with a linear range of 1.0~500 ng mL-1 (Figure 5). The linear regression equation was IECL = 529.74 + 537.54 lgC (ng mL-1), and the regression coefficient (R) was 0.9935. The detection limit was defined for 0.3 ng mL-1 as the signal-to-noise to be three. For comparison purposes, we summarized some biosensors previously reported for LPS in Table 1. As shown in Table 1, except for Zhao's14 and Wang's work,5 the detection limit of this method was lower than those of the previous works. The linear range was wide except Zhao's work.14
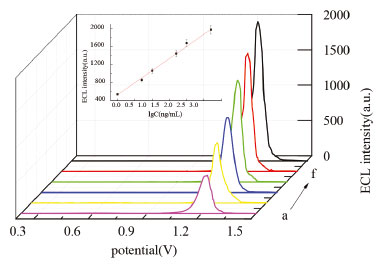 Figure 5. ECL intensity-potential curves with different concentrations of LPS at 100 mV s-1 in 50 mmol L-1 TPA (0.1 mol L-1 PBS, pH = 7.0). (a) 1.0 ng mL-1, (b) 5.0 ng mL-1, (c) 10 ng mL-1, (d) 50 ng mL-1, (e) 100 ng mL-1, (f) 500 ng mL-1. Inset: calibration curve for LPS
The reproducibility of the fabricated biosensor was measured using five individual biosensors with a standard deviation of 2.9%, and 3.1% for seven independent measurements using the same biosensor, take 10 ng mL-1 LPS as a model. This indicated that the fabricated biosensors had a good reproducibility. The storage performance of the ECL biosensor was also studied. After 1 week of storage at 4 °C in 0.1 mol L-1 PBS (pH 7.0), the average ECL value of the biosensor was 97.8% of the initial ECL value for 10 ng mL-1 LPS. To investigate the selectivity of ECL biosensor, the interference experiments were carried out using 5.0 µg mL-1 BSA, DNA, RNA, glucose and cholesterol, respectively (Figure 6). The results showed only the LPS (10 ng mL-1 LPS) had significant ECL strength, while 500-fold of other five proteins had weak emissions comparable to the blank strength. In addition, the selectivity of the biosensor was also examined in a mixture containing LPS and the five other proteins. The signal obtained from the mixture was similar to those obtained from the pure LPS solution. These results indicated the biosensor had high specificity for LPS.
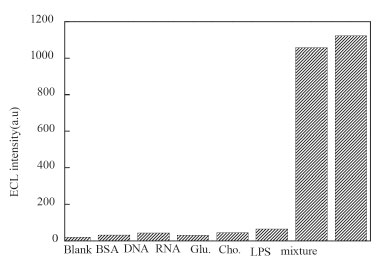 Figure 6. Selectivity of the ECL biosensor to 10 ng mL-1 LPS by comparing it to the interfering biological species, 5.0 µg mL-1 BSA, DNA, RNA, glucose and cholesterol
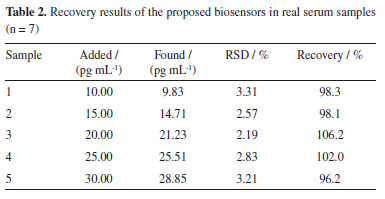
The application of the ECL biosensor was also investigated. The serum samples collected from Shangluo Hospital, China, and the real sample was prepared by spiking different concentrations of LPS into 50-fold-diluted serum samples with 0.01 mol L-1 pH 7.0 PBS. The LPS concentration in serum was estimated using the standard addition method by the proposed ECL biosensor. The experimental results were shown in Table 2. The RSD of each sample was less than 3.31% for five times parallel detections and the recovery varied from 96.2%~106.2%, which showed that the biosensor constructed can be used for the detection of LPS in real serum samples.
CONCLUSIONS In summary, a new ECL sandwich biosensor has been designed for the determination of LPS. The assay was based on the highly selective recognize of peptide to LPS, as well as the Ru1@SiO2-peptide nanoprobe as an ECL nanoprobe. The selectivity of the biosensor could be enhanced by utilizating the peptide for twice to capture the LPS. This strategy presented in this paper had potential application value in other biosensors and may be utilized for the detection of other small biomolecules in other analytical instruments.
ACKNOWLEDGEMENTS This project was supported by the National Natural Science Foundation of China (No. 30970696), the Science and Technology Planning Project (2012KTDZ 02-02) and the Natural Science Basic Research Plan in ShaanXi Province of China (2018JM2040). Science and technology innovation team project of Shangluo University (18SCX003).
REFERENCES 1. Das, A. P.; Kumar, P. S.; Swain, S.; Biosens. Bioelectron. 2014, 51, 62. 2. Kim, S. E.; Su, W.; Cho, M.; Lee, Y.; Choe, W. S.; Anal. Biochem. 2012, 424, 12. 3. Rangin, M.; Basu, A.; J. Am. Chem. Soc. 2004, 126, 5038. 4. Jiang, G. Y.; Wang, J. G.; Yang, Y.; Zhang, G. X.; Fan, X. L.; Biosens. Bioelectron. 2016, 85, 62. 5. Wang, N.; Dai, H. X.; Sai, L. T.; Ma, H. Y.; Lin, M.; Biosens. Bioelectron. 2019, 126, 529. 6. Oliu, S. B.; Galyamin, D.; Abramova, N.; Muñoz-Pascual, F. X.; Bratov, A.; Electrochim. Acta 2017, 243, 142. 7. Liu, C.; Bard, A. J.; Nat. Mater. 2008, 7, 505. 8. Cao, J. T.; Wang, Y. L.; Wang, J. B.; Zhou, Q. M.; Liu, Y. M.; J. Electroanal. Chem. 2018, 814, 111. 9. Khan, M. S.; Ameer, H.; Ali, A.; Zhu, W. J.; Wei, Q.; J. Electroanal. Chem. 2019, 847, 113266. 10. Liu, Z. M.; Zhang, X.; Ge, X. G.; Hu, L. Q.; Hu, Y. J.; Sens. Actuators, B 2019, 297, 126790. 11. Zhao, J.; Da, J.; Yang, S. S.; Lei, Y. M.; Zhuo, Y.; Electrochim. Acta 2020, 332, 135389. 12. Sha, H. F.; Zhang, Y.; Wang, Y. F.; Ke, H.; Jia, N. Q.; Biosens. Bioelectron. 2019, 124, 59. 13. Shao, K.; Wang, B.; Nie, A.; Ye, S. Y.; Han, H. Y.; Biosens. Bioelectron. 2018, 118, 160. 14. Zhao, M.; Chen, A.; Huang, D.; Chai, Y. Q.; Zhuo, Y.; Yuan, R.; Anal Chem. 2017, 89, 8335. 15. Suaifan, G.; Alhogail, S.; Zourob, M.; Biosens. Bioelectron. 2017, 92, 702. 16. Suzuki, Y.; Sens. Actuators, B 2018, 276, 230. 17. Nian, L. G.; Hu, Y.; Fu, C. H.; Song, C.; Wang, J.; Xiao, J. X.; Talanta 2018, 176, 492. 18. Lin, Y. Y.; Shen, R. K.; Liu, N. N.; Yi, H.; Dai, H.; Lin, J. H.; Anal. Chim. Acta 2018, 1035, 175. 19. Wu, F. F.; Zhou, Y.; Zhang, H.; Yuan, R.; Chai, Y. Q.; Anal. Chem. 2018, 90, 2263. 20. Fan, X. M.; Li, Z. J.; Wang, S. M.; Liu, P.; Chen, F. Y.; Zheng, X. W.; J. Braz. Chem. Soc. 2019, 30, 1762. 21. Tang, Y. Y.; Kang, A.; Yang, X. T.; Hu, L. Y.; Tang, Y. Y.; Li, S.; Xie, Y. C.; Miao, Q. Q.; Pan, Y.; Zhu, D.; Sens. Actuators, B 2020, 304, 127300. 22. Wu, J. C.; Adam, Z.; Ehrmann, M.; Yi, T.; Schmuck, C.; JACS 2011, 133, 9720. 23. Jie, G. F.; Ge, J. J.; Gao, X. S.; Li, C. L.; Biosens. Bioelectron. 2018, 118, 115. 24. Li, Z. J.; Sun, L. J.; Zhao, Y.; Yang, L. B.; Qi, H. L.; Gao, Q.; Zhang, C. X.; Talanta 2014, 130, 370. 25. Zhang, J.; Qi, H.; Li, Y.; Yang, J.; Gao, Q.; Zhang, C.; Anal. Chem. 2008, 80, 2888. 26. Lei, C. Y.; Qiao, Z. H.; Fu, Y. C.; Li, Y. B.; Anal. Methods 2016, 8, 8079. |
On-line version ISSN 1678-7064 Printed version ISSN 0100-4042
Qu�mica Nova
Publica��es da Sociedade Brasileira de Qu�mica
Caixa Postal: 26037
05513-970 S�o Paulo - SP
Tel/Fax: +55.11.3032.2299/+55.11.3814.3602
Free access


