Artigo
| Characterization of aquatic organic matter in a natural environment in northeastern brazil |
|
Adnívia S. Costa MonteiroI,*; Maria Aparecida A. SantanaII; Raisa de Siqueira Alves ChielleIII; Carlos Alexandre Borges GarciaII; José do Patrocínio Hora AlvesI
I. Universidade Federal de Sergipe, 49100-000 São Cristóvão - SE, Brasil Recebido em 26/05/2020 *e-mail: liurise@139.com The organic matter (OM) contained in a natural aquatic environment, located in a tropical region in Notheastern Brazil, was characterized using synchronous fluorescence spectroscopy and UV-Vis absorbance. The synchronous fluorescence spectra did not show qualitative differences for samples collected during dry and rainy seasons. They also revealed two peaks, one at 390 nm and other at 460 nm, associated with humic substances. The lack of peaks with significant fluorescence intensity at 270 - 300 nm and at 320 - 370 nm confirms it is an environment with natural OM. The A254/A436 ratios obtained during the dry and rainy seasons (13.55 to 14.97) indicate the presence of allochthonous OM of terrestrial origin, with high level of aromatic carbon associated with humic substances. The OM photodegradation by natural sunlight was more pronounced in the first five days, with a decrease of FImax from 23.6 to 55.4%. Also, titration with Cu(II) ions was used to determine the complexation ability of the two fluorescent sites, obtaining log K values of 4.26 and 4.27. INTRODUCTION Natural organic matter (NOM) is a complex mixture of organic compounds that occurs in natural waters. It is derived from decomposition of land plants and from by-products of bacteria, algae and aquatic plants.1-7 An aquatic NOM holds both hydrophobic and hydrophilic compounds. The hydrophobic NOM is mainly comprised of aromatic carbon, with phenolic structures and conjugated double bonds; while hydrophilic NOM contains a higher proportion of compounds derived from carbohydrates, proteins, sugars and amino acids. Mostly of aquatic NOM is made of hydrophobic acids (~ 50 - 90 %), which represents more than half of the dissolved organic carbon (DOC) and are often described as humic substances.8-10 The NOM composition varies according to its origin and aquatic compartment. The origin of allochthonous organic matter is predominantly terrigenous and it comes from organic matter leaching to aquatic systems by the wind, surface runoff, and rivers.11,12 On the other hand, autochthonous organic matter is formed by photochemical and bacterial degradation of biologic material in the aquatic environment.13 The NOM characteristics can also vary seasonally and temporally. In the rainy period, the NOM input into water resources can increase; and, in periods of higher daily solar irradiation, the NOM characteristics can change as a result of photodegradation.14,15 Another process that can change NOM in the aquatic system is the biodegradation. These two processes can lead to the conversion of dissolved organic matter (DOM) to inorganic compounds (i.e. CO2), which contributes to CO2 emission from creeks, rivers, and lakes.16,17 It is particularly important to springs, once they are more closely linked to the terrestrial environment.18-21 The characterization of DOM regarding its origin, composition, concentration, and sources has attracted the attention of many researchers due to its wide distribution in the various environmental compartments (lakes, rivers, soils, and oceans). In addition, it plays a critical role in the global biogeochemical cycle of carbon; in the maintenance of aquatic food chain; in the interaction between hydrosphere, biosphere, and atmosphere; besides affecting the behavior and destination of inorganic pollutants, such as trace metals, this way changing its solubility , toxicity, mobility, bioavailability and final destination.5,12,22-25 One example is the DOM influence on copper speciation in natural waters, because, according to literature, the formation of the complex Cu-DOM decreases the activity of Cu(II) ions, the most bioavailable copper specie, and therefore it also decreases the toxicity to aquatic organisms.26,27 This interaction between DOM and metal ions is particularly important, because regulatory authorities began to realize that DOM is an important factor for water quality assessment.28 The assessment of DOM characteristics is often carried out by fluorescence spectroscopy and UV-visible absorbance, and the measure of dissolved organic carbon (DOC) reveals its quantity in the environment.17,25,29-36 In general, absorbance is measured at the wavelength of 254 nm and it is considered a measurement of humic substances contribution, rich in aromatic compounds.37 The UV-visible index (A254/A436) has also been used for source analyses and historical transformations of NOM in many aquatic environments.38,39 Fluorescence spectroscopy has been widely employed for DOM characterization in natural waters, with respect to its sources, degradation, and transformation.32,34,40-43 Besides presenting greater sensitivity when compared to absorbance measurement (10 to 1000 times), fluorescence measurement is also simple, fast, non-destructive, versatile, and it allows to discriminate different chromophores that absorbs similar wavelengths.30,44-46 This type of characterization is possible because of natural waters optical properties presented by the optically active fraction of the DOM, usually named colored dissolved organic matter (CDOM), which strongly absorbs in the ultra violet region of the spectrum. The CDOM directly affects the light spectral quality in the water column and it indirectly affects the primary production (by stimulation or inhibition), the exposure of aquatic organisms to the hazardous UV radiation, and the thermal stratification.22 The main objective of this work is to present the characteristics of organic matter in an aquatic environment located in a tropical region which is still unaffected by anthropic activities. Synchronous fluorescence spectroscopy and UV-Vis absorbance were used for characterization of dissolved organic matter. Photodegradation experiments were performed to evaluate the NOM photodegradation potential when exposed to light. The complexation ability of fluorescent sites with Cu(II) ions was also determined by titration.
MATERIALS AND METHODS Study area, sampling and chemical analyses The study area is located in Serra de Itabaiana National Park (PARNASI), in the State of Sergipe, Northeastern Brazil. The PARNASI is a Conservation Unit formed by the mountains of Cajueiro, Comprida, and Itabaiana, covering an area of 7,966 ha in a perimeter of 87.25 km. It covers the cities of Itabaiana, Areia Branca, Itaporanga D'Ajuda, Campo do Brito, Riachuelo, and Malhador. It is located in a transition zone from Caatinga to Atlantic Forest (Brazilian ecoregions), where climate is predominantly semi-arid, with annual precipitation ranging from 1100 to 1300 mm in well-defined seasons, and monthly average relative humidity of 84.6 %. The many creeks that flows through the mountains are, in general, associated with areas of forest formation, where shrub vegetation is predominant, and they are important for supplying surrounding communities and cities, because they are springs of rivers such as Poxim, Jacarecica, and Coringuiba.47 On the other hand, Cipó Waterfall holds intertwined roots through its entire extension and it is located at Gruta da Serra, in the Itabaiana Mountains. Samples were collected from surface water, in two sites (A1 and A2) in Cipó Waterfall/Gruta da Serra (Figure 1). The water of A1 site had a longer residence time of protection from direct sunlight (shaded area), while the water of A2 site received direct influence from sunlight. Sampling was carried out in October 2009 and April 2010. In each site, water was collected in polyethylene containers and samples were kept in ice and in absence of light until it reached the laboratory. In the laboratory, pH and electrical conductivity (EC) analyses were taken, using pH meter and EC meter (Digimed, Brazil); and part of the samples were immediately filtered in glass fiber filter (porosity 0.45 µm) and stored at 4 ºC in the dark until analyses were completed. All of the used containers were cleaned with ultra pure water (18.2 MΩ.cm, Millipore) and cleansing was tested using fluorescence.
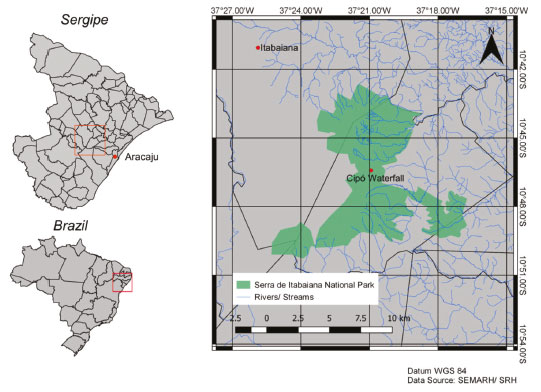 Figura 1. Serra de Itabaiana National Park with Cipó Waterfall location
UV - visible measurements of the water samples were performed with a FEMTO spectrophotometer (model 700 plus) in two wavelengths: 254 nm and 436 nm, using 1 cm quartz cells. Ultra pure water was used as a reference. Synchronous fluorescence analysis Synchronous fluorescence spectra of the water samples were obtained with a Perkin Elmer spectrofluorimeter (model LS45) equipped with a xenon lamp as excitation source. All measures were taken at a constant offset between excitation and emission of 30 nm and slit width of 10 nm,37,48 at a scanning range of 250 - 550 nm. Spectra were corrected according to ultra pure water blanks and fluorescence intensity was expressed in arbitrary units (u.a.). Dissolved organic carbon analysis Dissolved organic carbon (DOC) concentration was measured by sample combustion at 950 ºC, using a Shimadzu TOC-5000A total organic carbon analyzer. Calibration was conducted with a potassium hydrogen phthalate standard solution, diluted to different concentrations as estimated DOC content of the sample. For each sample, values were obtained by the average of at least three satisfactory injections, regarding the coefficient of variation (≤ 2 %). Photodegradation experiments The glass fiber-filtered samples, both A1 and A2 collected in the dry period (Oct 2009), were incubated to investigate photochemical transformation of DOM.39,41 Each sample was placed in three 30 mL borosilicate flasks (for 5; 10; and 15 days of incubation), leaving no upper space, and, afterwards, they were exposed to natural sunlight. Borosilicate glasses do not transmit light below 300 nm, therefore these samples are not exposed to far UV light. Each sample was analyzed before and after 5; 10; and 15 days of incubation, in order to obtain the synchronous fluorescence spectrum. Fluorescence quenching titration Titrations using fluorescence quenching were performed to study complexation between DOM and Cu(II), based on the modified Stern-Volmer equation. From the filtered A1 samples (collected in the dry period, Oct 2009), aliquots of 20 mL were taken and transferred to a series of glass flasks. Then, it was added at different volumes (10 to 80 µL) a 0.01 mol L-1 Cu(II) solution which was prepared from a Specsol 0.016 mol L-1 standard solution. Titration was performed in triplicate at the natural sample pH (4.3). During the titration the pH was maintained at 4.3 ± 0.1 and the total sample volume did not exceed the limit of 20.08 mL. The flasks were agitated and left to stand in the dark for 24 hours at room temperature, so that it could reach complexation equilibrium. The fluorescence intensity after each copper addition was measured using synchronous fluorescence spectroscopy. The titration was performed in triplicate in the natural sample and final volumes of each sample did not exceed the limit of 20.08 mL. Complexation parameters were calculated using the modified Stern-Volmer equation, assuming the formation of a 1:1 complex between DOM and Cu(II).49
RESULTS AND DISCUSSION Water quality variables and optical properties of the collected samples are shown in Table 1. Values of pH and electrical conductivity (EC) ranged from 4.1 to 4.4, and from 32.91 to 40.08 µS cm-1, respectively, indicating a fresh water with acid characteristics and low ionic content.
Dissolved organic carbon parameters (DOC), UV (A254) and visible (A436) absorption and specific ultraviolet absorbance (SUVA) are used to represent the quantitative measurement and NOM characteristics. COD concentrations ranged from 15.05 to 19.74 mg L-1. For the same sample period, differences between pH; EC; and DOC, among A1 and A2 sites, were not significant, but values were significantly lower to the samples collected in Apr 2010, reflecting the greater dilution in the rainy period. The wavelengths from 220 to 280 nm are considered the most suitable for NOM measures, with each different wavelength identifying different chromophores. A254 has been suggested for measurement of the colored dissolved organic matter (CDOM) contribution which is rich in aromatic constituents, i.e., A254 represents the aromatic character of the NOM.50 The A254/A436 ratio has been used as DOM source indicator. Values between 4.37 and 11.34 are typical to allochthonous DOM of terrestrial origin38; higher values (10.28 - 19.74) were obtained for humic fractions of the river Itapanhaú/São Paulo.51 The obtained values for A254/A436 for both periods (Table 1) were characteristic to allochthonous DOM of terrestrial origin, which has a higher aromatic carbon level associated with humic substances derived from superior plants and soil organic matter.37,38 The specific ultraviolet absorbance (SUVA) is calculated dividing A254 by DOC concentration, in other words, it represents the absorption at 254 nm per unit carbon. The SUVA describes NOM nature in the water in terms of hydrophobicity and hydrophilicity, a SUVA higher than 4 indicates NOM with predominant hydrophobic characteristics, while a SUVA lower than 3 stands for a predominantly hydrophilic NOM.8-10 In surface waters, the typical SUVA variation is from 1.0 to 6.0 L mg C-1 m-1; however, higher than 6.0 L mg C-1 m-1 values have been obtained for waters with a strong NOM of terrestrial origin presence.52 For the waters of Cipó Waterfall, SUVA values ranged from 5.90 to 7.65 L mg C-1 m-1, with higher values for the rainy period, due to the higher terrestrial organic matter input by surface runoff. The high SUVA values confirm the presence of DOM predominantly terrestrial in origin. The organic matter of terrestrial origin has relatively low nitrogen content, but large quantities of aromatic and phenolic compounds and, for this reason, it also presents a higher reactivity (Fabris et al., 2008). For the waters of the same region, Santos et al.53 obtained pH values (3.76), DOC (22.5 mg L-1), A254 (0.954), and SUVA (4.24 L mg C-1 m-1) similar to the values obtained in this work. They also mentioned that this data set indicates a highly humified NOM. Fluorescent characteristics and DOM photodegradation In the synchronous fluorescence method, excitation and emission wavelengths are continuously varied, keeping between them a constant offset value Δλ (λemission - λexcitation), obtaining as a response a spectrum with a set of peaks related to DOM fluorophore composition. The synchronous fluorescence spectrum for fresh water samples usually shows four wide peaks attributed to the presence of the following constituents: (i) compounds with characteristic structure of aromatic amino acids (at 270 - 330 nm wavelengths), associated with fluorophores derived from primary microbial production54; (ii) compounds with two tryptophan-like condensed rings (320 - 370 nm), which have been related to the presence of anthropogenic organics; and (iii) compounds with two condensed rings, associated with fulvic acids (370 - 400 nm) and with humic acids (420 - 480 nm), constituted by humic substances, derived from chemical and biological processes, in terrestrial and aquatic media, from soil and plant matter.55 Fluorescence spectra (Figure 2) did not revealed qualitative differences for the samples A1 and A2 collected in the dry period (Oct 2009) and rainy period (Apr 2010), and they predominantly indicated the presence of two peaks, one at 390 nm and other at 460 nm, typical of humic substances. According to Miano and Senesi56, peaks that are revealed in shorter wavelengths represent the fulvic acid fractions with lower degree of aromaticity, while peaks that are revealed in longer wavelengths (460 nm or longer) are associated to polycondensed phenolic aromatic compounds, such as humic acids. Although the samples collected in April presented lower DOC concentration (Table 1), they also presented higher fluorescence intensity, indicating that the fluorescent material represents only a fraction of total DOC, as observed by Arguelho et al.25 for the Sal River. The lack of peaks with significant fluorescence intensity at 270 - 300 nm and at 320 - 370 nm suggests an environment with natural organic matter (with no anthropogenic input), where allochthonous organic carbon predominates over autochthonous carbon derived from primary producers.
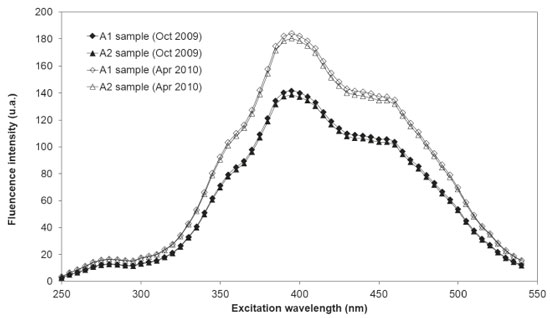 Figure 2. Synchronous fluorescence spectra for water samples of Cipó Waterfall - Itabaiana Mountains, collected during dry period (Oct 2009) and rainy period (Apr 2010)
Meng et al.41, using natural organic matter sample (SRDOM, International Humic Substance Society), obtained similar results, with considerably higher fluorescence intensity peaks for the humic-like components and substantially lower fluorescence intensities for the tryptophan-like (320 - 370 nm) and protein-like (270 - 300 nm) components. For them, this confirms that the natural dissolved organic matter is dominated by humic-like constituents of terrestrial origin. As organic matter molecules are photoreactives, photodegradation is an important mechanism of DOM transformation in aquatic media, which can entail the reduction of molecular size and variation in the optical properties.25,41,57 According to Meng et al.41, photodegradation can assist identification of NOM origin, provided that NOM characteristics are associated to its origin sources. The water samples from Cipó Waterfall collected in Oct 2009 were exposed to natural sunlight for a period of 15 days. Figures 3 and 4 show the variation of synchronous fluorescence spectra and fluorescence intensities (FImax) during photodegradation experiments, respectively. The exposure to solar radiation (w/S) resulted in a decrease in the FImax of peaks at 390 nm and 460 nm, and it generated two peaks, one charactheristic of aromatic amino acid-like components (275 nm) and other associated to compounds with two tryptophan-like condensed rings (355 nm). For the samples with no sunlight exposure (w/oS), the FImax at 390 nm (Peak III w/oS) and at 460 nm (Peak IV w/oS) remained almost invariable (Figure 4), indicating that, during the period of 15 days, the fluorescent organic matter was not degraded by solar radiation.
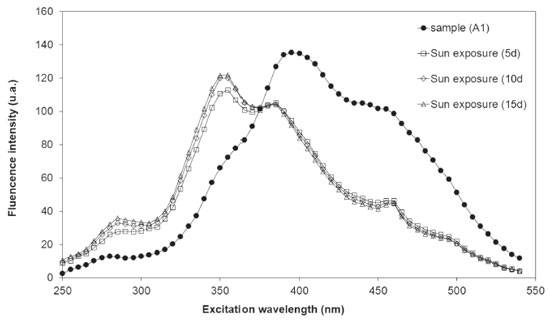 Figure 3. Variation of synchronous fluorescence spectra with sunlight exposure for the A1 water samples of Cipó Waterfall - Serra de Itabaiana National Park, collected during the dry period (Oct 2009)
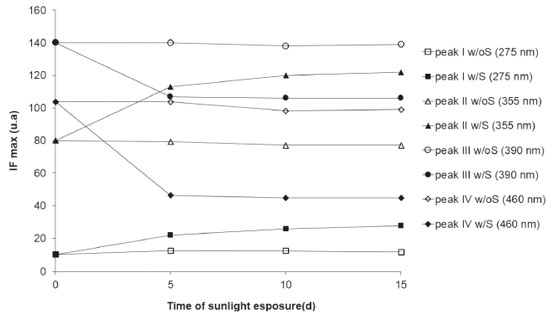 Figure 4. Variation of FImax with time of sunlight exposure (w/S) compared to FImax without sunlight exposure (w/oS), for the A1 water samples of Cipó Waterfall - Serra de Itabaiana National Park, collected during the dry period (Oct 2009)
The photodegradation process was more pronounced in the first five days, with a decrease in the FImax of 23.6% (at 390 nm) and 55.4% (at 460 nm). From the sixth day until the end of the experiment (15 days), FImax remained stable, not presenting any significant variation. For the two peaks generated by photodegradation (Peak I and Peak II), FImax showed a larger increase in the first five days, but a significant increase occurred until the end of the experiment. Photodegradation results (Figure 4) show that the most "sensitive" fluorescent DOM (FDOM) was almost completely degraded in five days, while the FDOM that stood by after the five days was relatively resistant to photodegradation. The decrease in FImax for the humic-like constituents was considerably lower than those observed for DOM in anthropogenically impacted environments25,41,58, showing that DOM of natural origin has a lower photodegradation potential than those present in impacted environments. Complexation of DOM with Cu(II) Considering the relevance of DOM as a water quality parameter that can affect metal toxicity 28, the complexation ability of fluorescent sites of DOM in Cipó Waterfall was assessed, using fluorescence quenching, based on the modified Stern - Volmer equation49, described by Equation 1: Io/(Io -I) = 1 / (f K [Cu]) + 1 / f (1) where I and Io are the fluorescence intensities of DOM in the sample, with or without addition of Cu(II) solution, respectively. K is the conditional constant of complexation and f is the DOM fraction which participates in the complexation. The values of K and f can be estimated through the plot of Io/(Io - I) versus 1/[Cu]. In this procedure, it is considered that only the fluorescent sites participate in the complexation. Therefore, the complexation of non-fluorescent sites is not assessed. Even so, this method has been used in several studies.32,49,59,60 The model also considers a stable quenching, leading to the formation of a metal-fluorophore complex which is stable and non-fluorescent.32 Copper is a metal that has been widely used in this type of experiment, once it is not only an effective quencher of humic substance fluorescence, but also it shows a strong association with colloidal molecules.32 Figure 5 shows the decrease in the fluorescence intensity in the peaks at 335 nm and 460 nm, as a function of the increase in Cu(II) concentration, indicating that fluorescence quenching occurred on account of the electronic structural change in the DOM fractions (fulvic and humic), due to the formation of complexes with copper. In the beginning of titration, Cu(II) ions concentration is low and there is excess of ligands. Thus, these ions tend to preferably occupy the strongest complexation sites and, as copper concentration increases and the strongest sites are occupied, Cu(II) ions start to occupy the weakest sites. It is observed that the decreases related to fluorescence intensity were not identical, which reflects the different complexation ability of the fluorophores.
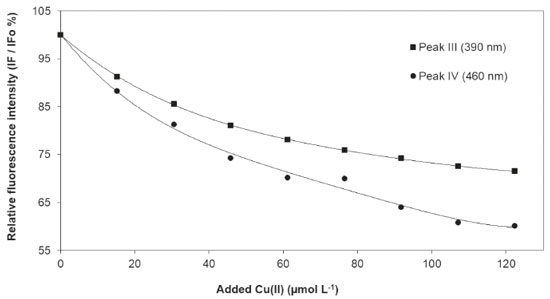 Figure 5. Decrease in intensity of peaks III and IV for DOM in the Cipó Waterfall waters as a function of the addition of 0,01 mol L-1 Cu(II) solution
The FImax of each peak related to Cu(II) concentration was used to determine complexation parameters. For the two fluorophores, the relation Io/(Io - I) versus 1/[Cu] was linear, with R2 values aproximately equal to 1 (Figure 6). The calculated complexation parameters for the two peaks are presented in Table 2. Similar log K values are mentioned in the literature for DOM in reservoir waters (log K 4.37 - 4.83)60, in surface river waters (log K 4.67 - 5.21)61 and for soil humic substances (log K 5.49 - 5.66)62.
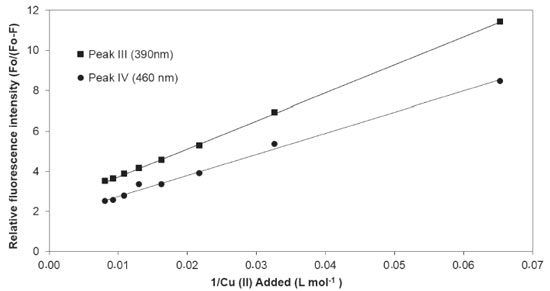 Figure 6. Stern - Volmer plot for the peaks III and IV for DOM in the Cipó Waterfall waters as a function of the addition of 0,01 mol L-1 Cu(II) solution
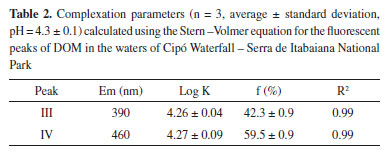
The results found showed that the values for the complexation constant were similar the main DOM constituents, fulvic acid (Peak III) and humic-like (Peak IV). This indicates that possibly the two identified fractions of DOM present in the waters of Cipó Waterfall - Gruta da Serra have binding sites of Cu(II) ions with similar strength and that the strongest sites are distributed both in the fulvic acid (Peak III) and on the humic acid (Peak IV). Nevertheless, the fluorophore fraction available for complexation was 42.3% for fulvic acid-type constituents (Peak III) and 59.5% for humic-type constituents, confirming the different amount of copper (II) bound to the fulvic and humic fractions. The bonding of metal ions to the humic material occurs through "specific" interactions with the functional groups (-COOH and phenolic OH) and "non-specific" ones resulting from the electrostatic interaction between the negatively charged humic molecule and the positively charged cations. The carboxylic and phenolic groups are mainly responsible for the binding capacity of humic substances and due to the difference in acidity, carboxylics are more involved in lower pH values and phenolics in higher pH values.63,64 The amount of Cu (II) bound to the humic fraction is greater than the amount bound to the fulvic fraction, this has been attributed to the presence of phenolic and carboxylic groups adjacent to the aromatic ring, such as phthalic or salicylic acids, capable of forming strong complexes with Cu (II). These groups are present in greater quantities in humic acids than in fulvic acids.64
CONCLUSIONS The techniques of synchronized fluorescence spectroscopy and UV - Vis absorbance were used successfully to characterize the organic matter dissolved in the water of an environment not affected by anthropogenic activities, identifying the sources and main components. The synchronous fluorescence spectra did not show qualitative differences for the samples collected during dry and rainy seasons. One of these peaks is associated with fulvic acids fraction, while the other one is related to polycondensed phenolic aromatic compounds, such as humic acids, which demonstrates that organic matter in the waters of Cipó Waterfalls (located in Serra de Itabaiana National Park) is predominantly from natural sources. From the behavior of fluorescence quenching after copper addition, it was possible to assess the complexation ability of Cu(II) ions with the two fluorescent sites (fulvic and humic acids) in the DOM, being the humic acid the component with larger fraction of fluorophores available for copper complexation. Photodegradation experiments showed that natural DOM has a lower photodegradation potential than DOM of impacted environments.
ACKNOWLEDGMENTS The authors thank the Coordenação de Aperfeiçoamento de Pessoal de Nível Superior (CAPES) and Conselho Nacional de Desenvolvimento Científico e Tecnológico (CNPq), for scholarships.
REFERENCES 1. Lennon, J. T.; Pfaff, L. E.; Aquat. Microb. Ecol. 2005, 39, 119. 2. Lu, X. Q.; Jaffé, R.; Childers, D. L.; Maie, N.; Water Research 2006, 37, 2606. 3. Al-Reasi, H. A.; Wood, C. M.; Smith, D. S.; Aquat. Toxicol. 2011, 103, 190. 4. Elliott, S.; Lead, J. R.; Baker, A.; Water Research 2006, 40, 2083. 5. He, W.; Chen, M.; Schlautman, M. A.; Hur, J.; Sci. Total Environ. 2016, 551, 428. 6. Painter, S. C.; Lapworth, J. L.; Woodward, M. S.; Evans, C. D.; Sanders, R.; J. Sci. Total Environ. 2018, 630, 647. 7. Artifon, V.; Zanardi-Lamardo, E.; Fillmann, G.; Sci. Total Environ. 2019, 649, 1635. 8. Leenheer, J. A.; Croué, J. P.; Environ. Sci. Technol. 2003, 37, 26A. 9. Patel-Sorrentino, N.; Mounier, S.; Lucas, Y.; Benaim, J. Y.; Sci. Total Environ. 2004, 321, 239. 10. Świetlik, J.; Dąbrowska, A.; Raczyk-Stanisławiak, U.; Nawrocki, J.; Water Research, 2004, 38, 558. 11. Croué, J. P., Benedetti, M. F., Violleau, D.; Leenheer, J. A.; Environ. Sci. Technol. 2003, 37, 336. 12. Nebbioso, A.; Piccolo, A.; Anal. Bioanal. Chem. 2013, 405, 124. 13. Otero, E.; Culp, R.; Noakes, J. E.; Hodson, R. E.; Limnol. Oceanogr. 2000, 45, 1763. 14. So, S. H.; Choi, I. H.; Kim, H. C.; Maeng, S. K.; Sci. Total Environ. 2017, 592, 592. 15. Fabris, R.; Chow, C. W. K.; Drikas, M.; Eikebrokk, B.; Water Research 2008, 42, 4196. 16. Lapierre, J.; Guillemette, F.; Martin B. M.; Del Giorgio, P. A.; Nat. Commun. 2013, 4, 7. 17. Fasching, C.; Behounek, B.; Singer, G. A.; Battin, T. J.; Sci. Rep. 2014, 4, 7. 18. Battin, T. J.; Kaplan, L. A.; Findlay, S.; Hopkinson, C. S.; Marti, E.; Packman, A. I.; Newbold, J. D.; Sabater, F.; Nat. Geosci. 2008, 1, 100. 19. Butman, D.; Raymond P. A.; Nat. Geosci, 2011, 4, 842. 20. Raymond, P. A.; Hartmann, J.; Lauerwald, R.; Sobek, S.; Mcdonald, C.; Hoover, M.; Butman, D.; Striegl, R.; Mayorga, E.; Humborg, C.; Kortelainen, P.; Dürr, H.; Meybeck, M.; Ciais, P.; Guth, P.; Nature 2013, 503, 359. 21. Marín-Spiotta, E.; Gruley K. E.; Crawford, J.; Atkinson, E. E.; Miesel, J. R.; Greene, S.; Cardona-Correa, C.; Spencer, R. G. M.; Biogeochemistry 2014, 117, 297. 22. Kowalczuk, P.; Durako, M. J.; Young, H.; Kahn, A. E.; Cooper, W. J.; Gonsior, M.; Mar. Chem. 2009, 113, 196. 23. Monteiro, A. S. C.; Parat, C.; Rosa, A. H.; Pinheiro, J. P.; Talanta 2016, 152, 118. 24. Xu, H.; Guo, L.; Water Research 2017, 117, 126. 25. Arguelho, M. L. P. M.; Alves, J. P. H.; Monteiro, A. S. C.; Garcia, C. A. B.; Environ. Monit. Assess 2017, 189, 12. 26. Brooks, M. L.; McKnight, D. M.; Clements, W. H.; Limnol. Oceanogr. 2007, 52, 779. 27. Craven, A. M.; Aiken, G. R.; Ryan, J. N.; Environ. Sci. Technol. 2012, 46, 9955. 28. Al-Reasi, H. A.; Wood, C. M.; Smith, D. S.; Aquatic Toxicology 2011, 103, 179. 29. Weishaar, J. L.; Aiken, G. R.; Bergamaschi, B. A.; Fram, M. S.; Fujii, R.; Mopper, K.; Environ. Sci. Technol. 2003, 37, 4708. 30. Hudson, N.; Baker, A; Reynolds, D. M.; Rivers Research and Applications 2007, 23, 649. 31. Peiris, R. H.; Hallé, C.; Budman, H.; Moresoli, C.; Peldszus, S.; Huck, P. M.; Legge, R. L.; Water Research 2010, 44, 194. 32. Costa, A. S.; Passos, E. A.; Garcia, C. A. B.; Alves, J. P. H.; J. Braz. Chem. Soc. 2010, 22, 2147. 33. Murphy, K. R.; Stedmon, C. A.; Graeber, D.; Bro, R. Anal. Methods 2013, 5, 6566. 34. Li, P.; Chen, L.; Zhang, W.; Huang, Q.; PloS One 2015, 10. 35. Hansen, A. M.; Kraus, T. E. C.; Pellerin, B. A.; Fleck, J. A.; Downing, B. D.; Bergamaschi, B. A.; Limnol. Oceanogr. 2016, 61, 1032. 36. Moran, M. A.; Sheldon, W. M.; Zepp, R. G.; Limnol. Oceanogr, 2000, 45, 1264. 37. Jaffé, R.; Boyer, J. N.; Lu, X.; Maie, N.; Yang, C.; Scully, N. M.; Mock, S.; Mar. Chem. 2004, 84, 210. 38. Battin, T. J.; Org. Geochem. 1998, 28, 569 39. Winter, A. R., Fish, T. A. E., Playle, R. C., Smith, D. S.; Curtis, P. J.; Aquat. Toxicol. 2007, 8, 222. 40. Kothawal, D. N.; Von Wachenfeldt, E.; Koehler, B.; Tranvik, L. J.; Sci. Total Environ. 2012, 433, 246. 41. Meng, F.; Huang, G.; Yang, Y.; Li, Z.; Li, J.; Cao, J.; Wang, Z.; Sun, L.; Water Research 2013, 47, 5039. 42. Wang, Z.; Cao, J.; Meng, F.; Water Research 2015, 68, 413. 43. Yu, H.; Song, Y.; Du, E.; Yang, N.; Peng, J.; Liu, R.; Environ. Sci. Pollut. Res. 2016, 23, 10655. 44. Henderson, R. K.; Baker, A.; Murphy, K. R.; Hambly, A.; Stuetz, R. M.; Khan, S. J.; Water Research 2009, 43, 881. 45. Baghoth, S. A.; Sharma, S. K.; Amy, G. L.; Water Research 2011, 45, 809. 46. Hur, J.; Lee, B.; Chemosphere 2011, 83,1611. 47. IBAMA. https://pt.scribd.com/document/274229717/51-Parque-Nacional-Itabaiana-Se, acessada em abril 2020. 48. Lu, X. Q.; Jaffé, R.; Water Research 2001, 35, 1803. 49. Silva, E. J. C. G.; Machado, A. A. S. C.; Oliveira, C. J. S.; Pinto, M. S. S. D. S.; Talanta 1998, 45, 1165. 50. Matilainen, A.; Gjessing, E.T.; Lahtinen, T.; Hed, L.; Bhatnagar, A.; Sillanpää, M.; Chemosphere 2011, 83, 1431. 51. Araújo, A. B.; Rosa, A. H.; Rocha, J. C.; Romão, L. P. C.; Quim. Nova 2002, 25, 1107. 52. Jaffé, R.; Mcknight, D; Maie, N.; Cory, R.; Mcdowell, W. H.; Campbell, J. L.; J. Geophys. Res. 2008, 113. 53. Santos, A. C.; Romão, L. P. C.; Oliveira, V. L.; Santos, M. C.; Garcia, C. A. B.; Pescara, I. C.; Zara, L. F.; J. Braz. Chem. Soc. 2011, 22, 103. 54. Coble, P. G.; Green, S. A.; Blough, N. V.; Gagosian, R. B.; Nature 1990, 348, 435. 55. Stedmon, C. A.; Markager, S.; Bro, R.; Mar. Chem. 2003, 82, 239. 56. Miano, T. M.; Senesi, N.; Sci. Total Environ. 1992, 118, 41. 57. Yang, X.; Meng, F.; Huang, G.; Sun, L.; Lin, Z.; Water Research 2014, 62, 292. 58. Zhang, Y.; Liu, M; Qin, B.; Feng, S.; Hydrobiologia, 2009, 627, 159. 59. Sodré, F. F; Grassi, M. T.; J. Braz. Chem. Soc. 2000, 18, 1144. 60. Antunes, M. C. G.; Pereira, C. C. C.; Da Silva, E. J. C. G.; Anal. Chim. Acta, 2007, 595, 18. 61. Yamashita, Y.; Jaffé, R.; Environ. Sci. Technol., 2008, 42, 7379. 62. Wei, J.; Han, L.; Jing S. J.; Chen, M.; Int. J. Mol. Sci. 2015, 16, 14476. 63. Milne, C. J.; Kinniburgh, D. G.; Tipping, E. Environ. Sci. Technol 2001, 35, 2059. 64. Gondar, D.; Iglesias, A.; López, R.; Fiol, S.; Antelo, J. M.; Arce, F.; Chemosphere 2006, 63, 82. |
On-line version ISSN 1678-7064 Printed version ISSN 0100-4042
Qu�mica Nova
Publica��es da Sociedade Brasileira de Qu�mica
Caixa Postal: 26037
05513-970 S�o Paulo - SP
Tel/Fax: +55.11.3032.2299/+55.11.3814.3602
Free access


