
 |
 |
 |
 |
 |
Artigo
| An approach based on electrochemical impedance spectroscopy to study the glycerol/biodiesel gravity separation |
|
Karen Gómez-Hernández; Rodrigo Patiño; Luis Maldonado-Lópezand; Luis Díaz-Ballote*
Departamento de Física Aplicada, Centro de Investigación y de Estudios Avanzados, Unidad Mérida, km 6 antigua carr. a Progreso, 97310 Mérida - Yucatán, México Recebido em 15/05/2020 *e-mail: luisdiaz@cinvestav.mx In this study, electrochemical impedance spectroscopy (EIS) is evaluated as a novel application in the biodiesel purification process. EIS is proposed as a tool to study the behavior of charge carriers produced from side reactions or dissociations of some impurities during the gravitational separation of glycerol dispersed in crude biodiesel after the transesterification process. In the present study, EIS combined with a simple capacitor of two parallel plates made of stainless steel ASTM 304 with an area of 7.0 cm2 and a gap between the plates of 0.8 mm is demonstrated to be a promising technique to monitor the biodiesel/glycerol separation as a function of time. From the analysis of the impedance data, collected during the separation process, it was found that the biodiesel resistance increases up to a maximum value and then decreases to a value which corresponds to the final equilibrium state. Considering that the maximum resistance represents the less contaminated biodiesel as a criterion, the proper average biodiesel/separation time of 4 h 14 min ± 1 h 11 min was determined. Another finding from the EIS results suggests that a growing absorbed film exists on the plate surface of the capacitor used as an impedance sensor. INTRODUCTION Biodiesel is widely accepted as a potential alternative to mitigate the pollution released by burning diesel derived from crude oil.1 Biodiesel is commonly produced by the well-known transesterification reaction.2 This method of producing biodiesel is preferred perhaps because it is relatively simple. In this process, a compound with abundant lipids (vegetable oils or animal fats) is reacted with an alcohol in the presence of a catalyst. The most frequently used reagents are vegetable oil, methanol, and KOH or NaOH. At the end of the process the products of the transesterification reaction are allowed to stand for a period of time to allow phase separation due to gravity.3,4 During decantation, glycerol sediments develop during the biodiesel phase near the funnel bottom.5 After the separation, both raw biodiesel and glycerol contain a notable amount of impurities such as alcohol, residual catalyst, water, unreacted oil and soap. Little attention has been given to the decantation step despite its relevance in the global process of conversion. A potential reason for this could be that the focus is mainly on the subsequent purification steps such as washing, alcohol recovery and biodiesel additives where a number of materials such as ion exchange resins, membranes,6 and enzymes among other novel adsorbents are under investigation. However, the separation step has a great impact on the production and operation costs of biodiesel.7-9 There is no doubt that the time to allow the reaction mixture to settle represents a cost and its reduction would help improve the biodiesel commercial feasibility.9 In addition, a more effective purification process can be achieved. Previous attempts to reduce the glycerol settling time (GST) have been reported by Shirazi et al. and Noureddin et al..8,10 In both cases, the proposal is to use NaCl to accelerate the biodiesel-glycerol separation. The authors demonstrated that NaCl can be used to significantly reduce the GST. There is not a general agreement about the best period to let the reaction mixture settle. A common practice is to let the reaction mixture to stand overnight to allow glycerol separation.11 However, the literature has suggested settling times ranging from some minutes to up to 24 hours.12-14 Longer settling times could lead to expensive production times, but shorter settling times might be insufficient to acquire the highest level of cleanness through gravity separation. Therefore, by knowing the best glycerol separation time, the cost of biodiesel production could be reduced. Furthermore, regardless of the subsequent method used for the purification process, it would be more effective because with suitable decantation time the biofuel could arrive at the next step at the highest level of cleanness and increase the lifetime of absorbents used. Furthermore, biodiesel-glycerol separation is relevant from both a commercial and scientific perspective, and the knowledge of the sedimenting behavior of glycerol droplets would be a great contribution to the biodiesel production. Abeynaike et al.,5 studied the behavior of glycerol dispersed in biodiesel during sedimentation using optical and magnetic resonance imagining. They found that the behavior of dispersed glycerol droplets is size dependent. According to this study, most glycerol droplets move downwards as expected, but the authors demonstrate that there are small enough droplets moving upwards, transported by the biodiesel which is displaced upwards due to the sedimenting large glycerol droplets. The difference in color between biodiesel and glycerol droplets allowed the investigation of glycerol sedimentation. However, the amount of charge carriers derived from dissolved impurities in the residual water or in the alcohol present in the biodiesel could be a key parameter to developing another way to investigate the biodiesel/glycerol separation. Water-free crude biodiesel is unlikely because during the transesterification process the methanol and the alkaline catalyst react to produce water and ions. For example, when NaOH is dissolved in methanol, the reaction products are Na+, methoxide, and water:15  On the other hand, free fatty acids combined with NaOH could be another source of water and ions as shown:16  Obviously, water is the main impurity in the crude biodiesel and is a good solvent for various impurities. Free fatty acids could also contribute to the conductance of biodiesel generating H+ by its dissociation according to the reaction:17  As a result, a cathodic hydrogen reduction reaction:  and an anodic oxidation reaction:  could take place at an electrode interface. Therefore, the presence of charge carriers as impurities in the crude biodiesel would have a significant effect on the biodiesel resistance. The latter property makes the electrochemical impedance measurement a convenient and key method to study the biodiesel/glycerol separation. Electrochemical impedance spectroscopy (EIS) can help to determine the GST. EIS is becoming an increasingly attractive technique for various applications on biodiesel production. In 2012, Kung et al.18 suggested the use of EIS to determine the content of biodiesel in biodiesel/diesel blends using carbon paste electrodes. Five years later Pereira et al.,19 also reported that electrochemical impedance spectroscopy and two parallel stainless-steel electrodes can be an alternative tool to determine the biodiesel content in biodiesel/diesel blends. The water content in biodiesel is an important parameter of biodiesel quality and according to the data reported by Delfino et al.,20 EIS is a highly sensitive, precise and accurate analytical tool for water determination in biodiesel. EIS also offers a simple way for monitoring the purification process of biodiesel.21 It seems that EIS is a simple and versatile method for a wide range of applications in biodiesel. Here, the use of EIS is proposed as a method to study the biodiesel/glycerol separation and to determine GST. Therefore, the aim of the present study is to demonstrate that the electrical response of an impedance-based sensor could be helpful to monitor the amount of charged carriers during the decantation and to determine the suitable biodiesel-glycerol decantation time. During decantation, the concentration of ions or charge carriers derived from electrolyte impurities, change as the biodiesel phase approaches equilibrium. The presence of ions or charge carriers is associated with biodiesel conductance that is represented in this study by its inverse, known as resistance. The latter can be obtained from impedance measurements with a potentiostat.21 Therefore, by measuring the impedance, it is possible to evaluate the variation in charge carriers and determine the time needed to achieve the maximal electrical resistance of biodiesel which corresponds to biodiesel with the least ion content. This period represents the proper time to stop the decantation process and progress to the next step of purification. Longer decantation times could promote an increases of charge carrier in the biodiesel phase.
EXPERIMENTAL Materials Refined soybean oil for the transesterification reaction was purchased from a local convenience store. Analytical grade methanol and potassium hydroxide were purchased from Sigma-Aldrich. Deionized water and reagent grade acetone from Sigma-Aldrich were used for cleaning the stainless-steel sensor. Biodiesel preparation Conversion of oil to biodiesel was carried out by the conventional transesterification reaction.22,23 In this process 1 g of KOH was dissolved in 22 g of methanol, the mixture was poured in a glass reactor (250 mL) containing 100 g of soybean oil at a 60 ± 1.0 °C. The reaction time was 1 h and during this time the mixture was stirred (400 rpm). A condenser was coupled to the reactor to condense the methanol vapor released from the reaction mixture as an approach to keep the methanol concentration constant. After the conversion, glycerol that formed during the reaction was immediately removed from the reaction mixture. Then approximately 110 mL of crude biodiesel was poured in a glass beaker (200 mL) and the electrochemical sensor was immersed in the biodiesel to start the impedance measurements. Electrochemical measurements The electrochemical impedance measurements were carried out in a two-electrode cell formed of two 304 stainless steel parallel plates with a separation of 0.8 mm and a nominal area of 7 cm2 acting as an impedance-based sensor described in detail elsewhere.21 The separation was achieved using a polyvinyl chloride (PVC) disc 4 mm in diameter with thickness 0.8 mm. The disc and stainless-steel plates had a centered hole of 3.1 mm. Through this hole a non-conductive screw (PVC) of 3.1 mm in diameter was introduced to fit together all sensor parts including two stainless steel rods, each attached to a stainless-steel plate. The stainless-steel rods were used to connect the sensor to the potentiostat. The cell was connected to a Gamry 600 potentiostat. Incoming data from the potentiostat was analyzed with the software EchemAnalyst. The spectra were acquired at intervals of 30 min during a 24 h period using the Gamry sequence wizard. Main parameters for the measurements were a frequency in the range of 100 KHz to 0.2 Hz, a perturbation amplitude of 50 mV, and an acquisition rate of 10 points per decade. Spectra were also repeated but in the frequency range of 0.2 Hz to 100 KHz to test the stability experimentally. The elapsed time between the end of the transesterification process and the first impedance measurements was close to 30 min. This time was enough for the biodiesel to cool to room temperature (25 °C). Three batches of biodiesel were monitored with the electrochemical sensor for 24 h each.
RESULTS AND DISCUSSION Monitoring of the products of the transesterification reaction during the decantation process using impedance measurements and an impedance-based sensor In Figure 1a and 1b, a reduced number of spectra are displayed derived from the total number acquired during the 24 h period of a typical test for a clear illustration of the impedance behavior during the decantation process. Figure 1a contains spectra from the first 5 h and Figure 1b contains spectra from 5 to 24 h. The spectra were separated because a different behavior was observed as a function of the decantation time. All Nyquist plots show the same shape, a semicircle at high frequency and a straight line at low frequency. The presence of the straight line has been reported in various studies of EIS. For instance, EIS was proposed as an alternative to analyze electrical properties of CS-silane crosslinked-PVC films as a function of temperature and concentration of PVA. Their typical Nyquist plots presented a semicircle at high frequency and a straight line at low frequency which the authors called a spike. This spike was associated with low mobility of ions and high resistance to flow between the two electrodes.24 In the analysis of water content in biodiesel using EIS,20 the electrical response was characterized by a semicircle at high frequency and a straight line at low frequency. The straight line was attributed to processes on the electrode/solution interface.20 The Nyquist plots obtained from the study to determine biodiesel content in biodiesel/diesel blends also showed a capacitive arc at high frequency and a straight line at low frequency. The latter was attributed to a high resistive layer on the electrode surface.19 In our recent study,21 the straight line was attributed to the absorbed impurities on the surface of the impedance sensor which will vanish after the subsequent purification process. Consequently, the most important feature of the Nyquist plot is the high frequency capacitive arc which is attributed to the biodiesel (see a typical Nyquist plot of a neat biodiesel in Figure 1S of the complementary material). It is noted in Figure 1a that impedance increases up to a maximum, stops and starts to decrease (Figure 1b). This indicates that as a function of time the charge carriers decrease and then increase until the concentrations corresponds to that of the equilibrium.
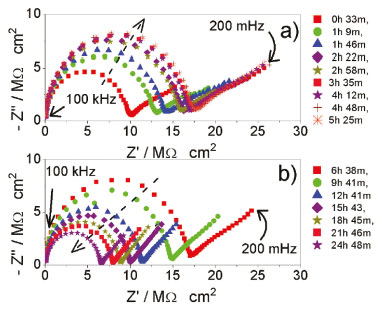 Figure 1. Representative Nyquist plots acquired over a 24 h period during decantation of a typical batch separated to illustrate the behavior a) between 0 and 5 h, and b) between 5 and 24 h
Validation of the impedance data Before fitting an equivalent circuit and analyzing the impedance data, its validity should be confirmed. This was conducted via Kramer-Kronig transforms. With this mathematical relationship, the real component is transformed into imaginary components and vice versa. A good fit with the experimental results indicates that impedance results meet the criteria of causality, linearity, and stability.25 The solid line represents the Kramer-Kronig function fitted to the experimental results in Figure 2a and 2b. From Figures 2a and 2b, a good fit can be observed. Figure 2c confirms the validation of impedance data by showing a residual error percent below 2% for both components (real and imaginary).26 The goodness of fit found was in the order of 10-5.
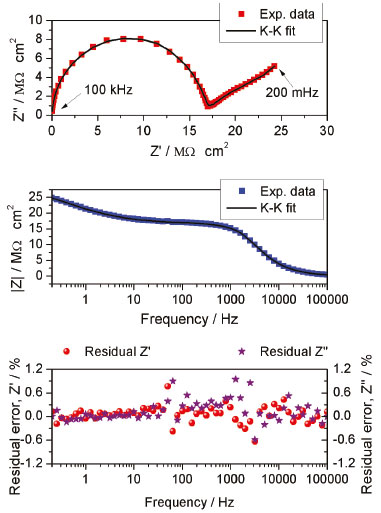 Figure 2. Kramer-Kronig test results for typical impedance data showing a good fit between the experiments (symbols) and K-K transformations. a) Nyquist plot, b) bode plots, and c) the residual error percentage for real and imaginary components
In addition to the Kramer-Kronig test, the impedance acquisition was also performed both back and forward to investigate the linearity and stability of the system.27,28 Typical results are illustrated in Figures 3a, 3b and 3c. The Nyquist plot in Figure 3a was acquired as usual, it means that the frequency varied from high to low frequency. In Figure 3b the Nyquist plot was acquired just after the previous plot (Figure 3a), but in this case the frequency was varied from low to high frequency. A good overlap of both plots can be observed in Figure 3c, confirming the stability of the system experimentally.
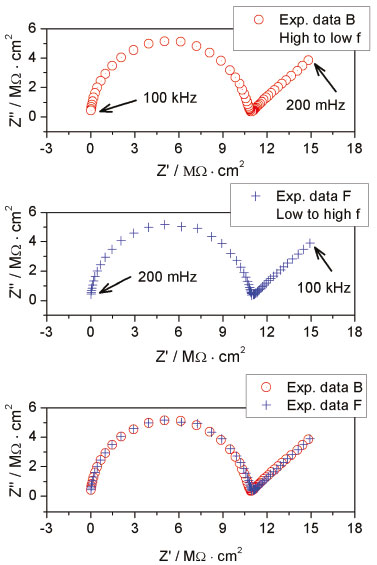 Figure 3. Experimental test for system stability. Nyquist plots back a) and forward b) as well both results in the same plot
Based on the physical shape of the impedance-based sensor (parallel plate capacitor) and the shape of the plots derived from the EIS results, the equivalent electrical circuit depicted in Figure 4 was proposed for modelling and analyzing the EIS results. The main electrical components are two constant phase elements that represent the capacitive effect of the impurities on the electrode surface (CPEc) and the capacitive effect of the two parallel stainless-steel sensor (CPEb). There are also two resistances, Rc that represents the contact resistance due to the impurities that are still present during the decantation of crude biodiesel, and Rb that represents the biodiesel resistance. There is not a solution resistance because a two-electrode cell configuration was used. Figure 5 shows how the contact resistance (Rc) varies with time. An increase of Rc is observed indicating the presence of a growing highly resistive film on the electrode surface. A potential reason for this is the adsorption of impurities such as glycerol on the plates of the capacitor used as the sensor. This film limits the ion mobility near the biodiesel/SS304 plate interface which results in an increasing contact resistance.
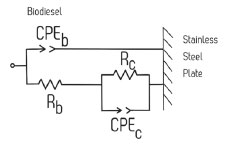 Figure 4. Equivalent circuit used for modelling the EIS results that describe the biodiesel impedance behavior during the decantation
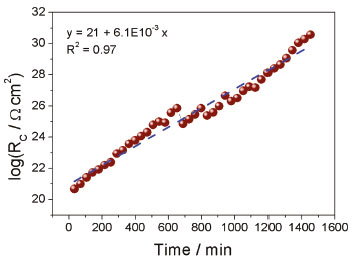 Figure 5. Contact resistance (Rc) variation with decantation time
Rb is the most interesting parameter, because its variation provides an indication of the biodiesel quality as was shown elsewhere.21 The typical behavior of Rb as a function of time is a resistance increase up to a maximum (a peak) that later decrease in the range of 7 to 8 MΩ cm2. In Figure 6 it is observed that resistance increase up to approximately 7.8 MΩ cm2, and a smooth decrease in the resistance was observed down to approximately 7.5 MΩ cm2. This value is in agreement with the starting resistance value reported for a crude biodiesel just after the transesterification process without any purification process.21 The average time to achieve the maximal value of Rb was found at 4 h 14 min ± 1 h 11min. The peak in the biodiesel resistance as a function of time can be explained in terms of glycerol behavior during its sedimentation in biodiesel previously reported by Abeynaike et al..5 According to the authors, during sedimentation there are droplets moving downwards and small droplets moving upwards. The resistance behavior of the biodiesel observed in the present study confirms the competition between two flow components. At the beginning of the decantation process, the observed increase in resistance indicates that the major flow component is the downward moving droplets, dragging the impurities and removing the charge carriers from the biodiesel bulk. However, after approximately 4 hours, most of the glycerol and impurities are located at the bottom of the container, and charged species dissolved in water or methanol are forced to flow upwards due to the biodiesel being displaced from the bottom resulting in a decrease in resistance. The increase in charged species in the bulk of the biodiesel continues to rise until a new equilibrium state is achieved.
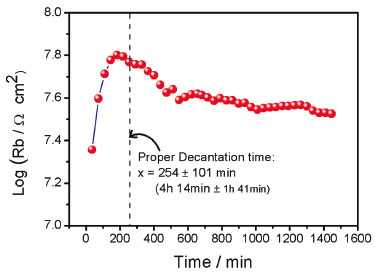 Figure 6. Resistance of biodiesel (Rb) as a function of decantation time showing a peak of Rb. The proper decantation time is determined by averaging the time corresponding to the peak of each impedance test and is indicated with the vertical dotted line
The charge carriers play a relevant role in biodiesel purification because they are associated with dissociated undesirable impurities. The impedance measured with the sensor proposed here, represents an indirect quantification of the impurity content. Although further studies with different feedstocks are required, the sensor is expected to be useful to monitor the glycerol decantation process irrespective of the feedstock used to produce the biodiesel since the sensor only detects the presence of charge carriers. On the other hand, although the sensor has a negligible cost (basically two stainless steel plates of 7 cm2), the whole measurement system could be expensive due to the commercial device used for the EIS measurement. However, it is important to note that progressive development in electronic components and the use of open source hardware/software platforms such Arduino have allowed successful fabrication of electrochemical measuring systems including a potentiostat,29 a scanning electrochemical microscope30 or an impedance measuring device31,32 with an estimated cost in the range of US$100 to US$200 dollar.29,30 This dramatic cost reduction in customized electrochemical devices could be extended to facilitate the commercialization of the impedance system to monitor the glycerol decantation in a near future. This capacity to monitor the separation process to determine the proper decantation time could result in a reduction in operation time and reduce the wash water required in the next purification step that would represent an economic and environmental benefit.
CONCLUSIONS A novel application of electrochemical impedance spectroscopy was proposed to study the biodiesel/glycerol separation and to determine the required proper time for glycerol separation from biodiesel. From the impedance measurements the following conclusions could be drawn: contact resistance (Rc) increases as a function of the elapsed time for the separation process; The contact resistance (Rc) is associated with absorbed impurities on the plates of the capacitive sensor; The behavior of the resistance of biodiesel during the separation process exhibits a maximum value that decreases until a relatively constant value is reached which corresponds to equilibrium; By using the peak resistance position in time as criteria, an average proper time for glycerol separation from biodiesel can be determined, which was of 4 h 14min ± 1h 11min in the present study. This value could vary depending on the production parameters, but it was demonstrated that through impedance measurements it could be set again. This study demonstrates a novel application of EIS and to our best knowledge no such behavior of the charge carriers in biodiesel during decantation has been previously reported.
SUPPLEMENTARY MATERIAL A Nyquist plot of neat biodiesel is available on http://quimicanova.sbq.org.br in the form of a pdf document, with free access.
ACKNOWLEDGEMENTS Special thanks to B. Lopez-Marrufo (research student) for conducting the impedance measurements. The measurements were performed on the electrochemical systems acquired through CONACYT grant 205050/2013.
REFERENCES 1. Ma, F.; Hanna, M. A.; Bioresour. Technol. 1999, 70, 1. 2. Moser, B. R.; Vitr. Cell. Dev. Biol. 2009, 45, 229. 3. Savaliya, M. L.; Dhorajiya, B. D.; Dholakiya, B. Z.; Sep. Purif. Rev. 2015, 44, 28. 4. Yongphet, P.; Wang, J.; Wang, D.; Mulbah, C.; Fan, Z.; Zhang, W.; Amaral, P. C. S.; Biomass Convers. Biorefinery 2020, 1. 5. Abeynaike, A.; Sederman, A. J. J.; Khan, Y.; Johns, M. L. L.; Davidson, J. F. F.; Mackley, M. R. R.; Chem. Eng. Sci. 2012, 79, 125. 6. Ostojčić, M.; Brkić, S.; Tišma, M.; Zelić, B.; Budžaki, S.; Kem. Ind. 2020, 69, 175. 7. Suthar, K.; Dwivedi, A.; Joshipura, M.; Asia-Pacific J. Chem. Eng. 2019, 14, e2361. 8. Shirazi, M. M. A.; Kargari, A.; Tabatabaei, M.; Mostafaeid, B.; Akia, M.; Barkhi, M.; Shirazi, M. J. A.; Bioresour. Technol. 2013, 134, 401. 9. Tabatabaei, M.; Karimi, K.; Horváth, I. S.; Kumar, R.; Biofuel Res. J. 2015, 2, 258. 10. Noureddin, A.; Shirazi, M. M. A.; Tofeily, J.; Kazemi, P.; Motaee, E.; Kargari, A.; Mostafaei, M.; Akia, M.; Karout, A.; Jaber, R.; Hamieh, T.; Tabatabaei, M.; Sep. Purif. Technol. 2014, 132, 272. 11. Alamu, O. J.; Dehinbo, O.; Sulaiman, A. M.; Leonardo J. Sci. 2010, 1, 95. 12. Anyanwu, C. N.; Mbajiorgu, C. C.; Oparaku, O. U.; Odigboh, E. U.; Emmanuel, U. N.; Energy Convers. Manage. 2012, 62, 40. 13. Ogunwole, O. A.; Leonardo J. Sci. 2015, 27, 63. 14. Luu, P. D.; Truong, H. T.; Luu, B. Van; Pham, L. N.; Imamura, K.; Takenaka, N.; Maeda, Y.; Bioresour. Technol. 2014, 173, 309. 15. Gu, L.; Huang, W.; Tang, S.; Tian, S.; Zhang, X.; Chem. Eng. J. 2015, 259, 647. 16. Lim, B. P.; Maniam, G. P.; Hamid, S. A.; European Journal of Scientific Research 2009, 33, 347. 17. Sankaran, A.; Staszel, C.; Mashayek, F.; Yarin, A. L.; Electrochim. Acta 2018, 268, 173. 18. Kung, Y.; Cheng, T. J.; Chen, R. L. C.; Meas. Sci. Technol. 2013, 24, 724. 19. Pereira, T. C.; Delfino, J. R.; Ferreira, A. A. P.; Barros, F. J. S.; Marques, E. P.; Zhang, J.; Marques, A. L. B.; Electroanalysis 2017, 29, 814. 20. Delfino, J. R.; Pereira, T. C.; Costa Viegas, H. D.; Marques, E. P.; Pupim Ferreira, A. A.; Zhang, L.; Zhang, J.; Brandes Marques, A. L.; Talanta 2018, 179, 753. 21. Díaz-Ballote, L.; Maldonado, L.; Genesca, J.; Hoil-Canul, E. R.; Vega-Lizama, T.; Fuel 2020, 265, 116880. 22. Vicente, G.; Martínez, M.; Aracil, J.; Bioresour. Technol. 2007, 98, 1754. 23. Saydut, A.; Kafadar, A. B.; Tonbul, Y.; Kaya, C.; Aydin, F.; Hamamci, C.; Energy Explor. Exploit. 2010, 28, 499. 24. Islam, A.; Imran, Z.; Yasin, T.; Gull, N.; Khan, S. M.; Shafiq, M.; Sabir, A.; Munawar, M. A.; Raza, M. H.; Jamil, T.; Mater. Res. 2015, 18, 1256. 25. de Faria, R. A. D.; Lins, V. de F. C.; Nappi, G. U.; Matencio, T.; Heneine, L. G. D.; Bionanoscience 2018, 8, 988. 26. Macdonald, M. A.; Andreas, H. A.; Electrochim. Acta 2014, 129, 290. 27. Fernández Pulido, Y.; Blanco, C.; Anseán, D.; García, V. M.; Ferrero, F.; Valledor, M.; Measurement: Journal of the International Measurement Confederation 2017, 106, 1. 28. Lu, P.; Kursten, B.; Macdonald, D. D.; Electrochim. Acta 2014, 143, 312. 29. Sánchez, C.; Dessì, P.; Duffy, M.; Lens, P. N. L.; Biosens. Bioelectron. 2020, 150, 111884. 30. Guver, A.; Fifita, N.; Milas, P.; Straker, M.; Guy, M.; Green, K.; Yildirim, T.; Unlu, I.; Yigit, M. V.; Ozturk, B.; HardwareX 2019, 6, 31. 31. Jenkins, D. M.; Lee, B. E.; Jun, S.; Reyes-De-Corcuera, J.; McLamore, E. S.; J. Electrochem. Soc. 2019, 166, B3056. 32. Grassini, S.; Corbellini, S.; Parvis, M.; Angelini, E.; Zucchi, F.; Measurement: Journal of the International Measurement Confederation 2018, 114, 508.PP |
On-line version ISSN 1678-7064 Printed version ISSN 0100-4042
Qu�mica Nova
Publica��es da Sociedade Brasileira de Qu�mica
Caixa Postal: 26037
05513-970 S�o Paulo - SP
Tel/Fax: +55.11.3032.2299/+55.11.3814.3602
Free access