Artigo
| Main minerals and organic compounds in commercial roasted and ground coffee: an exploratory data analysis |
|
Daneysa Lahis KalschneI; Nathalia Karen SilvaI; Cristiane CananI; Marta de Toledo BenassiII; Eder Lisandro Moraes FloresIII; Oldair Donizete LeiteIII,*
I. Departamento de Alimentos, Universidade Tecnológica Federal do Paraná, 85884-000, Medianeira - PR, Brasil Recebido em 05/08/2020 *e-mail: oldair.leite@gmail.com Coffee is one of the most popular beverages in the world, however, little information is found regarding the mineral composition of commercial roasted and ground coffees (RG) and its correlation with organic bioactive compounds. 21 commercial Brazilian RG coffee brands - 9 traditional (T) and 12 extra strong (ES) roasted ones - were analyzed for the Cu, Ca, Mn, Mg, K, Zn, and Fe minerals, caffeine, 5-caffeoylquinic acid (5-CQA) and melanoidins contents. For minerals determination by flame atomic absorption spectrometry (FAAS), the samples were decomposed by microwave-assisted wet digestion. Caffeine and 5-CQA were determined by liquid chromatography and melanoidins by molecular absorption spectrometry. The minerals and organic compounds contents association in RG coffee was observed by a principal component analysis. The thermostable compounds (minerals and caffeine) were related to dimension 1 and 2, while 5-CQA and melanoidins were related to dimension 3, allowing for the T coffees segmentation from ES ones. INTRODUCTION Brazil is the world's largest coffee producer and exporter, with an estimated production from 57.2 to 62.0 million 60 kg-bags in 2020.1 Coffea arabica and Coffea canephora species are the mostly cultivated and marketed ones. According to the Brazilian Coffee Industry Association (ABIC), coffee beverage consumption in Brazil in 2017 was 83 L per capita and the filtered-brew type prepared with roasted and ground (RG) coffee is the one most consumed.2 RG coffee in Brazil is marketed in 3 categories - gourmet, superior, and traditional/extra-strong - based on the global quality of beverages evaluated by professional cuppers using a 10-grade scale. Taking into account the 896 ABIC-certified brands in 2019, 55% were graded as traditional/extra-strong, the most sold ones in the Brazilian domestic market. For the traditional/extra-strong category, the raw material may be Coffea arabica or Coffea canephora blends at least NY (New York) 8 types with a maximum 20% (w/w) of defects and with overall beverage quality graded between 4.5 and 6.3 In the Brazilian market, traditional-graded coffees (T) with a more intense roasting process are usually labelled as extra-strong (ES). In short, coffees with more defects are subjected to more aggressive roasting processes to disguise their unpleasant aroma and flavor characteristics. The mineral content ratio in coffee leaves and beans, mineral supplementation in the plant, and the coffee beverage's quality have been the focus of various studies.4-7 Some researches on the mineral content in green coffee are found in order to identify the region of origin.8-12 Minerals are stable to the roasting process and thus have an advantage over organic compounds, which were exposed to matter degradation.13 However, the mineral content in RG is affected by both environmental and agronomic conditions. During coffee plant nutrition, minerals are usually absorbed from the soil and complemented by fertilizers.12 In this respect, bioactive organic compounds have been gaining ever increasing attention in the literature for several reasons. Coffee bioactive compounds are well recognized by their health benefits, such as positive memory effects, chronic degenerative diseases prevention,14,15 and also an inverse link with the total mortality risk.16 Despite their different genetic and environmental conditions from minerals, some bioactive hydrosoluble compounds (e.g., chlorogenic acid and melanoidins) are highly dependent on the roasting process.17,18 However, studies on mineral contents in roasted coffees, combined with the bioactive organic compounds determination are scarce in the literature. Some authors have focused solely on the mineral profile19-22 and others on organic compounds.23-25 The few existing studies combining these two approaches are limited to green coffees beans or coffee brews.8,26 No research has been found on inorganic and organic compounds and its relationships in RG coffees - material for most coffee beverages. In this context, the aim of this study was to provide the main mineral composition (Ca, Cu, Mn, Mg, K, Zn, and Fe contents) and bioactive hydrosoluble compounds (caffeine, 5-caffeoylquinic acid, and melanoidins) on traditional RG coffee types marketed in Brazil.
EXPERIMENTAL Reagents, standards, equipment and materials Reagents, solvents and analytical grade materials used: ultrapure water obtained with an ultra-purifier system (18.2 MΩ cm resistivity, Master System®, Gehaka, São Paulo, Brazil); concentrated nitric acid (HNO3) ( 65% w/v, Sigma Aldrich, St. Louis, USA) - previously purified in a quartz sub-boiling system (model DuoPur®, Milestone, Sorisole, Italy); concentrated hydrogen peroxide (H2O2) (30% v/v, Sigma Aldrich, St. Louis, USA); HPLC grade acetonitrile (J.T. Baker, Phillipsburg, USA); acetic acid (purity ≥ 99.8%, Sigma Aldrich, St. Louis, USA); for flame atomic absorption spectrometer (FAAS), the aqueous reference solutions containing Ca, Cu, Fe, K, Mg, Mn, and Zn prepared from each elemental standard (1000 µg mL-1, SCP Science, Baie-d'Urfé, Canada) by serial dilutions. The analysis accuracy procedure was verified using a standard reference material (Embrapa RM-Agro E1001 (FO-01/12), Brachiaria brizantha cv Marandu) digested under similar conditions applied for coffee samples. For HPLC analysis, the following chromatographic standards were used: caffeine and 5-caffeoylquinic acid (5-CQA) (Sigma Aldrich, St. Louis, USA) and an Acclaim® TM Polar advantage II C18 column (3 µm, 120 A, 4.6 x 150 mm) (Thermo Fisher Scientific, Germering, Germany). Coffee samples 21 RG coffee commercial samples were purchased from a local supermarket in the municipality of Medianeira, Paraná, Brazil. All samples weighted 500 g and were vacuum-packed. 9 of them were labelled as traditional (T) and 12 as extra strong (ES). The RG coffees color-characterization was done by lightness (L*)27 measurements in triplicate using a colorimeter (CR-400, Konica Minolta, Tokyo, Japan). The analysis was carried out under an integrating sphere and a 45° viewing angle (lighting d/45 and illuminating D). Microwave digestion and mineral determinations Microwave digestion was performed according to Amorim Filho et al. in triplicate.19 Each sample was weighed (0.400 g) in 50 mL PTFE-TFM closed vessels (standing 310 °C and 40 bar), added with 3 mL HNO3 (65% w/v) and 2 mL H2O2 (30% v/v) and left open at room temperature for 20 min. The samples were subjected to wet digestion using a microwave oven (Multiwave GO®, Anton Paar, Graz, Austria). The USEPA 3052 digestion method was used by linearly increasing the temperature to 180 °C for 4.5 min, kept for 9.5 min and then cooled. Mineral determination was carried out using a flame atomic absorption spectrometer (FAAS) equipped with a Deuterium background correction system (model AA 240-FS, Varian, Australia). K was determined by emission mode, whereas all other analytes were determined by absorption mode. The Schinkel modifier (0.5% v/v) was added to all digested samples and reference solutions. External calibration with a 7-point analytical curve for each analyte was performed at the concentration range described in Table 1. The other FAAS operational conditions for each analyte are shown in Table 1.
Organic compounds extraction and caffeine, 5-CQA, and melanoidins determination Simultaneous caffeine and 5-CQA analyses and melanoidins estimates were performed as per Kalschne et al..28 Aqueous extracts were obtained in triplicate for the organic compounds determination. Each coffee sample (0.5000 g) was extracted with 30 mL ultrapure water at 80 °C for 10 min and filtered using qualitative paper. For HPLC analysis, a 1 mL extract aliquot was diluted in 5.0 mL acetic acid: water (5:95 v/v). The extract was filtered (0.45 µm) and injected (20 μL) into the chromatograph (Ultimate 3000, Thermo Scientific, Germering, Germany). The mobile phase comprised of acetic acid/ultrapure water (5:95 v/v) (A) and acetonitrile (B), and the following gradient elution was used: 1 min, 5% B; 5 min, 13% B with 0.6 mL min-1. Caffeine and 5-CQA detection were set at 272 and 320 nm, respectively, and identification was based on retention times and UV spectra. Quantification was performed in triplicate (R2 ≥ 0.999 and P < 0.001) by external standardization using 6-point analytical curves (20 to 60 μg mL-1 for caffeine and 0.5 to 30 μg mL-1 for 5-CQA). Melanoidins were estimated by diluting 0.6 mL of aqueous extract in 1.4 mL ultrapure water to achieve a 5 mg coffee mL-1 concentration. Absorbance was measured at 420 nm using a spectrophotometer (Perkin Elmer, Lambda XLS, Beaconsfield, UK). The melanoidins content was estimated based on the 1.1289 L g-1 cm-1 absorptivity value proposed by Tagliazucchi et al..29 A coffee brew was used as melanoidins source to obtain an analytical curve (7 points in triplicate, R2 = 1) at a 1 to 7 mg coffee mL-1 concentration range corresponding to a 0.092 to 1.001 absorbance range. The analysis was performed in triplicate and the results expressed in mg of melanoidins 100 g-1 of coffee. Data analysis The data obtained were expressed as average ± standard deviation, with the averages compared by the Tukey test (p ≤ 0.05). Moreover, for the mineral and organic profile overview, all data were analyzed by Principal Component Analysis (PCA) and Person's correlation (p ≤ 0.05) using the Statistica 8.0 software.
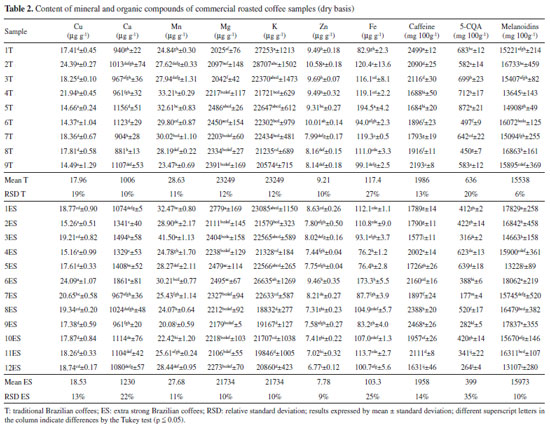
RESULTS AND DISCUSSION The lowest average L* value for ES coffees (19.70 ± 1.25) suggests that they were subjected to a more intense roasting process compared to T coffees (20.75 ± 1.42). However, Souza et al. (2010) observed no difference on the average L* value for T (19.5) and ES (20.5) Brazilian RG coffees, respectively. Such results reinforced that the ES coffee does not necessarily present a darker color. When analyzing samples from different Brazilian brands, origins, and processing techniques, it was observed that the extra strong coffees had a slightly lower L* value than the traditional ones. Coffee samples mineral contents The commercial RG coffee presented a mineral content ranging from 18832 to 28707 µg g-1 for K; 2025 to 2779 µg g-1 for Mg; 881 to 1861 µg g-1 for Ca; 76.2 to 194.5 µg g-1 for Fe; 20.08 to 41.50 µg g-1 for Mn; 14.37 to 24.39 µg g-1 for Cu, and 4.68 to 10.58 µg g-1 for Zn (Table 2).
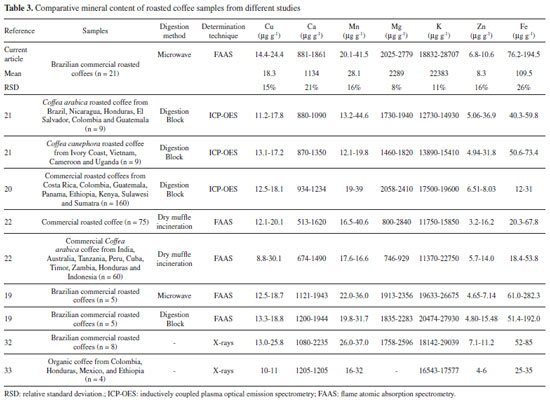
The mineral content was in the range found in the literature for RG coffees (commercial Coffea arabica, Coffea canephora, blends of both species or non-identified coffee of different origins and roasting degrees). Unlike various organic compounds, the minerals found in coffee are not affected by the roasting process;30 and they are nearly entirely found in the final beverage due to their water solubility.31 Different researches have described macronutrient contents ranging from 11370 to 29039 µg g-1 for K, 476 to 2840 µg g-1 for Mg, and 513 to 2235 µg g-1 for Ca (Table 3). The Fe micronutrient content ranged from 12 to 282.3 µg g-1, from 12.1 to 44.66 µg g-1 for Mn, from 8.8 to 30.1 µg g-1 for Cu, and from 3.2 to 36.9 µg g-1 for Zn.19-22,32-33 Further mineral content details found in other studies are seen in Table 3.
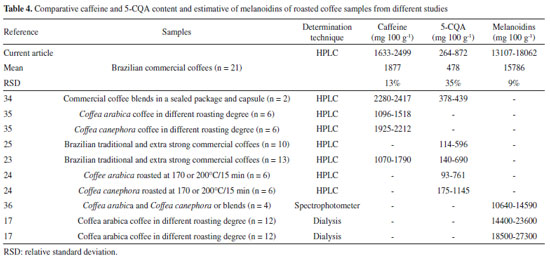
For the macronutrient content, K was the main mineral present on coffee followed by Mg and Ca, similar to that previously described by other researchers.19-22 According to Martinez et al., the K requirement for the coffee plant is close to that of N, with the highest amount of mineral found in coffee beans.4 Fe was the fourth most abundant mineral found in coffee samples, followed by Mn, Cu and Zn as previously described by other authors (Table 3).19-22 Moreover, Debastiani et al. reported that K and Mg are extracted by the drip brewing process, while Ca, Fe, Cu and Zn may be absorbed by spent coffee, which has a sponge-like behavior.32 Caffeine, 5-CQA and melanoidins content in coffee samples The caffeine content ranged from 1577 to 2499 mg 100 g-1, while the 5-CQA content ranged from 177 to 872 mg 100 g-1. The melanoidins ranged from 13107 to 18062 mg 100 g-1 (Table 2). Caffeine and 5-CQA content in commercial roasted and ground coffees fell within the range found in the literature for Coffea arabica, Coffea canephora, blends and commercial coffees of different origins and various roasting degrees. The content ranges reported by other studies were from 1070 to 2417 mg 100 g-1 for caffeine, 93 to 1145 mg 100 g-1 for 5-CQA, and from 10640 to 27300 mg 100 g-1 for melanoidins (Table 417,23-25,34-36).
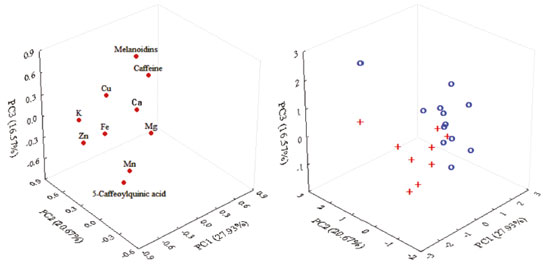
Commercial coffees in Brazil do not usually show the material (Arabica or blended species) or roasting degree on their information labels, but some assumptions may be made based on the composition. For thermostable caffeine, it is well known that Coffea canephora has higher contents than Coffea arabica ones.31,36 For 5-CQA, in addition to species variations (Coffea canephora have lower 5-CQA content than Coffea arabica), which is less significant, the chlorogenic acids undergo many changes during the roasting process such as isomerization, epimerization, lactonization, and degradation to low-molecular-weight compounds during the roasting process,37 which justify their lower content in roasted coffees.17,18 Melanoidins are brown bioactive compounds produced during the roasting process by the Maillard reaction. No differences in melanoidins content were observed in the RG coffee species, however, a roasting degree increase usually increases the melanoidins content.17,28,38 Principal component analysis A three-dimensional consensual solution explained 65% roasted coffee samples variance (Figure 1). Dimension 1 justified 28% of variance and it was highly and positively correlated to all mineral contents and, to a lesser extent, to 5-CQA. A positive correlation was observed between some minerals, however, it was weak (< 0.68) (data not shown).
 Figure 1. PC1 versus PC2 versus PC3 loadings and scores plots of coffee samples (+: traditional Brazilian coffees; ο: extra strong Brazilian coffees)
Dimension 2 explained 21% of variance and was mainly positively correlated to caffeine, K, and melanoidins contents. According to the literature, caffeine could be found in a complex with polyphenols even in green coffee beans. A well-known feature for the two compound classes is their interaction to form an easily found complex: crystalline caffeine potassium chlorogenate 1:1.37,39 This approach may justify the link between caffeine and K content in coffee samples. Moreover, Clemente et al. previously reported the correlation between higher K content and caffeine content increase on coffee beans.6 A negative association between caffeine and melanoidins content may be related to the caffeine thermostability and the melanoidins formation during the roasting process. As reported by Vignoli et al., other bioactive compounds responsible for the coffee's antioxidant activity, such as 5-CQA - except caffeine and melanoidins - have decreased with the roasting process.17 To a lesser extent, Dimension 2 correlated negatively caffeine with Mn and Mg. Caffeine is a secondary metabolite of coffee plant with effects on central nervous system stimulation. Its precursor is theobromine, with three N-methyltransferases involved in its biosynthesis.4 According to Suzuki and Takahashi, methyltransferases do not require divalent cations such as Mg2+ and Mn2+.40 Since the mineral chelating agents have only partially inhibited both theobromine and caffeine formation, it appears reasonable that the caffeine content increases while the Mn and Mg contents decrease on coffee beans. It is a well-known fact that caffeine content is coffee-species-dependant. T (1986 ± 265; RSD 13%) and ES coffees (1958 ± 282; RSD 14%) caffeine contents were similar considering the average (P < 0.05) and variation (considering RSD). The literature reports a caffeine content of around 1% for Coffea arabica (1100 to 1300 mg 100 g-1) and 2% for Coffea canephora (2400 to 2500 mg 100 g-1).15,31 In this context, considering that all RG coffee samples evaluated had high caffeine amounts (around 2%), it is suggested that all samples could have a considerable Coffea canephora amount in their blend. Dimension 3 explained 16.57% of variance and was positively correlated to 5-CQA content and negatively correlated to the melanoidins content. Such dimension was correlated to a roasting degree, segmenting T coffees (at bottom of the plot) from ES ones (top of the plot). Significant beans composition changes occurred during the roasting process due to pyrolysis, caramelization, and Maillard reactions.37 Melanoidins were formed by the interaction among polysaccharides, galactomannans, and arabinogalactans (the latter being mostly covalently linked to proteins in green coffee beans), proteins (amino acids), and chlorogenic acids. Therefore, when chlorogenic acids were degraded during roasting, melanoidins were formed (with chlorogenic acids incorporated in their structure).17,31,41 The 5-CQA content for T (636 ± 126; RSD 20%) and ES coffees (400 ± 140; RSD 35%) suggest that ES coffees were more intensely roasted and had a greater roasting process variation. The principal component analysis by dimension 3 allowed the coffee segmentation into traditional and extra strong. Dimensions 1 and 2 showed the occurrence of a correlation between minerals and organic compounds (i.e. caffeine), mainly associated with agricultural treatments and agronomic conditions. Since the minerals and caffeine contents had no variation in the roasting process, its proportions would remain in roasted coffee, making them attractive for segmenting commercial coffees with beans that have been produced at various roasting degrees. On the other hand, dimension 3 was closely related to the roasting process, so it separated into more and less roasted coffees, regardless of their origin. Since both mineral and organic compounds are hydrosoluble, the correlations between them in roasted beans are reflected in the coffee brew.
CONCLUSIONS The principal component analysis allows for traditional coffee segmentation from extra strong ones, taking into account the mineral and organic compounds evaluated. The thermostable compounds (minerals and caffeine) are more attractive for roasted and ground coffee correlations.
ACKNOWLEDGMENTS This study was financed in part by the Conselho Nacional de Desenvolvimento Científico e Tecnológico (CNPq), Coordenação de Aperfeiçoamento de Pessoal de Nível Superior - Brasil (CAPES) - Finance Code 001, and Fundação Araucária.
REFERENCES 1. https://www.conab.gov.br/info-agro/safras, accessed September 2020. 2. http://abic.com.br/estatisticas/indicadores-da-industria/indicadores-da-industria-de-cafe-2017/, acessed September 2020. 3. http://abic.com.br/src/uploads/2017/07/2.8.1-Norma-de-qualidade-PQC.pdf, accessed September 2020. 4. Martinez, H. E. P.; Clemente, J. M.; Lacerda, J. S.; Neves, Y. P.; Pedrosa, A. W.; Rev. Ceres 2014, 61, 838. 5. Martinez, H. E. P.; Lacerda, J. S.; Clemente, J. M.; Silva Filho, J. B.; Pedrosa, A. W.; Santos, R. H. S.; Cecon, P. R.; Pesqui. Agropecu. Bras. 2018, 53, 443. 6. Clemente, J. M.; Martinez, H. E. P.; Alves, L. C.; Finger, F. L.; Cecon, P. R.; Acta Sci. Agron 2015, 37, 297. 7. Lacerda, J. S.; Doctorate Thesis, Universidade Federal de Viçosa, Brazil, 2014. 8. Jeszka-Skowron, M.; Stanisz, E.; Peña, M. P.; LWT - Food Sci. Technol 2016, 73, 243. 9. Mohammed, F.; Guillaume, D.; Dowman, S.; Abdulwali, N.; Microchem. J 2019, 145, 173. 10. Morgano, M. A.; Pauluci, L. F.; Mantovani, M. D.; Mory, E. E. M.; Ciênc. Tecnol. Aliment. 2002, 22, 19. 11. Şemen, S.; Mercan, S.; Yayla, M.; Açıkkol, M.; Food Chem. 2017, 215, 92. 12. Cruz, R.; Morais, S.; Casal, S; In Processing and Impact on Active Components in Food; Preedy, V. R., ed., Academic Press: Cambridge, 2014, chapter 66. 13. Bitter, N. Q.; Fernandez, D. P.; Driscoll, A. W.; Howa, J. D.; Ehleringer, J. R.; Food Chem 2020, 126602. 14. Hu, G. L.; Wang, X.; Zhang, L.; Qiu, M. H.; Food Funct 2019, 10, 3113. 15. Wang, X.; Lim, L.-T. In Coffee in Health and Disease Prevention; Preedy, V. R., ed.; Elsevier: Amsterdam, 2015, chapter 27. 16. Ding, M.; Satija, A.; Bhupathiraju, S. N.; Hu, Y.; Sun, Q.; Han, J.; Lopez-Garcia, E.; Willett, W.; van Dam, R. M.; Hu, F. B.; Circulation 2015, 132, 2305. 17. Vignoli, J. A.; Viegas, M. C.; Bassoli, D. G.; Benassi, M. T.; Food Res. Int 2014, 61, 279. 18. Dias, R.; Benassi, M.; Beverages 2015, 1, 127. 19. Amorim Filho, V. R.; Polito, W. L.; Gomes Neto, J. A.; Braz. Chem. Soc 2007, 18, 47. 20. Anderson, K. A.; Smith, B. W.; J. Agric. Food Chem 2002, 50, 2068. 21. Martín, M. J.; Pablos, F.; González, A. G.; Food Chem 1999, 66, 365. 22. Grembecka, M.; Malinowska, E.; Szefer, P.; Sci. Total Environ. 2007, 383, 59. 23. Souza, R. M. N.; Canuto, G. A.; Dias, R. C. E.; Benassi, M. T.; Quim. Nova 2010, 33, 885. 24. Perrone, D.; Farah, A.; Donangelo, C. M.; Paulis, T.; Martin, P. R.; Food Chem 2008, 106, 859. 25. Monteiro, M. C.; Trugo, L.;Quim. Nova 2005, 28, 637. 26. Stelmach, E.; Pohl, P.; Szymczycha-Madeja, A.; Food Chem 2015, 182, 302. 27. Bicho, N. C.; Leitão, A. E.; Ramalho, J. C.; Lindon, F. C.; Ciênc. Tecnol. Aliment. 2012, 32, 436. 28. Kalschne, D. L.; Viegas, M. C.; Conti, A. J.; Corso, M. P.; Benassi, M. T.; LWT - Food Sci. Technol2019, 99, 364. 29. Tagliazucchi, D.; Verzelloni, E.; Conte, A.; J. Agric. Food Chem 2010, 58, 2513. 30. Bonnländer, B.; Eggers, R.; Engelhardt, U. H.; Maier, H. In Espresso coffee the science of quality; Illy, A; Viani, R., eds.; Elsevier: Amsterdam, 2019, chapter 4. 31. Rosa, J. S.; Freitas-Silva, O.; Godoy, R. L. O.; Rezende, C. M. In Food Processing Technologies; Jaiswal, A. K., ed., CRC Press: Boca Raton, 2016, chapter 4. 32. Debastiani, R.; Santos, C. E. I.; Ramos, M. M.; Souza, V. S.; Amaral, L.; Yoneama, M. L.; Dias, J. F.; Food Res. Int 2019, 119, 297. 33. Cloete, K. J.; Smit, Z.; Minnis-Ndimba, R.; Vavpetič, P.; Plessis, A.; Roux, S. G.; Pelicon, P.; Food Chem. X 2019, 2, 100032. 34. Ribeiro, V. S.; Leitão, A. E.; Ramalho, J. C.; Lidon, F. C.; Food Res. Int 2014, 61, 39. 35. Casal, S.; Oliveira, M. B.; Ferreira, M. A.; Food Chem 2000, 68, 481. 36. Kalschne, D. L.; Biasuz, T.; Conti, A. J.; Viegas, M. C.; Corso, M. P.; Benassi, M. T.; Food Res. Int 2019, 124, 234. 37. Stefanello, N.; Spanevello, R. M.; Passamonti, S.; Porciúncula, L.; Bonan, C. D.; Olabiyi, A. A.; Rocha, J. B. T.; Assmann, C. E.; Morsch, V. M.; Schetinger, M. R. C.; Food Chem. Toxicol 2019, 123, 298. 38. Almeida, M. B.; Benassi, M. T.; Semina: Ciências Agrárias 2011, 32, 1893. 39. Waldhauser, S. S. M.; Baumann, T. W.; Phytochemistry 1996,42, 985. 40. Suzuki, T.; Takahashi, E.; Biochem. J 1975, 146, 87. 41. Perrone, D.; Farah, A.; Donangelo, C. M.; J. Agric. Food Chem 2012, 60, 4265. |
On-line version ISSN 1678-7064 Printed version ISSN 0100-4042
Qu�mica Nova
Publica��es da Sociedade Brasileira de Qu�mica
Caixa Postal: 26037
05513-970 S�o Paulo - SP
Tel/Fax: +55.11.3032.2299/+55.11.3814.3602
Free access


