Artigo
| Determination of chemical profile of Eugenia dysenterica ice cream using ps-ms and hs-spme/ gc-ms |
|
Mauro R. Silvaa, Lucas G. Freitasª; Henrique de O. P. Mendonçab; Amauri G. Souzab; Hebert V. Pereirac; Rodinei Augustic; Inayara C. A. Lacerdaa; Júlio O. F. Melob;* Raquel L. B. Araújoa
ªDepartamento de Alimentos, Universidade Federal de Minas Gerais, 31270-901 Belo Horizonte - MG, Brasil Recebido em 05/06/2020 *e-mail: onesiomelo@gmail.com The incorporation of Cerrado fruits in food products such as ice cream has many advantages because it represents a source of nutrients and bioactive compounds. Given the demand for less laborious methods to analyze food, the paper spray ionization mass spectrometry technique was applied for the first time for a rapid characterization of the chemical components found cagaita ice cream. PS-MS in positive and negative ionization modes were used. The profile of volatile compounds was determined by headspace solid-phase microextraction combined with gas chromatography-mass spectrometry. Fingerprints obtained through PS-MS identified various classes of compounds, such as flavones, anthocyanins, sugars, organic acids, hydroxybenzoic acids, fatty acids, hydroxycinnamic acids, lignin, and phenylpropanoid. The use of both fibers enabled the extraction and identification of 18 volatile compounds in cagaita, and 16 of them were also identified in cagaita ice cream. The most common volatile compound found in both cagaita and ice cream was 3-carene monoterpene. Considering the effect of processing on cagaita constituents, 89% of the volatile compounds remained in the ice cream. Also, 78% of the fruit chemical compounds analyzed by PS-MS were found in the product. Thus, the results indicate that most of the fruit compounds remained in the ice cream after processing. INTRODUCTION The Cerrado, the richest savanna on earth, encompasses 22% of the Brazilian territory and is home to approximately 11,627 native plant species. Among the edible fruits found in this biome, cagaiteira trees (Eugenia dysenterica) produce fruit with low caloric value and high moisture content that are an excellent source of vitamin C containing several phenolic compounds.1 Cagaitas are consumed fresh or used to make jellies, jams, liqueurs, and juices.2 However, despite their social importance to inhabitants who obtain income from this natural resource, many species are at risk of extinction due to deforestation caused by the expansion of various agriculture and livestock sectors.3 Development of food products is a way to add value to the Cerrado fruits. According to ABIS (Brazilian Association of Industries and the Ice Cream Industry), Brazil is among the ten largest producers of ice cream in the world. In the period from 2003 to 2016, Brazilian production increased from 686 million to 1 billion liters of ice cream.4 Ice cream is made of milk, sugars, stabilizers, emulsifiers, flavors, among others. These ingredients provide a stable emulsion when this mixture is subjected to agitation, freezing, and incorporation of air.5-11 The literature describes many techniques for chemical analysis of ice cream, such as spectrophotometric assay,8,12 high-performance liquid chromatography (HPLC),7,13 gas chromatography-mass spectrometry (GC-MS),14 liquid chromatography coupled to mass spectrometry (LC-MS).15 However, some of these techniques require longer analysis time with multiple sample preparation steps and generate chemical waste. Several techniques of ambient ionization mass spectrometry have overcome these disadvantages, allowing fingerprints to be obtained through ultrafast analysis and with minimal sample preparation. Among them, paper spray ionization mass spectrometry (PS-MS) has been employed to analyze various food matrices, such as corni fructus,16 cagaita,2 colorings,17 red wine,18 olive oils19 as well as coffee,20 alcoholic beverages,21,22 and teas.23 The PS-MS ionization technique consists of applying a potential difference to a chromatographic paper containing the sample, which allows obtaining spectrum in large mass ranges. For this reason, it is a simple, fast and low-cost technique with high sensitivity, selectivity and minimal requirement for sample preparation. This work aimed to characterize the chemical constituents of cagaita ice cream through paper spray ionization mass spectrometry and volatile compounds using headspace solid phase microextraction combined with gas chromatography coupled to mass spectrometry.
EXPERIMENTAL Material Solid phase microextraction fibers Polyacrylate (PA, 85 μm) and Polydimethylsiloxane/Divinylbenzene (PDMS/DVB, 65 μm) and Folin-Ciocalteu reagent were purchased from Sigma Aldrich (São Paulo, SP, Brazil). Chromatography paper 1 CHR was from Whatman (Little Chalfont, Buckinghamshire, UK) and HPLC grade methanol was supplied by J. T. Baker (Phillipsburg, NJ, USA). The other reagents were analytical grade. Methods Sample preparation and ice cream processing Ripe cagaita fruits were collected in the municipality of Sete Lagoas, MG (Latitude 19° 28' 35.8'' e Longitude 44° 11' 42.4") in December 2018. The cagaitas were transported to the Chemistry and Analytical Research Laboratory of the Universidade Federal de Minas Gerais. The fruits were washed in running water, sanitized for 15 min using sodium hypochlorite (200 mg L-1), rinsed in running water, and stored in a freezer at -20 °C. The pulps were produced from thawed fruit. The peels and seeds were removed, and the pulp homogenized in a mixer. The production of cagaita ice cream was performed as described by Goff and Hartel24 with modifications. The formulation consisted of the following ingredients: cagaita pulp (40%), nonfat powdered milk (13.62%), sugar (5%), inulin (4.92%), maltitol (3.59%), sorbitol (3.15%), palm kernel oil (2.36%), glucose (0.61%), and emulsifier (0.4%). All ingredients were weighed and then mixed in a household blender (Fischer, Cook Line Turbo, São Paulo, Brazil). Next, the mix was pasteurized at 70 °C for 30 min and cooled to 4 °C. Subsequently, the mixture was placed in a domestic freezer and kept under constant agitation to incorporate air during freezing. Finally, the ice cream was packed in polypropylene jars and stored in a freezer at -20 °C. Sample Extraction Cagaita (n=3) and ice cream (n=3) samples were extracted in triplicate according to the method of Rufino et al.25 In a 2 mL Eppendorf tube, 0.5 g of sample and 1 mL of methanol/water (50:50, v/v) were added. After incubation at room temperature for 1 h, the tubes were centrifuged at 25,406 × g for 15 min and supernatants were collected. Subsequently, 1 mL of acetone/water (70:30, v/v) was added to the tubes and a new incubation and centrifugation step was performed in the same conditions. The two supernatants obtained after the centrifugation steps were placed in a 5 mL volumetric flask and the volume completed with distilled water. The extracts were used to analyze total phenolic compounds and chemical constituents. Total phenolic compounds Total phenolic compounds were found using the method proposed by Singleton et al.26 For this, a 150 μL volume of the sample extract, 3,850 mL distilled water and 250 μL Folin-Ciocalteu were mixed in 15.0 mL falcon tube coated with aluminum foil and incubated at room temperature for 8 min. After, 750 μl of 20% sodium carbonate was added. After 2 h incubation, the samples were read at 765 nm (Spectrophotometer Analytik Jena, model Spekol 1300, CA, USA) and the data expressed as mg of gallic acid equivalent (GAE) 100 g-1 sample. Chemical Profile of the Cagaita and Cagaita Ice Cream by paper spray ionization mass spectrometry (PS-MS) The chemical constituents of the samples were identified as described in Silva et al.2 by using an LCQ Fleet ion trap mass spectrometer (Thermo Scientific, San Jose, CA, USA) with paper spray ionization (Figure 1). For this, the following experimental conditions were employed: mass range: 100 to 1000 m/z; PS-MS voltage: + 5.0 kV (positive ionization mode) and -3.0 kV (negative ionization mode); and capillary voltage of 40 V; tube lens voltage: 120 V.
 Figure 1. Illustration of ionization source for paper spray
Aliquots with 2 μL of the sample extracts were placed on the tip of a triangular-shaped chromatographic paper (1.5 cm dimensions) positioned 0.5 cm from the mass spectrometer inlet using a clamp attached to an XYZ platform. This clamp was connected to a high voltage source of the spectrometer by a copper wire. Subsequently, 40 μL of HPLC grade methanol was applied to the base of the triangular paper and the voltage source was switched on to obtain the mass spectra. Extraction and identification of volatile compounds Headspace solid phase microextraction (HS-SPME) and volatile compound identification were performed as described by Silva et al.27 For this, 0.5 g of the samples (cagaita and ice cream) were transferred to 20 mL vials, which were closed and placed inside aluminum blocks (8.5 × 10 cm). After a 5 min preheating step, the fibers (Polyacrylate (PA) or Polydimethylsiloxane/Divinybenzene (PDMS/DVB)) were inserted into these vials and kept at 60 °C for 10 min and then taken to the GC-MS injector, remaining in that equipment for 5 min at 200 ºC. A gas chromatograph (Trace GC Ultra) equipped with a Polaris Q mass spectrometer from Thermo Scientific (San Jose, CA, USA) with an ion-trap analyzer equipped with a split/splitless injector was used in splitless mode. Helium gas (1 mL min-1 flow) and an HP-5 MS capillary column; 30 m × 0.25 mm × 0.25 μm (Agilent Techonolgies INC, Munich, Germany) were used. Oven temperatures were: 40 °C (1 min), subsequent heating to 110 °C (10 °C min-1), then to 180 °C (15 °C min-1). The conditions used in the mass spectrometer were: 35 to 300 m/z mass range, 70 eV electron ionization mode, 275 °C transfer line temperature, and 200 °C ion source temperature. Compounds were tentatively identified by comparing the data obtained with the mass spectra of the Nist Library (National Institute of Standards and Technology Research Library). The identification was also based in article that determined the volatile compounds of cagaitas. 27 Statistic All experiments were performed in triplicate. The results of the total phenolic compounds content were evaluated by one-way ANOVA and Tukey test (p < 0.05) used to evaluate the means. Chromatograms containing the volatile compounds were analyzed using the programs Xcalibur version 1.4 (Thermo Scientific, San Jose, CA, USA)28 and Excel version 2013 (Microsoft, Redmond, WA, USA).29 Mass spectra were evaluated using Xcalibur version 2.1 software (Thermo Scientific, San Jose, CA, USA).30 The Principal Component Analysis (PCA) model was built with data centered mean using MatLab version 7.9.0.529 software (Mathworks, Natick, MA, USA)31 with the aid of PLS Toolbox version 5.2.2 (Eigenvectors Research, Manson, WA, USA).32
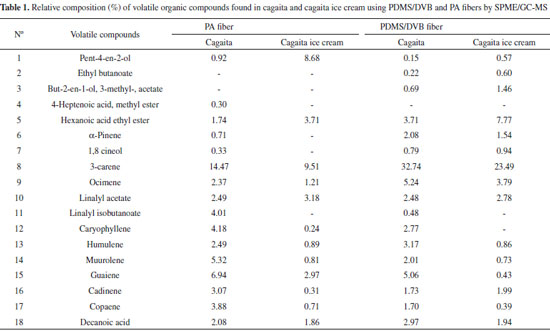
RESULTS AND DISCUSSION Volatile compounds profile Table 1 shows the volatile compounds identified in samples of cagaita pulp and cagaita ice cream. Eighteen volatile compounds were identified in cagaita, including 16 using PA fibers and 17 using PDMS/DVB fiber. Of these, 16 compounds were also found in cagaita ice cream (PA: n=12; PDMS/DVB: n=15). It's important to note that the abundance is based on the relative response of the MS scanned in the mass range from 35 to 300 and also due the selectivity of each fiber to the disctinct analytes. The 3-carene monoterpene was the most abundant in cagaita (PA = 14.47%, PDMS/DVB=32.74%) and cagaita ice cream (PA = 9.51%, PDMS/DVB = 23.49%). The higher percentage of 3-carene found using the PDMS/DVB is problably due to the semi-polar characteristic of this fiber, which promoted a higher adsorption of this monoterpene in relation to the PA polar fiber. The use of fiber PA promoted an increase of 8.68% in the extraction of the compound Pent-4-en-2-ol in ice cream. This may be relateld to some effect by the ice cream mixture that provided a higher fiber adsorption. This can occur since the extraction of VOCs by HS-SPME is a physical-chemical equilibrium process, which depends, among other factors, on the type of fiber.2 Table 1 shows that most of the compounds identified in cagaita were also found in cagaita ice cream, thus the manufacturing process did not cause large losses of these volatile organic compounds in the product. The relative area of volatile compounds in ice cream generally decreased compared to cagaita pulp, which was expected because the manufacturing processing involves several steps such as homogenization of ingredients in a blender, agitation, and freezing. No articles were found in the literature that determined volatile compounds in fruit ice cream or evaluated the effect of processing on these volatile organic compounds. The relative area of the chemical classes of volatile compounds found in the samples evaluated as a function of the fibers used are in Figure 2.
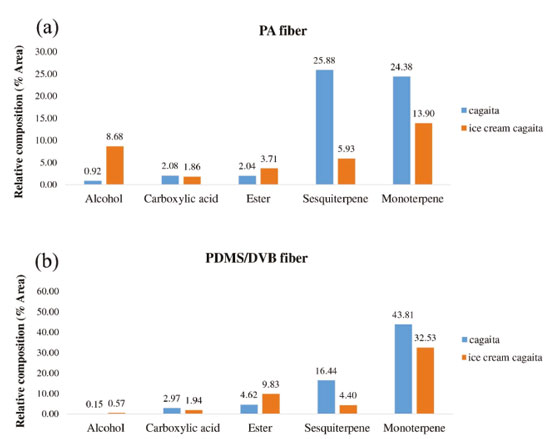 Figure 2. Comparison of effectiveness of SPME fibers. Relative area (%) of chemical classes of volatile compounds identified in cagaita and cagaita ice cream using (a) PA and (b) PDMS/DVB fibers by SPME/GC-MS
The cagaita pulp is predominantly composed of terpenes. These results are in agreement with the work done by Silva et al.27 with cagaitas collected in the 2016 harvest in the municipality of Sete Lagoas, MG, which also observed a high proportion of monoterpenes (34.64%). The profile of volatile fruit compounds is known to be related to factors such as degree of ripeness, climate, and pre- and post-harvest handling.33,34 No studies were found in the literature that evaluate changes in the relative composition of chemical classes of volatile compounds ice cream and other cold deserts. The average results of the content of total phenolic compounds of cagaita and cagaita ice cream were 241.26 + 4.27 mg GAE 100 g-1 and 79.97 + 1.44 mg GAE 100 g-1, respectively. The content of total phenolic compounds found in cagaita in the present study are in agreement with those reported in the literature, which ranged from 171.76 to 367.67 mg 100 g-1 .2,35 The total phenolic content of the produced ice cream is also within the range described in the literature for ice creams made with various types of fruits as reported in the works of Vital et al.7 (46 to 117 mg GAE 100 g-1), Goraya and Bajwa36 (81 to 257 mg GAE 100 g-1), and Öztürk et al.6 (7.5 to 65 mg GAE 100 g-1). The cagaita ice cream was produced with 40% pulp and the analysis found that this product had 30% of total phenolic compounds in relation to the cagaita pulp; thus, only 10% of these compounds were lost during the process, which was lower than other studies. In previous works, Goraya and Bajwa36 evaluated the influence of the added alma (Indian gooseberry) pulp on the functional properties of ice cream. With the total phenolic values found in alma pulp (1.48 g 100 g-1 GAE) and in ice creams produced with 20% pulp (0.257 g 100 g-1 GAE), they observed a reduction of 13.18% in relation to the expected theoretical value (0.296 g 100 g-1 GAE). In other study, Vital et al.7 when incorporating grape juice residue (2.5 to 10%) into ice cream, obtained losses of 38.36 to 54.20%. Paper spray ionization mass spectrometry (PS-MS) fingerprints Figure 3 shows the mass spectrum (positive and negative ionization modes) of cagaita ice cream as well as the fragmentation spectra of some characteristic ions.
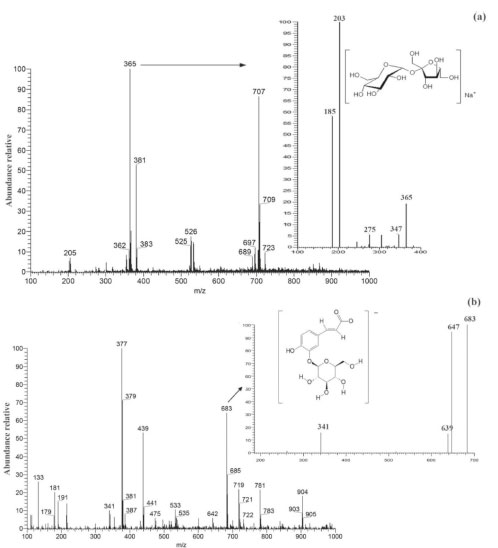 Figure 3. Representation of (a) sucrose (m/z 365) in PS(+)-MS and (b) caffeic acid hexoside dimer (m/z 683) in PS(-)-MS of cagaita ice cream sample
The PS(+)-MS identified 5 compounds of the flavone, anthocyanins, and sugars classes as in the form of sodium and potassium adducts (Table 2), which were also reported by Silva et al.2 when employing PS-MS in cagaita collected in the city of Sete Lagoas, MG, Brazil.
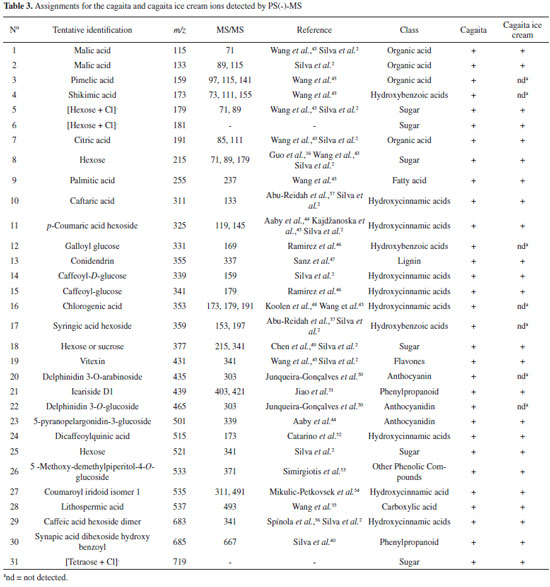
Chrysoeriol (n = 1; 20% of the compounds) was the only compound found in cagaita that was not detected in the cagaita ice cream. Thus, 80% (n = 3) of the substances identified in the fruit remained in the product after manufacturing. According to the ions identified using PS(-)-MS technique, a classification has been proposed as described in Table 3. The 31 compounds found included organic acids, hydroxybenzoic acids, sugars, hydroxycinnamic acids, flavone, anthocyanins, and carboxylic acids. Among them, 13 (Compounds 1, 2, 5, 7, 8, 9, 10, 12, 15, 16, 17, 22, and 26) were also described by Silva et al.,2 when evaluating the chemical profile of cagaitas in different microregion using the PCA and PS(-)-MS. The observed differentiation occurred due to 15 compounds.
For the compounds identified in PS(-)-MS, the processing resulted in a 22.60% loss (n = 7; pimelic acid, shikimic acid, galloyl glucose, chlorogenic acid, syringic acid hexoside, delphinidin 3-O-arabinoside, and delphinidin 3-O-glucoside). About 23 compounds identified in the cagaita remained in the ice cream, which corresponded to a similarity of 77.8%. This loss of only 22.22% (n = 8) may be related to the steps of homogenizing the cagaita pulp with other ice cream ingredients as well as agitating and freezing in the ice cream maker during manufacturing. No articles were found that evaluated changes in the profile of chemical constituents (organic acids, phenolic compounds, and other secondary metabolites) of fruits during ice cream manufacturing. Principal Component Analysis (PCA) Effect of processing on the chemical profile of samples The resulting PCA model was able to explain 93.20% [PS(+)-MS] and 93.80% [PS(-)-MS] of total data variability. Figures 4 and 5 exhibit the PCA that demonstrate the effect of ice cream processing on the chemical profile of the cagaita pulp used. Using the mass spectra obtained from the sample analyzed by the positive and negative ionization modes, the PCA was built with the data mean centered with two main components.
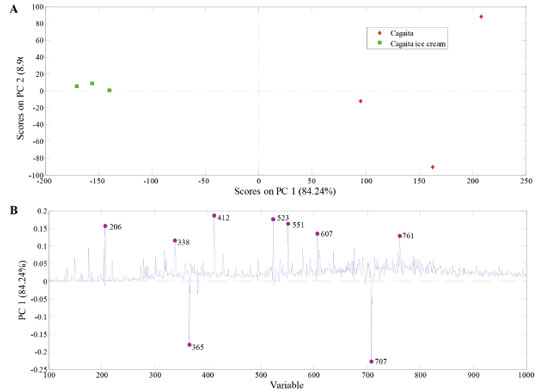 Figure 4. PCA model built with PS(+)-MS data from cagaita pulp and cagaita ice cream samples. The upper plot (scores) split the two sets of samples into well-distinguished groups. The bottom plot (loadings) shows the main ions that account for this separation
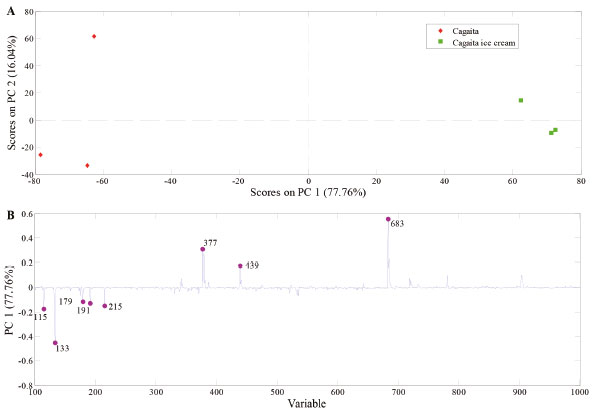 Figure 5. PCA model built with PS(-)-MS data from cagaita pulp and cagaita ice cream samples. The upper plot (scores) split the two sets of samples into well-distinguished groups. The bottom plot (loadings) shows the main ions that account for this separation
PC 1 in the positive ionization mode (Figure 4a) recognized differences between the fruit (positive scores) and the cagaita ice cream (negative scores). Analysis of the weights of this component (Figure 4b) found that this differentiation of ice cream occurred due to the signals with m/z 365 and 707 related to sugars, while the cagaita differed as a function of the signals with m/z 206, 412, 523, and 551. In the PCA, generated from the spectra obtained by PS(-)-MS presented in Figure 5, the composition of the cagaita ice cream (positive scores) differed from the cagaita pulp due to the ions with m/z 377 (sugar), 439 (icariside D1), and 683 (caffeic acid hexoside dimer), while the pulp showed more intense signs with m/z 115 (malic acid), 179 ([Hexose + Cl]-), 191 (citric acid), and 215 (hexose). No other articles were found that evaluated changes in the profile of compounds (organic acids, phenolic compounds, and other secondary metabolites) of fruits during ice cream manufacturing.
CONCLUSIONS The SPME PA and PDMS/DVB fibers efficiently revealed the volatile compounds present in cagaita and cagaita ice cream. Most of the volatile compounds (89%) present in cagaita pulp were also found in ice cream. After processing the ice cream, a reduction of 10% in the content of total phenolic compounds was observed concerning cagaita pulp. Fingerprints obtained from the evaluated samples found 36 compounds, 28 of which were also present in the ice cream produced. Thus, PS-MS proved to be a simple and fast technique to determine the chemical profile of these food matrices by identifying the bioactive compounds of different chemical classes.
SUPPLEMENTARY MATERIAL The figures contain the mass spectra of compounds identified in the cagaita ice cream by PS-MS, which are freely accessible at http://quimicanova.sbq.org.br.
ACKNOWLEDGEMENTS The authors thank the FAPEMIG and CAPES for their financial support.
REFERENCES 1. Cardoso, L. M.; Martino, H. S. D.; Moreira, A. V. B.; Ribeiro, S. M. R.; Pinheiro-Sant'ana, H. M.; Food Res. Int. 2011, 44, 2151. 2. Silva, M. R.; Freitas, L. G.; Souza, A. G.; Araújo, R. L. B.; Lacerda, I. C. A.; Pereira, H. V.; Augusti, R.; Melo, J. O. F.; J. Braz. Chem. Soc. 2019a, 30, 1034. 3. http://www.mma.gov.br/biomas/cerrado, accessed in November 2020. 4. http://www.abis.com.br/estatistica_producaoeconsumodesorvetesnobrasil.html, accessed in November 2020. 5. Homayouni, A.; Javadi, M.; Ansari, F.; Pourjafar, H.; Jafarzadeh, M.; Barzegar, A.; Food Anal. Methods 2018, 11, 3224. 6. Öztürk, H. İ.; Demirci, T.; Akin, N.; LWT - Food Sci. Technol. 2018, 90, 339. 7. Vital, A. C. P.; Santos, N. W.; Matumoto-Pintro, P. T.; Scapim, M. R. S.; Madrona, G. S.; Int. J. Dairy Technol. 2018, 71, 183. 8. Yüksel, A. K.; J. Food Qual. 2015, 38, 413. 9. Yüksel, A. K.; Yüksel, M.; J. Food Saf. 2015, 35, 385. 10. Yüksel, A. K.; Şat, I. G.; Yüksel, M.; J. Food Sci. Technol. 2015, 52, 8023. 11. Kavaz, A.; Yuksel, M.; Dagdemir, E.; Int. J. Dairy Technol. 2016, 69, 418. 12. Ullah, R.; Nadeem, M.; Ayaz, M.; Tayyab, M.; Imran, M.; Sajid, R.; Food Sci. Biotechnol. 2015, 24, 1227. 13. Sun-Waterhouse, D.; Edmonds, L.; Wadhwa, S. S.; Wibisono, R.; Food Res. Int. 2013, 50, 647. 14. Balthazar, C. F.; Silva, H. L. A.; Esmerino, E. A.; Rocha, R. S.; Moraes, J.; Carmo, M. A. V.; Azevedo, L.; Camps, I.; Abud, Y. K. D.; Sant'Anna, C.; Franco, R. M.; Freitas, M. Q.; Silva, M. C.; Raices, R. S. L.; Escher, G. B.; Granato, D.; Ranadheera, C. S.; Nazarro, F.; Cruz, A. G.; Food Chem. 2018, 246, 464. 15. Nagy, K.; Redeuil, K.; Bertholet, R.; Steiling, H.; Kussmann, M.; Anal. Chem. 2009, 81, 6347. 16. Guo, Y.; Gu, Z.; Liu, X.; Liu, J.; Ma, M.; Chen, B.; Wang, L.; Phytochem. Anal. 2017, 28, 344. 17. Taverna, D.; Donna, L. D.; Mazzotti, F.; Policicchio, B.; Sindona, G.; J. Mass Spectrom. 2013, 48, 544. 18. Donna, L. D.; Taverna, D.; Indelicato, S.; Napoli, A.; Sindona, G.; Mazzotti, F.; Food Chem. 2017, 229, 354. 19. Mazzotti, F.; Donna, L. D.; Taverna, D.; Nardi, M.; Aiello, D.; Napoli, A.; Sindona, G.; Int. J. Mass Spectrom. 2013, 352, 87. 20. Garrett, R.; Rezende, C. M.; Ifa, D. R.; Anal. Methods 2013, 5, 5944. 21. Pereira, H. V.; Amador, V. S.; Sena, M. M.; Augusti, R.; Piccin, E.; Anal. Chim. Acta 2016, 940, 104. 22. Teodoro, J. A. R.; Pereira, H. V.; Sena, M. M.; Piccin, E.; Zacca, J. J.; Augusti, R.; Food Chem. 2017, 237, 1058. 23. Deng, J.; Yang, Y.; Anal. Chim. Acta 2013, 785, 82. 24. Goff, H. D.; Hartel, R. W.; Ice cream, 7th ed., New York: Springer, 2013. 25. Rufino, M. S. M.; Alves, R. E.; Brito, E. S.; Pérez-Jiménez, J.; Saura- Calixto, F.; Mancini-Filho, J.; Food Chem. 2010, 121, 996. 26. Singleton, V. L.; Orthofer, R.; Lamuela-Raventós, R. M.; Methods Enzymol. 1999, 299, 152. 27. Silva, M. R.; Bueno, G. H.; Araújo, R. L. B.; Lacerda, I. C. A.; Freitas, L. G.; Morais, H. A.; Augusti, R.; Melo, J. O. F.; J. Braz. Chem. Soc. 2019b, 30, 79. 28. Xcalibur, version 1.4. (2011). Thermo Scientific: San Jose, CA, USA. 29. Excel 2013. (2013). Microsoft: Redmond, WA, EUA. 30. Xcalibur, version 2.1. (2011). Thermo Scientific: San Jose, CA, USA. 31. MatLab, version 7.10.0.499. (2009). Mathworks: Natick, MA, USA. 32. PLS Toolbox, version 5.2.2. (2009). Eigenvectors Research: Manson, WA, USA. 33. Hui, Y. H.; Handbook of fruit and vegetable flavors, 1st ed., John Wiley & Sons: New Jersey, 2010. 34. Bicas, J. L.; Molina, G.; Dionísio, A. P.; Barros, F. F. C.; Wagner, R.; Maróstica, M. R.; Pastore, G. M.; Food Res. Int. 2011, 44, 1843. 35. Santos, M. N. G., Silva, E. P., Godoy, H. T., Silva, F. A., Celestino, S. M. C., & Pineli, L. L. O., Damiani, C.; Food Sci. Technol. 2018, 38, 600. 36. Goraya, R. K.; Bajwa, U.; J. Food Sci. Technol. 2015, 52, 7861. 37. Abu-Reidah, I. M.; Ali-Shtayeh, M. S.; Jamous, R. M.; Arráez-Román, D.; Segura-Carretero, A.; Food Chem. 2015, 166, 179. 38. Yuan, H.; Wu, Y.; Liu, W.; Liu, Y.; Gao, X.; Lin, J.; Zhao, Y.; Carbohydr. Res. 2015, 407, 5. 39. Asakawa, D.; Hiraoka, K.; Rapid Commun. Mass Spectrom. 2010, 24, 2431. 40. Silva, N. A.; Rodrigues, E.; Mercadante, A. Z.; Rosso, V. V.; J. Agric. Food Chem. 2014, 62, 5072. 41. Oliveira, P. S.; Chaves, V. C.; Bona, N. P.; Soares, M. S. P.; Cardoso, J. S.; Vasconcellos, F. A.; Tavares, R. G.; Vizzotto, M.; Silva, L. M. C. D.; Grecco, F. B.; Gamaro, G. D.; Spaneello, R. M.; Lencina, C. L.; Reginatto, F. H.; Stefanello, F. M.; Biomed. Pharmacother. 2017, 92, 935. 42. Furlan, C. M.; Santos, D. Y. A. C.; Motta, L. B.; Domingos, M.; Salatino, A.; Pollut. Res. 2010, 1, 30. 43. Wang, J.; Jia, Z.; Zhang, Z.; Wang, Y.; Liu, X.; Wang, L.; Lin, R.; Molecules 2017, 22, 476. 44. Aaby, K.; Ekeberg, D.; Skrede, G.; J. Agric. Food Chem. 2007, 55, 4395. 45. Kajdzanoska, M.; Gjamovski, V.; Stefova, M.; J. Chem. Chem. Eng. 2010, 29, 181. 46. Ramirez, J. E.; Zambrano, R.; Sepúlveda, B.; Simirgiotis, M. J.; Molecules 2013, 19, 438. 47. Sanz, M.; Simón, B. F.; Cadahía, E.; Esteruelas, E.; Muñoz, A. M.; Hernández, T.; Estrella, I.; Pinto, E.; J. Mass. Spectrom. 2012, 47, 905. 48. Koolen, H. H. F.; Silva, F. M. A.; Gozzo, F. C.; Souza, A. Q. L.; Souza, A. D. L.; Food Res. Int. 2013, 51, 467. 49. Chen, R.; Wang, L.; Xiong, C.; Zhou, Y.; Zhen, C.; Zhang, N.; Tang, Y.; Zhou, X.; Wang, J.; Nie, Z.; Chen, Y.; Analyst 2011, 136, 3809. 50. Junqueira-Gonçalves, M. P.; Yáñez, L.; Morales, C.; Navarro, M.; Contreras, R. A.; Zúñiga, G. E.; Molecules 2015, 20, 5698. 51. Jiao, Q. S.; Xu, L. L.; Zhang, J. Y.; Wang, Z. J.; Jiang, Y. Y.; Liu, B.; Molecules 2018, 23, 274. 52. Catarino, M. D.; Silva, A. M. S.; Saraiva, S. C.; Sobral, A. J. F. N.; Cardoso, S. M.; Arabian J. Chem. 2018, 11, 62. 53. Simirgiotis, M. J.; Schmeda-Hirschmann, G.; Bórquez, J.; Kennelly, E. J.; Molecules 2013, 18, 1672. 54. Mikulic-Petkovsek, M.; Schmitzer, V.; Slatnar, A.; Stampar, F.; Veberic, R.; J. Sci. Food Agric. 2015, 95, 776. 55. Wang, S.; Liu, L.; Wang, L.; Hu, Y.; Zhang, W.; Liu, R.; Molecules 2012, 17, 10470. 56. Spínola, V.; Pinto, J.; Castilho, P. C.; Food Chem. 2015, 173, 14. |
On-line version ISSN 1678-7064 Printed version ISSN 0100-4042
Qu�mica Nova
Publica��es da Sociedade Brasileira de Qu�mica
Caixa Postal: 26037
05513-970 S�o Paulo - SP
Tel/Fax: +55.11.3032.2299/+55.11.3814.3602
Free access


