Artigo
| Study on the optimization for the size of fuel cell flow field under inadequate air supply condition |
|
Shi Lei; Zheng Minggang*
Shandong Jianzhu University, Jinan, Shandong, 250101, China Recebido em 16/07/2020 *e-mail: why1318@sdjzu.edu.cn In this paper, the influence of the optimization for flow field size on the proton exchange membrane fuel cell (PEMFC) performance under the inadequate air supply of cathode was studied based on the three-dimensional, steady-state, and constant temperature PEMFC monomer model. Additionally, the effect of the optimization for hybrid factors, including length, width, depth and width-depth, on the PEMFC performance was also investigated. The results showed that the optimization of the flow field size can improve the performance of the PEMFC and ensure that it is close to the level under the normal gas supply. INTRODUCTION PEMFC is regarded as the ideal power source due to the development of the key technology and components, which can operate well in the suitable operation temperature (60-80 °C) and adequate fuel supply. However, the PEMFC can easily suffer from the adverse condition in some scenario such as cold start or subzero start, inadequate air supply.1 In this case, the optimization of flow field size is the good solution for the improvement of PEMFC performance under the adverse condition. Recently, the study related to the correlation of inlet flow rate and PEMFC performance is concentrate on the level of stack. For example, Wang et al.2 put forward noval design of a cathode flow-field with a sub-channel for PEMFC and found that the sub-channel inlet position and flow rate have greatly influence on the cell performance. Pan et al.3 investigated the impact of the nonuniform reactant flow rate on the performance of the stack. Results showed that the nonuniform reactant flow rate will cause the accumulation of excess liquid water near the PEM that is near the cathode exhaust outlet, and the local area reacts strongly on the catalyst, whereas the local area reacts slowly. Moreover, in the level of the optimization for flow field, many researchers believed that the length of flow field present significant influence on the PEMFC performance. They thought that the huge pressure loss and the non-uniform gas distribution leads to the longer flow field and the occurrence of "flooding phenomenon", which decreases the performance and stability of PEMFC.4,5 Shimpalee et al.6 investigated the impact of channel path length on PEMFCs in 200 cm2 area by change the number of channels in the serpentine flow field (3-channel serpentine flow field, 6-channel flow field, 13-channel flow field, 26-channel flow field, 26-channel complex flow field). Their results showed the 13-channel gives the best performance for PEMFC. John et al.7 studied the effect of channel length on performance and water accumulation in a PEMFC parallel flow field and Santamaria et al.8 examined the effect of increased length of channel on the distribution of flow gases and performance of the interdigitated flow field PEMFC. They all suggested that the longer 25cm channels had significantly higher and more stable performance than the shorter 5 cm channels. Besides, Khazaee et al.9 explored the relation of PEMFC performance and the depth of flow field, and they thought that the depth of flow field played a key role in the ability of water removal. Wang et al.10 demonstrated that the depth of flow field is the most critical factor in the consumption rate of hydrogen, the width of flow field comes second, and the width of rib is the least influence. Many experiments and simulation results show that the smaller ridge width and the larger flow channel width can promote the mass transfer of reaction gas.11,12 Muthukumar et al.13 research the effects of different landing to flow field with the width of the flow field in mm of 0.5×0.5, 1×1, 1.5×1.5, 2×2 on PEMFCs by comparing the current density and power density, demonstrating that the 0.5×0.5 mm is the optimal width of the flow field. The influence of flow field geometry structure on the PEMFC performance was studied by Freire et al.,14 and they found that investigated the effect of operational parameters on the performance of PEMFCs by using serpentine flow field with different cross-section shape (rectangular and trapezoidal), finding that trapezoidal cross-section of flow field can remove the liquid water effectively and the rectangular cross-section of serpentine flow field will not affect the performance of PEMFC. Korkischko et al.15 reviewed the effect of the shape of flow field Cross-Sections on PEMFC performance and proposed the inverted trapezoidal cross-section is the optimized geometry because of the perfect power density and current density characteristics. In this paper, to provide a reliable basis for "self-improvement" of PEMFC performance, the influence of hybrid factors, including length, width, depth and width-depth, on the PEMFC performance were studied under the inadequate air supply condition, and the software COMSOL Multiphysics, as the multi-physics direct coupling analysis software, was used to simulate and calculate.
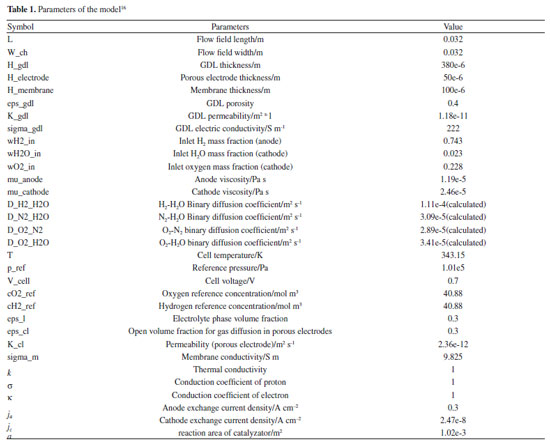
EXPERIMENTAL Models and parameters As a complicated system, the PEMFC contains a lot of process such as liquid fluid, gas diffusion, water transport and electrochemical reaction. Therefore, the mathematical models need to be established to describe the PEMFC operation process comprehensively and improve the accuracy of the simulation results. In this paper, three types of serpentine flow field PEMFC models, including 2-channel, 4-channel and 8-channel, are established in the area of 3.2 cm × 3.2 cm (just as Figure 1). The parameters of the models were listed in Table 1.
 Figure 1. The three models of PEMFC: (a) 2-channels serpentine flow field PEMFC; (b) 4-channels serpentine flow field PEMFC; (c) 8-channels serpentine flow field PEMFC
Additionally, to improve the computational accuracy, grid cells were created and connected by equalizing the node in each component, and built by the hexahedron mesh. Therefore, approximately 245743 computational units are involved in all geometries. Besides, the NUMPS algorithm was applied to complete the flow field solver through the algebraic multigrid method.
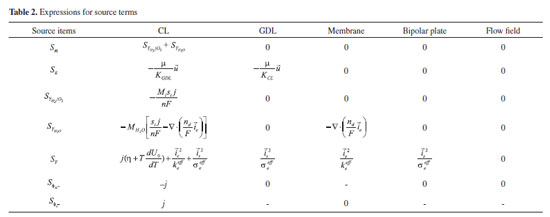
MODEL HYPOTHESIS AND MATHEMATICAL MODEL The following assumptions are used to simplify the PEMFC model: 1) The PEMFC is assumed to operate at a steady state; 2) The gas flow in the flow field is regarded as the laminar of ideal gas and the incompressible flow; In this paper, the reynolds number is based on the hydraulic diameter, just as formula (1)  where Q is flow rate(m3 s-1); D is hydraulic diameter (m); ν is kinematic viscosity (m2 s); D is got by formula (2)  where His height of cross section (m); Wis width of cross section (m) For this research, the maximum value of Q is 300 mL min (5e-6 m3 s-1); the H = W = 0.001 m; the kinematic viscosity of air is 1.48e-5 m2 s; The A is H*W = 1e-6 m2 Finally, the Re is 337.84 < 2000, so the hypothesis is established. 3) All gases cannot pass through the proton exchange membrane; 4) The gravity effect is neglected; 5) Both the gas diffusion layer (GDL) and catalyst layer (CL) are assumed to be homogeneous and isotropic; 6) The PEMFC model is applied in a serpentine flow field fuel cell; 7) PEMFC is operated in the temperature of 70 °C. According to the mass conservation equation, momentum conservation equation, component conservation equation, electrochemical equation, and diffusion equation of gas components in porous media, and the transport equation of liquid water, the PEMFC is suitable for these rules. The general formulas of the conservation equation are as follow:  where ρ is density (kg m-3); ψ is solving variables; t is time (s); The four terms in formula (3) from left to right are transient term, convection term, diffusion term and source term, respectively. The above conservation equation is converted by formula (3) and change the value of the ψ. When the value of ψ is 1, themass conservation equation is obtained in formula (4):  When the value of ψ is  where is When the value of ψ is Yi, the component conservation equation is received in formula (6):  where When the value of ψ is T, the energy conservation equation is finished in formula (7):  where k is thermal conductivity, When the value of ψ is  where σ and κ is the conduction coefficient of proton and electron, respectively. The source items at different area of PEMFC in formula (3) - (8) are as Table 2, where µ is viscosity coefficient (kg m-1 s-1), KGDL and KCL are permeability (m2 s) of GDL and CL, Mi and Si are chemical expressions and stoichiometric coefficients of components, n is the number of electron, F is Faraday constant (96485 C mol-1).
The expression for  ja and jc is obtained from formula (11) and (12).   where a is the reaction area of catalyzator, i0 is exchange current density (the subscript of a and c is represented anode and cathode ), C and Cref are molar concentration and reference molar concentration, α is the conversion rate of electrochemical reaction, h is activation potential. Modelling verification The Fuel cell testing system G20 is used to test the performance of PEMFC and the Fuel cell testing system is used to test the performance of PEMFC in this paper and the principle of testing system is shown in Figure 2. In this test, the Rh condition of O2, H2 is 100%, the specific experimental parameters are detailed in Table 3. Moreover, the size, reaction gas intake, experimental temperature, GDL porosity, catalytic layer porosity and bipolar plate material are consistent with the simulation conditions.
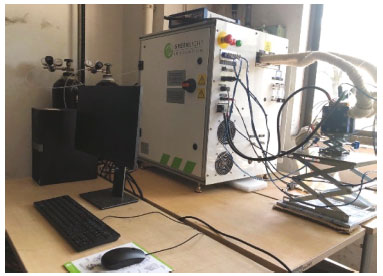 Figure 2. Fuel cell testing system
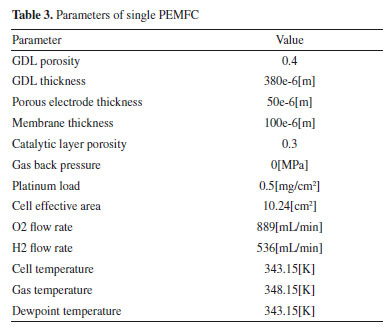
Figure 3 shows the comparison of the polarization curve between the simulation and experimental values under the same conditions and geometric parameters. It can be seen that the simulated polarization curve is similar to the experimental curve, indicating that the numerical model used in this paper is reliability.
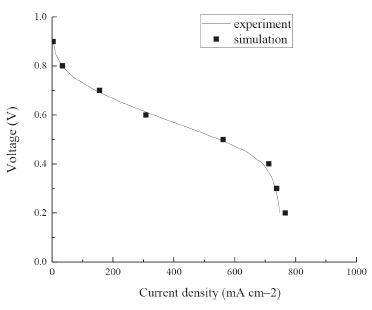 Figure 3. Comparison of the polarization curve between the simulation and experimental
RESULTS AND DISCUSSION Determination of inlet flow conditions As the significant media of proton conduction, the water of membrane plays an important role in the conduction of proton (H+). Since the form of proton conduction in this area is hydrated proton, the content of water presents the huge influence on the conductivity of membrane. Specifically, excessive content of water is easy to cause the "flooding phenomenon", and it not only hinders the diffusion of gas but also increases the contact resistance. On the contrary, too low content of water will decrease the electrical conductivity of membrane and increase the ohmic overpotential. Consequently, both these two cases are unfavourable for the improvement of PEMFC performance. Figure 1S presents the relation of the water content in membrane and the inlet flow rate (5-300 mL min-1), exhibiting that the water content decreases with the increase of inlet flow rate, and then almost unchanged. The reason is that the increase of the inlet flow rate can offer adequate power for the intake of oxygen and ensure it distribute uniform in cathode GDL, then the "flooding phenomenon" resulted from high local water content can be avoided effectively. Additionally, the increased inlet flow rate is significantly contributed to remove the redundant water and make the water content maintain a reasonable level. Figure 5S also shows that the water content of the membrane changes small when the inlet flow rate reaches 150 mL min-1, indicating that the improvement of the water content is no longer obvious when the inlet flow rate exceeds 150 mL min-1. The change regulation of oxygen distribution in cathode GDL under different inlet flow rate is shown in Figure 2S, presenting a similar regulation with Figure 1S. Figure 3S shows the distribution of the oxygen in cathode GDL with the change of inlet flow rate in the range of 5-20 mL min-1. It can be seen that the uniformity of oxygen distribution is not enough to keep the PEMFC operating normally. To sum up, the value of 150 mL min-1 is selected as the ideal gas intake condition and the value of 20 mL min-1 is regarded as the inadequate air supply condition in this paper. Optimization of flow field length under inadequate air supply condition The length of flow field presents a large effect on the performance of PEMFC, which is caused by the pressure loss of reaction gas. In this case, the phenomenon of water flooding will occur, leading to the reduction of performance and working stability for the PEMFC, and there is no doubt that this effect is greater under inadequate air supply condition. Figure 4S shows the distribution of the pressure and the maximum water content (in the interface between flow field and GDL) in different length under inadequate air supply condition. Obviously, these two parameters reduce rapidly with the increase of flow field length (the length changes with the number of channel in the same flow area in this paper). Results reveal that the optimization of flow field length is in favor of the reduction of pressure loss and the increase of the oxygen concentration in the back-end of flow field (just as in the Figure 5S). Thus, the performance and stability of operation for PEMFC is improved. Optimization of flow field width under inadequate air supply condition The optimization of flow field width is beneficial to the mass transfer of reaction gas in cathode GDL. Since the diffusion rate in anode is much higher than that in cathode and the research range of width is 0.7-1.3 mm, this paper is focused on the cathode flow filed. Figure 6S shows the distribution of cathode gas in different width, exhibiting that the wider flow field can get the more uniform gas distribution because of the larger the flow field width and the smaller the oxygen concentration difference. However, too wide flow field is not in favor of the PEMFC performance. On the one hand, Figure 6S obviously reveal that the trend of oxygen concentration difference gradually reach stable; On the other hand, the deformation of GDL will increase when the flow field is too wide, and it will cause the increase of intrusion rate for flow field by GDL.17 Finally, the performance of PEMFC will reduce due to the reduction of the effective intake volume in the flow field. In summary, the optimal width of flow field is 1.0-1.2 mm in this study. Optimization of flow field depth under inadequate air supply condition The optimization of flow field depth can improve the gas flow velocity to avoid the "flooding phenomenon" and enhance the performance of PEMFC. The change regulation of average gas flow velocity of every channel in the range of 0.8-1.4 mm is shown in Figure 7S. It can be seen that this regulation in the 8 channels is same although the maximum of average gas flow velocity appears at different point of depth. The regulation is that the shallow flow field can obtain higher gas flow velocity, and the maximum value is obtained in the range of 0.6-0.8 mm. In addition, the range of 0.6-0.8 mm is in favor of the uniformity of gas distribution in GDL because of the small cross velocity between every channel. Discussion of the results for optimization under inadequate air supply condition The length has crucial impact on the development of PEMFC performance. In the same reaction area, it can reduce the pressure loss and remove the water effectively through the method of shorten the length of the flow field. At the same time, this paper studies the influence of width and depth on the PEMFC performance, and finds the optimal value between these two factors. However, to get the more precise optimization, the comprehensive factor of width-depth is investigated and the best width-depth combination will be found. Figure 8S describes the current density under different width-depth combination (width of 1.0-1.2 mm - 0.6-0.8 mm). It can be seen that the effect of depth on the current density is greater than that of width, and the best width-depth combination is width of 1.16 mm - depth of 0.8 mm. Figure 4 reveals the comparison of the polarization curve under the inadequate air supply condition with the optimization of flow field and the ideal gas intake condition with primary flow field. Obviously, the level under the inadequate air supply condition is close to that under the ideal gas intake condition after the optimization of flow field.
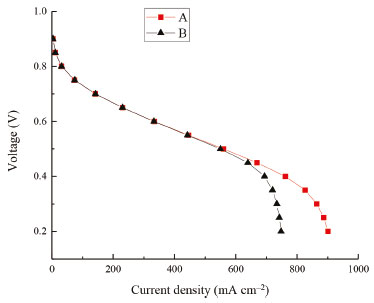 Figure 4. Comparison of polarization curve; A. The inadequate air supply condition with optimization flow field; B. The ideal gas intake condition with primary flow field
CONCLUSIONS In this paper, a three-dimensional, steady-state, constant temperature of PEMFC monomer model was established to research the improvement of PEMFC performance by the optimization of flow field size under the inadequate air supply condition. The results are as follows: (1) The length of flow field has a large effect on the performance of PEMFC and it can reduce the pressure loss and remove the water effectively through the method of shorten the length of the flow field. Additionally, the 8-channels serpentine flow field is the optimal length channel in this study. (2) The optimization of width is beneficial to mass transfer in GDL and make the gas distribution more uniform. The optimal range of width is 1.0-1.2 mm. (3) The optimization of flow field depth can improve the gas flow velocity to avoid the "flooding phenomenon" and enhance the performance of PEMFC. The optimal range of depth is 0.6-0.8mm. (4) The best width-depth combination is width of 1.16 mm - depth of 0.8 mm. (5) The level under the inadequate air supply condition is close to that under the ideal gas intake condition after the optimization of flow field.
SUPPLEMENTARY MATERIAL Figures 1S - 8S can be freely accessed at http://quimicanova.sbq.org.br, in PDF format.
ACKNOWLEDGEMENTS This work was supported by the Major Science and Technology Innovation Project in Shandong Province (2018CXGC0803) and Jinan Science and Technology Development Plan (201102026).
REFERENCES 1. Xing, D. M.; Du, X. Z.; Yu, J. R.; Power Technology 2001, 25, 171. 2. Wang, Y.; Yue, L.; Wang, S.; J. Power Sources 2017, 344, 32. 3. Pan, M.; Meng, X.; Li, C.; Int. J. Green Energy 2020,17,1. 4. Jang, J. H.; Yan, W. M.; Li, H. Y.; Int. J. Hydrogen Energy 2008, 33,156. 5. Baschuk, J. J.; Li, X.; Appl. Energy 2009,86,181. 6. Shimpalee, S.; Greenway, S.; Zee, J.W.V.; J. Power Sources 2006, 160, 398. 7. Bachman, J.; Charvet, M.; Santamaria, A.; Int. J. Hydrogen Energy 2012, 37, 17172. 8. Santamaria, A. D.; Cooper, N. J.; Becton, M. K.; Park J. W.; Int. J. Hydrogen Energy 2013, 38, 16253. 9. Khazaee, I.; Sabadbafan, H.; Heat Mass Transfer 2016, 53, 993. 10. Wang, L. P.; Zhang, L. H.; Jiang, J. P.; Appl. Mech. Mater. 2010, 44-47, 2404. 11. Liu, Z.; Zhang, H.; Wang, C.; Mao, Z.; Int. J. Hydrogen Energy 2010, 35, 2802. 12. Shimpalee, S.; Zee, J. W.; Int. J. Hydrogen Energy 2007, 32, 842. 13. Muthukumar, M.; Karthikeyan, P.; Vairavel, M.; Procedia Eng. 2014, 97, 1534. 14. Freire, L. S.; Antolini, E.; Linardi, M.; Int. J. Hydrogen Energy 2014, 37, 12052. 15. Korkischko, I.; Carmo, B. S.; Fonseca, F. C.; Fuel Cells (2017), doi: 10.1002/fuce.201700168. 16. Mojica, F.; Rahman, M. A.; Mora, J. M.; Chuang, P. Y. A.; Fuel Cells (2020), doi: 10.1002/fuce.202000002. 17. Atyabi, S. A.; Afshari, E.; Wongwises, S.; Energy 2017, 179, 490. |
On-line version ISSN 1678-7064 Printed version ISSN 0100-4042
Qu�mica Nova
Publica��es da Sociedade Brasileira de Qu�mica
Caixa Postal: 26037
05513-970 S�o Paulo - SP
Tel/Fax: +55.11.3032.2299/+55.11.3814.3602
Free access


 is velocity vector (m s-1); G is generalized diffusion coefficient; Sψ is the source items of ψ.
 the loss rate of the momentum in the porous media.
 is the production or consumption rate of the components (such as oxygen, hydrogen and water) in catalyst layer (CL).
 or
or  , the proton or electron conservation equation is derived in formula (8):
 And
And  is different in anode and cathode, just as formula (9) and (10):