Artigo
| DFT calculation and raman spectroscopy studies of α-linolenic acid |
|
Heng Peng; Hua-Yi Hou; Xiang-Bai Chen*
Hubei Key Laboratory of Optical Information and Pattern Recognition, Wuhan Institute of Technology, Wuhan 430205, China Recebido em 22/01/2021 *e-mail: xchen@wit.edu.cn Density functional theory (DFT) calculation and Raman scattering experiment have been applied to investigate an important essential fatty acid, α-linolenic acid (ALA). The DFT calculation was performed with geometry optimization and harmonic vibration using B3LYP functions with polarized 6-311+G(d,p) basis. The DFT calculated vibrational modes of ALA molecule are in excellent agreement with the Raman experimental results. A complete vibrational modes assignment is provided on the basis of potential energy distribution calculation. In addition, the DFT calculation and Raman experiment indicate that the relative intensity ratio of two characteristic modes at 1660 cm-1 and 1440 cm-1 is correlated with the number of C=C double bond in the acid chain, which may provide a simple and convenient method to differentiate ALA with other types of unsaturated fatty acids. Furthermore, the Mulliken atomic charge distribution and frontier molecular orbitals of ALA molecule were calculated. INTRODUCTION α-Linolenic acid (ALA), an important essential fatty acid (EFA), has 18 carbons in the acid chain with three cis double bonds. ALA is described as an n-3 polyunsaturated fatty acid (PUFA), its first double bond is located on the third carbon from its methyl terminal, and the other two double bonds are located on the sixth and ninth carbon respectively. For mammals, ALA cannot be synthesized directly, it must be provided through dietary intake.1 ALA can be found in seeds, nuts, and many leafy vegetable oils, especially in flaxseed with high content.2 It has been reported that ALA shows positive effects for chronic diseases including cancer, insulin resistance, and cardiovascular.3-5 An important role of ALA is assumed to be a precursor to the longer chain eicosapentaenoic acid (EPA) and docosahexanoic acid (DHA), which play a vital role in brain development.6 The metabolic pathway of ALA to EPA and DHA involves complex steps.7 The study of molecular vibrational properties of ALA will be useful for differentiating ALA with other unsaturated fatty acids and understanding the metabolic pathway of ALA. Raman spectroscopy, a powerful fast and non-destructive analytical technique, has been widely used for research in many varied fields.8-11 It can provide information about molecular vibrations that can be used for sample identification. However, only through Raman spectroscopy experiment is difficult to have a good understanding of molecular vibrational properties, especially for large molecules. Theoretical calculation and comparison of theoretical and experimental results are necessary for a systematic study of molecular vibrational property. It has been shown that density functional theory (DFT) calculation can provide reliable and accurate results for predicting and assigning vibrational modes of various molecules.12-17 Raman spectroscopy and DFT calculation have been applied to study oleic acid and linoleic acid, which have one and two C=C double bonds, respectively.18,19 In the present work, we apply Raman scattering experiment and DFT calculation to investigate the molecular vibrational properties of ALA, which has three C=C double bonds. Excellent agreement between DFT calculation and Raman experiment were achieved with very good linear relation of R2 (0.99978) and very small deviations (less than 10 cm-1). The vibrational modes assignments were interpreted with a high degree of accuracy on the basis of potential energy distributions (PED) calculation using the VEDA 4.0 program.20,21 In addition, the Mulliken atomic charge distribution and frontier molecular orbitals of ALA molecule were calculated.
EXPERIMENTAL The ALA sample was purchased from MOLBASE with a stated purity greater than 97% and used as received. Raman scattering experiments of ALA sample were performed in backscattering configuration with a Thermo Fisher DXR micro-Raman spectrometer and a Nanobase XperRam micro-Raman spectrometer. In both systems, excitation laser of 532 nm was applied; the scattered signal was detected by an air-cooled CCD detector. The spectra were corrected in wavenumber by using the 521 cm-1 vibrational mode of a Si substrate. For the DFT calculation, we employed the commonly applied method of Becke's 1988 exchange functional in combination with Becke's three-parameter hybrid exchange functional using the LYP correlation functional of Lee, Yang, and Parr (B3LYP).22-25 For geometry optimization and analytical vibration frequency calculation, the polarized 6-311+G(d,p) basis was applied with d polarization functions on heavy atoms and p polarization functions on hydrogen atoms as well as diffuse functions for heavy atoms. The quantum mechanical calculations were performed using the Gaussian09 program.26 The vibrational wavenumbers were assigned on the basis of potential energy distribution calculation using VEDA 4.0 program.20,21 Calculated data analyzing and graph plotting were performed using the Multiwfn_3.4.1(dev) program.27 Lorentzian curve has been chosen for the line shape and 4 cm-1 has been chosen for the full width at half maximum of each peak. The Mulliken atomic charge distribution and frontier molecular orbitals were calculated with the same DFT method.
RESULTS AND DISCUSSION Figure 1 presents the experimental and calculated Raman spectra of ALA molecule. The experimental spectrum recorded in the spectral range of 100-3500 cm-1 was from a Thermo Fisher DXR micro-Raman system. The inset spectrum zoomed in the spectral range of 100-1000 cm-1 was from a Nanobase XperRam micro-Raman system. ALA has the molecular formula of C18H30O2 with molecular structure as shown in the insert of Figure 1. The vibrational modes of ALA molecule are both infrared and Raman active, which is due to the C1 point group symmetry. In Figure 1, 74 vibrational modes were experimentally observed in the spectral range of 100-3500 cm-1. For the assignment of these vibrational modes, DFT calculation was performed, the calculated spectrum is also presented in Figure 1.
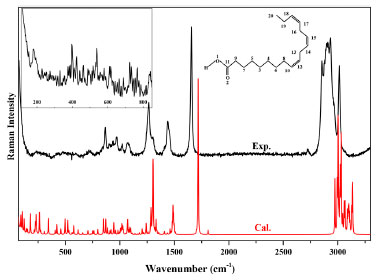 Figure 1. Experimental and calculated Raman spectra of ALA, the ALA molecular structure is shown in the insert
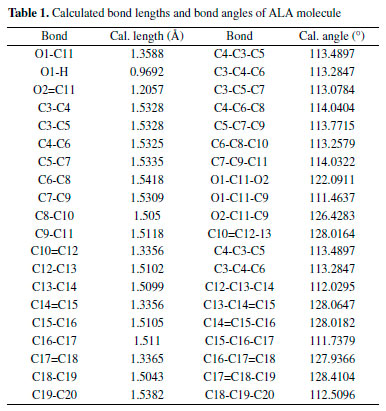
In the DFT calculation, the ground-state geometry of ALA molecule was optimized at B3LYP/6-311+G(d,p) level of theory without any symmetry restrain for achieving accurate analytical vibrational frequency calculation. The optimized structure was confirmed to be minimum energy conformation. The calculated result showed that there is no imaginary frequency at the optimized structure of the ALA molecule. Therefore a true minimum on the potential energy surface was found for the ALA molecule. The calculated bond lengths and bond angles of ALA molecule are presented in Table 1.
For further agreement between calculated wavenumbers with experimental results, i.e., to obtain small derivations and good linear correlation between calculated and experimental results, the calculated wavenumbers are normally scaled with a necessary wavenumber linear scaling (WLS) procedure by accounting anharmonicity in DFT calculation.28 In this study, the calculated wavenumbers of all the vibrational modes in the whole spectral range of 100-3500 cm-1 have been scaled down by the equation: νobs/νcal = 1.0087 - 0.0000163νcal.28 The correlation of experimental and calculated wavenumbers is plotted in Figure 2, and fitted with a linear line. Our results show that the deviations are less than 10 cm-1 between calculated and experimental wavenumbers. All the modes provide a very good linear correlation between calculated and experimental wavenumbers with R2 of 0.99978. The vibrational modes assignments have been performed based on the comparison of experimentally observed Raman peaks with DFT calculated wavenumbers, the results are presented in Table 2.
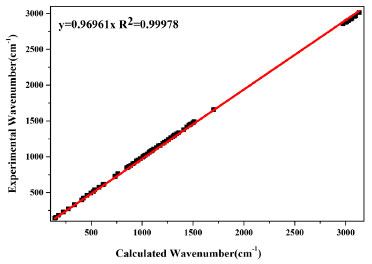 Figure 2. The linear fitting of calculated and experimental wavenumbers
The number of C=C double bonds in the acid chain is the major difference of ALA comparing with other types of unsaturated fatty acids, such as longer chain acids of EPA and DHA correlated with the metabolic pathway, oleic acid (most common monounsaturated fatty acid), linoleic acid (another well known essential fatty acid having two C=C double bonds), etc. In Figure 1, the Raman vibrational modes at 1660 and 1440 cm-1 have strong intensity and are weakly affected by their neighboring vibrational modes. The mode at 1660 cm-1 is correlated with the vibration of C=C double bond, and the mode at 1440 cm-1 is correlated with the vibration of C-H bond. ALA molecule has three C=C double bonds, interestingly the relative intensity ratio of 1660 and 1440 cm-1 is also about 3. In addition, in a previous study of Raman spectra of oleic acid (one C=C double bond) and linoleic acid (two C=C double bonds), it was indicated that the relative intensity ratio of 1660 and 1440 cm-1 was about 1 and 2, respectively.29 Therefore, fully understanding the relative intensity ratios of characteristic vibrational modes in unsaturated fatty acids would be interesting, it may provide a simple and convenient method to differentiate different types of unsaturated fatty acids. A systematic study of the correlation of relative intensity ratios with C=C double bonds in various different types of unsaturated fatty acids up to six C=C double bonds is currently underway and will be presented elsewhere. In our DFT calculation, the analyses of Mulliken atomic charge distribution and frontier molecular orbitals of ALA molecule were also performed. The Mulliken atomic charge distribution of a molecule has significant influence on dipole moment, polarizability, electronic structure and vibrational modes.30 In the present work, the Mulliken atomic charge distribution was predicted for the ALA molecule by using the DFT/B3LYP method. The calculated Mulliken atomic charge values are presented in Table 3, and the Mulliken atomic charge distribution is plotted in Figure 3. The Mulliken atomic charge distribution has been used to describe the process of electronegativity equalization and model of electrostatic potential outside the molecular surface.30 In the molecular of ALA, all H atoms have a positive charge, the C atoms (except C4 and C5) and O atoms have negative charges.
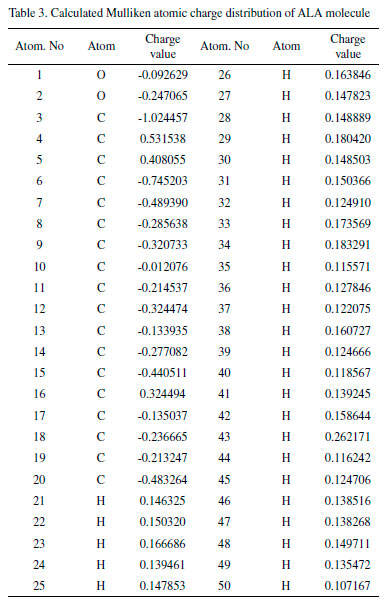
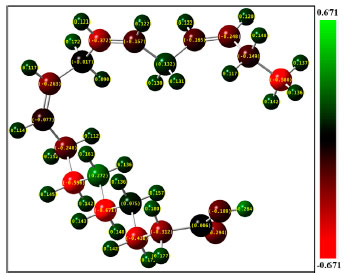 Figure 3. The Mulliken atomic charge distribution of ALA molecule
The highest occupied molecular orbital (HOMO) and lowest unoccupied molecular orbital (LUMO) are referred as "frontier orbitals", which act as the essential part in a wide range of chemical reactions. The HOMO energy characterizes the ability of electron giving, the LUMO energy characterizes the ability of electron accepting, and the gap between HOMO and LUMO characterizes the molecular chemical stability and electron conductivity.31,32 In the present work, the frontier molecular orbitals analysis of ALA was performed using the DFT/B3LYP method. The calculated frontier orbitals HOMO and LUMO of ALA molecule are presented in Figure 4, which shows that the energy gap between HOMO and LUMO is about 6.30 eV. The calculated energy gap indicates that the ALA molecule has a stable structure. The HOMO-LUMO transition is correlated with a redistribution of electronic charge between methyl group and carboxyl group.
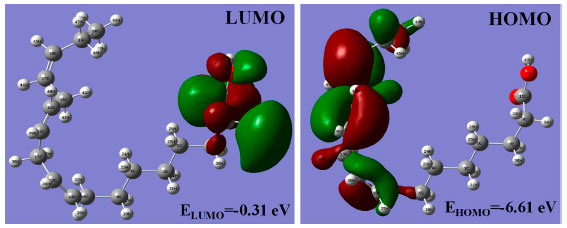 Figure 4. The HOMO and LUMO orbitals of ALA molecule
CONCLUSIONS The vibrational properties of ALA have been investigated by DFT calculation and Raman spectroscopy experiment. The DFT calculated spectrum of ALA is in excellent agreement with the Raman experimental spectrum. The deviations of calculated and experimental wavenumbers are smaller than 10 cm-1 and there is a very good linear relation with R2 of 0.99978. Also, the calculated bond lengths and bond angles of ALA molecule were listed for further study. In addition, the Mulliken atomic charge distribution and frontier molecular orbitals were calculated.
ACKNOWLEDGEMENTS X. B. Chen acknowledges the support by the National Natural Science Foundation of China (Grant No. 11574241). H. Y. Hou acknowledges the support by the Natural Science Foundation of Hubei Province (Grant No. 2020CFB380).
REFERENCES 1. Sinclair, A. J.; Attar-Bashi, N. M.; Lib, D.; Lipids 2002, 37, 1113. 2. Raper, N. R.; Cronin, F. J.; Exler, J.; J. Am. Coll. Nutr. 1992, 11, 304. 3. Stéfani, E. D.; Deneo-Pellegrini, H.; Boffetta, P.; Ronco, A.; Mendilaharsu, M.; Cancer Epidemiol. Biomarkers Prev. 2000, 9, 335. 4. Enriquez, Y. R.; Giri, M.; Rottiers, R.; Christophe, A.; Clin. Chim. Acta 2004, 346, 145. 5. Wendland, E.; Farmer, A.; Glasziou, P.; Neil, A.; Heart 2006, 92, 166. 6. Crawford, M. A.; Sinclair, A. J.; Ciba Found. Symp. 1971, 267. 7. Fekete, K.; Decsi, T.; Nutrients 2010, 2, 965. 8. Chen, X. B.; Kong, M. H.; Choi, J. Y.; Kim, H. T.; J. Phys. D. Appl. Phys. 2016, 49, 465304. 9. Chen, X. B.; Guo, P. C.; Huyen, N. T.; Kim, S.; Yang, I. S.; Wang, X.; Cheong, S. W.; Appl. Phys. Lett. 2017, 110, 122405. 10. Hou, H. Y.; Yang, X.; Mao, Z. L.; Yao, X. Y.; Chen, X. B.; Spectrochim. Acta A 2019, 221, 117206. 11. Peng, H; Wu, D.X.; Hou, H. Y.; Chen, X. B.; J. Appl. Spectrosc. 2020, 87, 548. 12. Paczkowska, M.; Mizera, M.; Dzitko, J.; Lewandowska, K.; Zalewski, P.; Cielecka-Piontek, J.; J. Mol. Struct. 2017, 1134, 135. 13. Zhou, S.; You, B.; Yao, Q.; Chen, M.; Wang, Y.; Li, W.; Spectrochim. Acta A 2013, 110, 333. 14. Mariappan, G.; Sundaraganesan, N.; Manoharan, S.; Spectrochim. Acta A 2012, 95, 86. 15. Rossi, B.; Verrocchio, P.; Viliani, G.; Mancini, I.; Guella, G.; Rigo, E.; Scarduelli, G.; Mariotto, G.; J. Raman Spectrosc. 2009, 40, 453. 16. Keresztury, G.; Holly, S.; Besenyei, G.; Varga, J.; Wang, A.; Durig, J. R.; Spectrochim. Acta A 1993, 49, 2019. 17. Contreras, C. D.; Ledesma, A. E.; Zinczuk, J.; Brandán, S. A.; Spectrochim. Acta A 2011, 79, 1710. 18. Mishra, S.; Chaturvedi, D.; Kumar, N.; Tandon, P.; Siesler, H. W.; Chem. Phys. Lipids 2010, 163, 207. 19. Machado, N. F. L.; Batista de Carvalho, L. A. E.; Otero, J. C.; Marques, M. P. M.; J. Raman Spectrosc. 2012, 43, 1991. 20. Jamróz, M. H.; Vibrational Energy Distribution Analysis: VEDA 4, program, Warsaw, 2004-2010. 21. Jamróz, M. H.; Spectrochim. Acta A 2013, 114, 220. 22. Becke, A. D.; J. Chem. Phys. 1996, 104, 1040. 23. Becke, A. D.; Phys. Rev. A 1998, 38, 3098. 24. Becke, A. D.; J. Chem. Phys. 1993, 98, 1372. 25. Lee, C.; Yang, W.; Parr, R. G.; Phys. Rev. B 1988, 37, 785. 26. Kuno, M.; Caricato, M.; Frisch, M. J.; Hiscocks, J.; Barone, V.; Bloino, J.; Biczysko, M.; MRS Bull. 2013, 37, 1. 27. Lu, T.; Chen, F.; J. Comput. Chem. 2012, 33, 580. 28. Yoshida, H.; Takeda, K.; Okamura, J.; Ehara, A.; Matsuura, H.; J. Phys. Chem. A 2002, 106, 3580. 29. Fan, Y.; Li, S.; Xu, D.; Spectrosc. Spect. Anal. 2013, 33, 3240. 30. Premkumar, S.; Jawahar, A.; Mathavan, T.; Kumara Dhas, M.; Sathe, V. G.; Benial, A. M. F.; Spectrochim. Acta A 2014, 129, 74. 31. Fukui, K.; Angew. Chem., Int. Ed. 1982, 21, 801. 32. Karabacak, M.; Cinar, M.; Kurt, M.; Spectrochim. Acta A 2009, 74, 1197. |
On-line version ISSN 1678-7064 Printed version ISSN 0100-4042
Qu�mica Nova
Publica��es da Sociedade Brasileira de Qu�mica
Caixa Postal: 26037
05513-970 S�o Paulo - SP
Tel/Fax: +55.11.3032.2299/+55.11.3814.3602
Free access


