Artigo
| Addition of natural extracts with antioxidant properties in biodiesel: analysis by neural networks of the multilayer perceptron type |
|
Marco A. J. Clementea; Heloisa H. P. SilvaI; Júlia W. CamposI; Ana C. G. MantovaniII; Dionisio BorsatoI,*
I. Departamento de Química, Universidade Estadual de Londrina, 86057-970 Londrina - PR, Brasil Recebido em: 19/02/2022 *e-mail: dborsato@uel.br Biodiesel is capable of replacing diesel because it has similar physicochemical properties, but this biofuel is susceptible to oxidation, which makes the application of antioxidant substances necessary. For this study, alcoholic extracts of senna leaves, hibiscus flowers, and blackberry were used. Biodiesel samples were submitted to physicochemical analysis to evaluate interference in the volume of these alcoholic extracts with antioxidant properties. The data obtained were processed using the neural network of the multilayer perceptron type (MLP). For the network's training, 200 epochs were used. The samples were randomly divided into three groups, with 70% used for training, 15% for testing, and 15% for validation. The type of extract was considered as a categorical variable, the extract volume as a target variable, and the other ones as input variables. Among the 200 networks trained, with 5 to 20 hidden layers, the 5 with the best performance were highlighted. The Tukey test applied to the means showed no significant difference at the 5% level, between the value of the added volume and the means value predicted by the networks. The sensitive analysis showed that the most important input variable for the construction of the model was the type of extract. INTRODUCTION Biodiesel is produced from sustainable and renewable energy sources, such as various types of vegetable oils and animal fat. It can be used in compression-ignition vehicles and is capable of replacing diesel because it has similar physicochemical properties.1 However, it is susceptible to oxidation reaction, which affects some of its essential characteristics.2 In the oxidation reaction occurs the formation of free radicals that degrade and polymerize the biodiesel. This can happen when the biodiesel is exposed to the presence of oxygen, light, temperature, enzymes, ions of metallic elements, and humidity, making it difficult to guarantee its quality, to be within the compliance parameters required for its commercialization, such as specific mass, flash point, viscosity, oxidative stability, acid number, among others.3-5 In order to delay the oxidation process and inhibit the formation of free radicals, conditions that favor the beginning of the oxidation must be eliminated and antioxidants must be added. Synthetic antioxidants are the most used in the industry. The natural extracts with antioxidants properties are obtained from fruits, leaves, spices, and flowers, which have phenolic compounds in their composition. Both types of antioxidants act in the biodiesel inhibiting the beginning of the oxidation process.6,7 To evaluate the effect of antioxidants in biodiesel, as well as its ability to protect the material against oxidation, computational tools can be used. They allow the experimental data modeling. One of these tools is the artificial neural networks (ANN), which are computational techniques that can make generalizations, that is, they generate their own rules to associate the input and output variables, after learning with training data.8,9 Among the computational tools is the Multilayer Perceptron type (MLP) network that has been widely used for modeling and patterns classification, and can solve problems of a general nature, such as approximation, classification, categorization, and forecast.10,11 This set of techniques has been applied to a wide range of areas, especially process control, satellite navigation, weather forecasting, signal processing, voice recognition, medical diagnostics and monitoring, waste treatment, ceramic engineering, geographic origin, fire detection, financial market, and pattern recognition.11-16 Since neural networks with MLP architecture are universal approximators, they can perform any regression task as long as they have an adequate number of hidden layers and neurons.14 The architecture of this type of network consists of an input layer with a neuron for each variable used, one or more intermediate layers, forming decision boundaries with some neurons to be defined, and an output layer that depends on how many parameters will be classified and how they will be represented.8,9 The objective of this work was to apply the Multilayer Perceptron type neural networks to study the behavior of natural extracts with antioxidant properties in mixtures with biodiesel.
EXPERIMENTAL PART Biodiesel Nine commercial biodiesel samples were supplied by the Fuel Research and Analysis Laboratory of the Department of Chemistry at the State University of Londrina. Biodiesel physical-chemical characterization The density (20 ºC) was determined according to the ASTM D405217 method, the flashpoint by the ASTM D93,18 kinematic viscosity (40 ºC) by the ASTM D445,19 acid number by the ASTM D664,20 water content by the ASTM D6304,21 cloud and pour point by the ASTM D2500.22 Determination of Induction Period (IP) The assays were performed at 110 °C, using the Rancimat equipment (Brand: Metrohm; Model: 873), according to the methodology described in the EN 14112.23 Alcoholic extracts obtention Extracts of senna leaves, blackberries, and hibiscus flowers were prepared using 10 g of each sample previously dried in an oven at 60 ºC and added to 250 mL of absolute ethyl alcohol (Synth). This mixture was kept protected from light at rest for 48 hours, then filtered and concentrated to approximately 50 mL with the aid of a heating plate at 60 °C. After a period of cooling at room temperature, the extract was transferred to a 50 mL volumetric flask and completed with absolute ethyl alcohol.24 Determination of phenol content The total content of phenolic compounds in each extract was determined in triplicate by spectrophotometry (Perkin Elmer, model UV-vis LAMBDA 25), using the Folin-Ciocalteu 2N reagent (Sigma-Aldrich).25 Relative protection factor (RFP) The relative protection factor was determined by the following equation:  RPF is the relative protection factor, IP (h) is the induction period of the sample with antioxidants, IPC (h) is the induction period of the control sample and V (mL) is the volume of the extract added. Kinetic parameter To calculate the rate constant (k), it was determined the slope (equation 2) of the linear fit of the time (h) and the natural logarithm of the electrical conductivity (Λ).26  Artificial Neural Networks (ANN) The multilayer perceptron network type (MLP) of the artificial neural network module of the Statistica 13.4 (2018)13 software was used. The volume of extract added (mL) was chosen as the continuous target variable, physical-chemical parameters were selected as continuous inputs variables, and the extracts used were chosen as the categorical variables, where: A = 1 for the blackberry extract; A = 2 for the hibiscus flowers extract and A = 3 for the senna leaves extract. To train the MLP network was used 200 epochs, an initial learning rate of 0.10, and it was applied to a random subdivision of the samples, in three groups: 70% for training, 15% for testing, and 15% for validation. The algorithms used for activating the hidden layer and the output were selected by the application, among those that compose its library for the module used, that is, identity, logistic (logistic sigmoid), hyperbolic tangent, exponential, and sine.
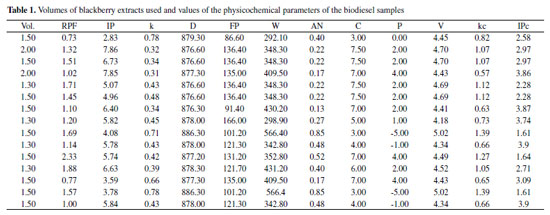
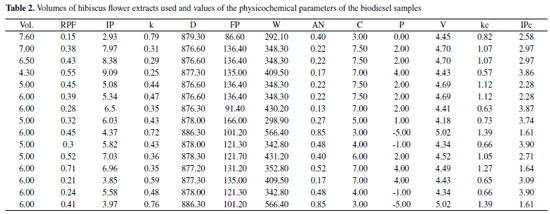
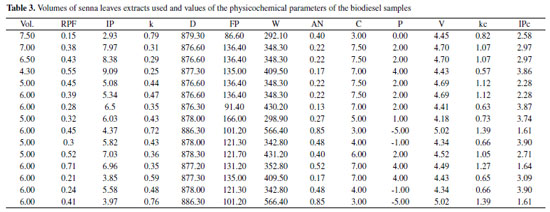
RESULTS AND DISCUSSION The three alcoholic extracts used were subjected to analysis of total phenols content to verify the antioxidant efficiency. The phenols have in their chemical structures one or more hydroxyl groups that are responsible for the biodiesel protections. The content of total phenols expressed as gallic acid equivalent in the blackberry, hibiscus flowers and senna leaves extracts was 16.45 (± 0.27), 4.62 (± 0.14), and 4.06 (± 0.12) mgGAE g-1dry mass, respectively. From the results obtained and to evaluate the oxidative stability at 110 ºC (IP), aliquots of 1.30 - 2.00 mL of blackberry extract were taken to add 4.28 - 6.60 mgEAG in 100g of biodiesel; 4.28 - 7.57 mL of hibiscus flower extract corresponding to 3.96 - 7.00 mgEAG/100g of biodiesel; and 4.28 - 7.57 mL for the senna leaves extract corresponding to 3.48 - 6.15 mgEAG/100g of biodiesel. Before the extracts were added to the biodiesel, the alcohol was evaporated so they do not interfere in the biodiesel physicochemical parameters, especially the flashpoint. Among the parameters used are: the volume in mL; dimensionless relative protection factor (RPF); density (D) in kg m-3; flash point (FP) in °C; kinematic viscosity at 40 °C (V) in mm2 s-1; water content (W) in mg kg-1; acid number (AN) in mg KOH g-1; cloud point (C) in °C; pour point (P) in °C; sample rate constant (k) in h-1; control rate constant (kc) in h-1. The induction period of the samples containing the extracts (IP) and the induction period of the control sample (IPc) in h was determined, tabulated (Table 1, 2, and 3), and processed in the regression module of the automated Neural Network of the software Statistica 13.4 (2018),13 to evaluate the physicochemical parameters' behavior of the biodiesel samples and their impact on the volume of the alcoholic extracts of blackberry, hibiscus flowers, and senna leaves added to the biodiesel samples. In Tables 1, 2, and 3, it is possible to observe that all extracts increase the biodiesel induction period, with the blackberry extract presenting greater influence, as it has 3.56 and 4.05 times more phenolic compounds in its composition than the extracts of hibiscus flowers and senna leaves, respectively. In addition, it has a relative protection factor greater than one in most experiments, and the rate constant of the biodiesel oxidation reaction undergoes a greater reduction when using this extract.
In the regression module, the multilayer perceptron type neural network (MLP) was used, testing from 5 to 20 hidden layers. The activation functions evaluated for the neurons in the hidden and output layers were: identity, logistic, tanh, exponential and sine. 200 networks were trained and the 5 best were selected by the software used. Before the network initialization, the sum of squares (SOS) error function was selected and the training algorithm used was the BFGS. The error function was used to evaluate the performance of the neural network during training. It measures how close the network predictions are to the targets, and therefore how much weight adjustment should be applied by the training algorithm on each iteration. The sum of the squares error function is mainly used for regression analysis.13 The most recommended algorithm for training neural networks is the BFGS, individually proposed by Broyden-Fletcher-Goldfarb-Shanno.9 This method performs significantly better than more traditional algorithms, such as the gradient method, but it uses more memory and requires longer computational time. However, this technique may require fewer interactions to train a neural network due to its rapid rate of convergence.8,9 Thus, before the network initialization, the sum of the squares error (SOS) function was selected and the training algorithm used was the BFGS. In the present work, the networks were trained with 70% of the samples for the training group, 15% for the test, and 15% for validation, and the choice of samples in each group was performed randomly. The performance of a neural network is measured by how well it generalizes unseen data, that is, how well it predicts new data that was not used during training.13 The test step aims to verify the ability of the trained network to perform generalizations since artificial neural networks learn a rule using training examples.27 Thus, to avoid just a coincidence in the test results, a set of validation data, also not seen, was used as an extra check on the model performance.8,9,13 The number of epochs, as well as the number of hidden layers, cannot be too high, because when a neural network learns many input-output examples, it may end up memorizing the training data. This phenomenon is known as adjustment or overtraining and causes the network to lose its ability to generalize.8,9 Thus, an initial learning rate of 0.1 and a maximum number of epochs equal to 200 were applied. The strategy to create the predictive model was Automated Network Search (ANS), from the Statistica 13.4 software (2018),13 and the decay weight in the hidden layer and the output layer ranged from 10-4 to 10-3. For the random number generator (seed for sampling), a value of 1000 was set to always produce the same random sample of data. To create a sample of different data, this value needs to be changed. Figure 1 shows the number of epochs used to train the network with the best performance, showing that the network needed only 113 epochs to achieve training and test stability. The error reduction, which represents the sum of the squared differences between the target and the output values (SOS), was fast and no oscillations were observed during training and testing. This is the standard error function commonly used in regression problems.
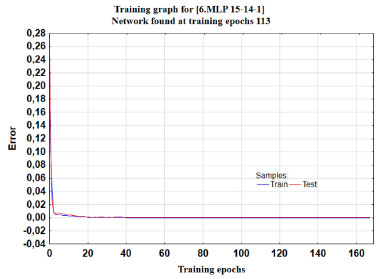 Figure 1. Error stabilization and the number of epochs used by the network
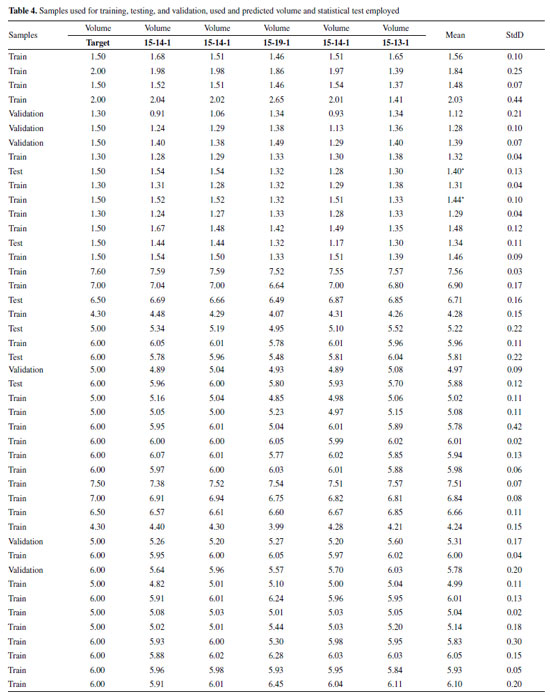
The sensitivity analysis, which evaluates the importance of the model's input variables, showed that the type of extract used contributed with 26.67%, the relative protection factor with 22.18%, the rate constant with 8.51%, and the others, all together, contributed with 42.64% in the construction of the model by the neural networks of the MLP type. The variables' order of importance was A > RPF > k > kc > IPc > AN > IP > P > C > W > D > FP > V. Table 4 presents the samples used for training, testing, validation, and the values of the volumes used experimentally and predicted by the 5 chosen networks, in which the first number represents the 15 input variables, the second represents the number of hidden layers and the third represents the number of outputs. It also shows the mean values and the standard deviations (StdD). The perceptron networks with the best performance showed 14, 19, and 13 hidden layers, for the extract volume prediction model in the biodiesel.
For all cases, both the Newman-Keuls test and the Tukey test applied to the means did not show significant differences, at the 5% level, when analyzing the extracts volume values and the mean value obtained by the 5 networks chosen with the p statistic ranging from 0.12 ≤ p ≤ 0.99. Since Tukey's method is only valid if the variance is homogeneous, Levene's test was applied. In the test, the p-value was greater than 0.05, except for two cases that are indicated by asterisks in the mean values (Table 4), so the hypothesis of variance homogeneity was accepted. The 5 selected networks presented a performance of 0.99 for training, testing, and validation, that is the best performance. The error ranged from 4 x 10⁻⁴ to 1 x 10⁻² for training, from 5 x 10⁻² to 5 x 10⁻³ for testing and from 1 x 10⁻² to 3 x 10⁻² for validation. To activate the hidden layer, the exponential and tanh algorithms were applied and for the output, activation was used the identity, logistic, and tanh. The algorithms used for activating the hidden layer and for activating the output were selected by the software among those that compose its library for the module used, that is, identity, logistics (logistic sigmoid), hyperbolic tangent, exponential, and sine. Figure 2 shows the dispersion between the target volume and output, during the training of the 5 best neural networks of the MLP type, which is a quality indication of the regression model.
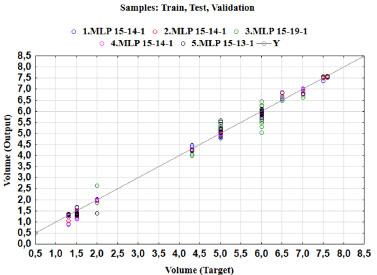 Figure 2. Dispersion graphic between predicted and experimental values of the top 5 networks
CONCLUSIONS In this work, the influence of physicochemical parameters on the volume of blackberry, hibiscus flowers, and senna leaves extracts to be added in biodiesel was studied, using the multilayer perceptron artificial neural networks as a computational tool. The sensitivity analysis of the neural network used revealed that the type of extract was the most important variable in the construction of the regression model. The applied statistical tests showed that there is no significant difference between the predicted and experimental values used in the validation of the predictive model constructed to evaluate the extract volume to be added for the biodiesel conservation.
ACKNOWLEDGMENTS State University of Londrina (UEL), National Council for Scientific and Technological Development (CNPq), Coordination for the Improvement of Higher Education Personnel (CAPES), and Araucaria Foundation to Support Scientific and Technological Development of the State of Paraná.
REFERENCES 1. Kumar, N.; Fuel 2017, 190, 328. [Crossref] 2. Cremonez, P. A.; Feroldi, M.; de Jesus de Oliveira, C.; Teleken, J. G.; Meier, T. W.; Dieter, J.; Sampaio, S. C.; Borsatto, D.; Ind. Crops Prod. 2016, 89, 135. [Crossref] 3. Borsato, D.; Dall'Antonia, L. H.; Guedes, C. L. B.; Maia, E. C. R.; Freitas, H. R. de; Moreira, I.; Spacino, K. R.; Quím. Nova 2010, 33, 1726. [Crossref] 4. Chendynski, L. T.; Mantovani, A. C. G.; Savada, F. Y.; Messias, G. B.; Santana, V. T.; Salviato, A.; Di Mauro, E.; Borsato, D.; Fuel 2019, 242, 316. [Crossref] 5. Mantovani, A. C. G.; Chendynski, L. T.; Santana, V. T.; Borsato, D.; Di Mauro, E.; Fuel 2021, 287, 119531. [Crossref] 6. Romagnoli, É. S.; Borsato, D.; Silva, L. R. C.; Chendynski, L. T.; Angilelli, K. G.; Canesin, E. A.; Ind. Crops Prod. 2018, 125, 59. [Crossref] 7. Correia, I. A. S.; Borsato, D.; Savada, F. Y.; Pauli, E. D.; Mantovani, A. C. G.; Cremasco, H.; Chendynski, L. T.; Renewable Energy 2020, 160, 288. [Crossref]. 8. Haykin, S.; Neural Networks: A Comprehensive Foundation, Prentice Hall: Upper Saddle River, 2001. 9. Bishop, C. M.; Neural networks for pattern recognition; Oxford University Press: New York, 2007. 10. Linder, R.; Pöppl, S. J.; Food Quality and Preference 2003, 14, 435. [Crossref] 11. Borsato, D.; Pina, M. V. R.; Spacino, K. R.; Scholz, M. B. dos S.; Androcioli Filho, A.; Eur. Food Res. Technol. 2011, 233, 533. [Crossref] 12. Mukesh, D.; J. Chem. Educ. 1996, 73, 431. [Crossref] 13. Statistica Software for windows, version 2018/13.4; Tulsa, OK, USA, 2007. 14. Hill, T.; Lewicki, P.; Statistics: methods and applications: a comprehensive reference for science, industry, and data mining; StatSoft, Inc., 2006. 15. Hunter, A.; Kennedy, L.; Henry, J.; Ferguson, I.; Computer Methods and Programs in Biomedicine 2000, 62, 11. [Crossref] 16. Serra, F.; Guillou, C. G.; Reniero, F.; Ballarin, L.; Cantagallo, M. I.; Wieser, M.; Iyer, S. S.; Héberger, K.; Vanhaecke, F.; Rapid Commun. Mass Spectrom. 2005, 19, 2111. [Crossref] 17. ASTM D4052-18a, Standard Test Method for Density, Relative Density, and API Gravity of Liquids by Digital Density Meter, ASTM International, West Conshohocken, PA, 2018, www.astm.org. 18. ASTM D93-20, Standard Test Methods for Flash Point by Pensky-Martens Closed Cup Tester, ASTM International, West Conshohocken, PA, 2020, www.astm.org. 19. ASTM D445-21, Standard Test Method for Kinematic Viscosity of Transparent and Opaque Liquids (and Calculation of Dynamic Viscosity), ASTM International, West Conshohocken, PA, 2021, www.astm.org. 20. ASTM D664-18e2, Standard Test Method for Acid Number of Petroleum Products by Potentiometric Titration, ASTM International, West Conshohocken, PA, 2018, www.astm.org. 21. ASTM D6304-20, Standard Test Method for Determination of Water in Petroleum Products, Lubricating Oils, and Additives by Coulometric Karl Fischer Titration, ASTM International, West Conshohocken, PA, 2020, www.astm.org. 22. ASTM D2500-17a, Standard Test Method for Cloud Point of Petroleum Products and Liquid Fuels, ASTM International, West Conshohocken, PA, 2017, www.astm.org. 23. European Committee for Standardization.; EN 14112: Determination of oxidation stability (accelerated oxidation test) 2016. 24. Spacino, K. R.; da Silva, E. T.; Angilelli, K. G.; Moreira, I.; Galão, O. F.; Borsato, D.; Ind. Crops Prod. 2016, 80, 109. [Crossref] 25. Spacino, K.; Cremasco, H.; Angilelli, K.; Mantovani, A. C.; Borsato, D.; Quim. Nova 2020, 43,1210. [Crossref] 26. Galvan, D.; Orives, J. R.; Coppo, R. L.; Rodrigues, C. H. F.; Spacino, K. R.; Pinto, J. P.; Borsato, D.; Quim. Nova 2014, 37, 244. [Crossref] 27. Borsato, D.; Moreira, M. B.; Moreira, I.; Pina, M. V. R.; Silva, R. S. dos S. F.; Bona, E.; Food Sci. Technol. 2012, 32, 281. [Crossref] |
On-line version ISSN 1678-7064 Printed version ISSN 0100-4042
Qu�mica Nova
Publica��es da Sociedade Brasileira de Qu�mica
Caixa Postal: 26037
05513-970 S�o Paulo - SP
Tel/Fax: +55.11.3032.2299/+55.11.3814.3602
Free access


