Nota Técnica
| Development and optimization of a spectrophotometric method with cloud point extraction for determination of gadolinium |
|
Jany Hellen F. de JesusI,II,#; Rennan Geovanny O. AraujoIII,IV,*; Luciane Pimenta C. RomãoI
I. Departamento de Química, Universidade Federal de Sergipe, 49100-000 São Cristovão - SE, Brasil Recebido em: 07/03/2022 *e-mail: rennan@ufba.br #alternative e-mail: jany.hellenf@gmail.com This work describes a simple, sensible, and low-cost analytical method, based on cloud-point extraction (CPE) of the surfactant (1,1,3,3-Tetramethylbutyl)phenyl-polyethylene glycol (Triton X-114), for the efficient extraction and sensible determination of gadolinium after its complexation with 1-(2-pyridylazo)-2-naphthol (PAN) and subsequent determination by ultraviolet-visible molecular absorption spectrophotometry at the wavelength of 556 nm. Full two-level and Doehlert experimental designs were applied to investigate and optimize the variables (pH, complexing concentration, and TX-114 concentration) involved in the extraction efficiency of Gd3+. The CPE was satisfactory for the determination of gadolinium with limits of detection (LoD) and quantification (LoQ) of 1.0 and 3.2 µg L-1, respectively, as well as an enrichment factor of 9.4. Accuracy was confirmed by spike tests with recovery values between 98.4 and 78.3%. The precision was expressed as relative standard deviation (%RSD, n =3), being found: 2.3% (10 µg L-1) and 2.7% (100 µg L-1). The proposed analytical method is suitable for the determination of Gd in tap water and contrast agent solutions. INTRODUCTION Gadolinium (Gd) is commonly used in magnetic resonance imaging (MRI) aiming to improve the visibility of internal structural abnormalities and lesions. Although Gd is highly toxic in vivo, its toxicity is diminished by chelation with other molecules in the contrast agent solution and it is excreted by the urine.1-3 However, patients with severe renal dysfunction may develop nephrogenic systemic fibrosis (NSF), which may be induced by the deposition of free gadolinium ions in tissues and organs.1,4,5 Contrast enhancement in magnetic resonance imaging (CE-MRI) has been used in more than 300 million procedures performed until 2016.6 Currently, of the 60 million MRI procedures conducted annually worldwide, about one-third uses contrast-enhancing agents, mostly containing the element gadolinium.7 Hence, there is a large input of gadolinium into the environment, when compared to the other rare earth elements, resulting from the frequent application of contrast agents.2,8 Gadolinium can be determined using techniques such as inductively coupled plasma-optical emission spectrometry (ICP OES),9 inductively coupled plasma-mass spectrometry (ICP-MS).1,10,11 Since these are expensive and complex, it is important to develop rapid and inexpensive techniques for the monitoring and determination of Gd in different matrices. Some ultraviolet and visible molecular absorption spectrometry (UV-Vis)12-15 is also found as method in the literature. Determination of trace elements in complex matrices is always challenging in analytical chemistry. Separation and preconcentration procedures are important in analytical chemistry, because these procedures not only eliminate or minimize matrix effects and concomitants originally present, but also enable the preconcentration of the analytes and their determination at very low concentration levels (µg L-1 or ng L-1).16,17 The use of cloud point extraction (CPE) is an attractive alternative to conventional extraction and preconcentration procedures since aqueous solutions are used in the CPE method, instead of toxic and flammable organic solvents, thus providing many advantages over traditional liquid-liquid extraction (LLE).16-18 This procedure is based on the cloud point of a surfactant in solution, that is, the temperature at which the solution forms two phases due to the formation of micelles.19,20 In some cases, the use of safe surfactants at cloud point can be employed instead of traditional solvents, causing CPE to be an advantageous alternative to LLE.16 Triton X-114 (polyethylene glycol tert-octylphenyl ether) is a nonionic surfactant widely applied for this purpose, due to its low cloud point temperature and high density of the surfactant-rich phase, as well as low cost, commercial availability, and lower toxicity.21 Hence, CPE has been used in the determination of many trace contaminants, both organic and inorganic, such as phenol species,22 copper,23 mercury,24 chromium,25 lead,26 cobalt, and nickel.27 Gadolinium has been determined using a CPE method with the spectrophotometric determination of the Gd(III)-2-(3,5-dichloro-2-pyridylazo)-5-dimethylaminophenol complex, after elimination of gadolinium-based pharmaceuticals in urine.3 However, it was necessary to use a cation exchange column and a chromatographic procedure to remove contaminants present in the urine. In a more recent paper, a CPE procedure, developed for the separation of Gd3+ from other f-block elements, is described. In this case, at optimum obtained conditions, the limit of detection and the limit of quantification were 0.03 and 0.11 μg L-1, respectively, for Gd determination by ICP OES.28 This work proposes a rapid and low-cost spectrophotometric method for the determination of Gd, employing CPE applied to tap water and contrast agent, with no need of a cation exchange column and a chromatographic procedure to remove possible concomitants present in the sample. Despite the usage of a new complexing agent, the limit of quantification value was similar to those reported in the literature.3
EXPERIMENTAL Reagents and solutions All reagents used were of analytical grade and were stored according to the manufacturer's instructions. The gadolinium standard for atomic absorption spectrometry (AAS TraceCERT®, 1000 mg L-1 Gd) was in a nitric acid solution medium. Gadolinium 100 mg L-1 intermediate solution was prepared by dilution of the 1000 mg L-1 Gd stock solution (Merck, Darmstadt, Germany). A solution containing a concentration of 27 mg L-1 of 1-(2-pyridylazo)-2-naphthol (PAN, Sigma Aldrich, São Paulo, Brazil) was prepared by measuring the mass of 2.7 mg and dissolving it in 100 mL of absolute ethanol (Merck, Darmstadt, Germany). Tris buffer solution (0.125 mol L-1, pH ~ 8.0) was prepared by dissolution of 12.10 g of Tris-(hydroxymethyl) aminomethane (Merck, Darmstadt, Germany), the addition of hydrochloric acid or sodium hydroxide to adjust pH, in deionized water to a final volume of 100 mL. Solution 1.0% m v-1 of Triton X-114 (polyethylene glycol tert-octylphenyl ether, Sigma Aldrich, São Paulo, Brazil) was prepared by dissolving 0.5 g in 50 mL with deionized water. The ammoniacal buffer solution (0.125 mol L-1, pH 8.0) containing 10% v v-1 acetone was prepared using 4.20 mL of a 28% m m-1 ammonium hydroxide solution (Hexis, São Paulo, Brazil), with the addition of 50 mL of acetone (Merck, Darmstadt, Germany) and hydrochloric acid to adjust the pH (8.0), to a final volume of 500 mL in deionized water. A solution containing a concentration of 2.5 mol L-1 of potassium cyanide (Merck, Darmstadt, Germany) was prepared by dissolving a mass of 7.76 g of the solid and filling up to 50 mL with deionized water. Instrumental Spectrophotometric measurements were performed using an ultraviolet-visible (UV-Vis) molecular absorption spectrophotometer (Model Genesys 10S, Thermo Scientific, Madison, USA), with wavelength scanning from 180 to 700 nm. Cloud point extraction procedure The solution containing gadolinium, in concentrations varying from 0.01 to 0.2 mg L-1, was treated with 2.5 mL of 27 mg L-1 1-(2-pyridylazo)-2-naphthol (PAN) solution, in pH 8 with Tris buffer addition in a concentration of 0.125 mol L-1, chosen from pH study. After 5 min, 1.0 mL volume of 1.0% m v-1 Triton X-114 solution (0.04% m v-1) was added and the 25 mL resulting solution was heated in a water bath (Model 22, Fisatom, Brazil) at 40 °C for 15 min, followed by 15 min centrifugation (Eppendorf 5810 R centrifuge, Brinkmann Instruments, Germany) at 1500 rpm. After that, it was kept in an ice bath for 15 min. The aqueous phase was poured off, and to the remaining micellar phase, it was added 2.5 mL of a pH 8 ammonia buffer solution, containing 10% v v-1 of acetone, before analysis, by molecular absorption spectrophotometry at 556 nm wavelength. This pH 8 ammonia buffer solution was added for absorption spectrophotometry analysis since the complex is undone if water or ethanol is added before the analysis, becoming not possible to quantify the gadolinium. Also, acetone in the buffer helps to dissolve the complex. A previous test was performed and no effect on shift peak was observed. Multivariate optimization of the cloud point extraction A full 23 factorial design was used to study the significant variables and their interactions at a 95% confidence level. The variables chosen were the buffer, ligand, and surfactant concentrations. The maximum and minimum values were chosen according to previous experiments, with triplicate of the center point. After this, a Doehlert design was used to study the significant variables obtained from the factorial design. The simultaneous analysis was processed using the Statistica® software version 6.0 (StatSoft, Tulsa, USA). Quality control and tap water samples For evaluation of accuracy and precision, tap water samples were collected and addition and recovery tests were performed for gadolinium concentrations at two levels: 10 µg L-1 and 100 µg L-1. For tap water analysis, a volume of 100 µL of potassium cyanide solution 2.5 mol L-1 was added to 25 mL of the sample (final concentration of 0.01 mol L-1 KCN) for masking foreign ions.29 Other masking agents were also investigated, such as citrate ion and ethylenediaminetetraacetic acid (EDTA), but they were not selective in masking only the interferences. The analysis was performed using the proposed analytical method with cloud point extraction to a final volume of 25 mL. The experiments were performed in triplicate. Determination of gadolinium in contrast pharmaceuticals The gadolinium contrast agents (denoted "A" and "B") were analyzed by the proposed analytical method, using 50 μL of each pharmaceutical. Since the gadolinium-based contrast pharmaceuticals were acquired in form of chelate complexes, the samples were digested by addition of 7 mL of nitric acid (HNO3, 65% m m-1, Merck, Darmstadt, Germany) and 3 mL of hydrogen peroxide (30% m m-1, Merck, Darmstadt, Germany). The mixtures were heated at 150 °C for 2 hours in a closed digester block (Model TE007-A, TECNAL, São Paulo, Brazil) equipped with fifteen polytetrafluoroethylene (PTFE) flasks with lids, followed by the addition of deionized water, to the digested solution, up to 15 mL. An aliquot of 0.5 mL of the digested solution was used for Gd determination. In the following step, the CPE procedure described in the "Cloud point extraction procedure" Section was applied, resulting in a final volume of 25 mL. The experiments were performed in triplicate.
RESULTS AND DISCUSSION Effect of pH In this work, colored complexes were obtained by the addition of a 1-(2-pyridylazo)-2-naphthol (PAN) solution in an ethanolic medium to the solution containing gadolinium, with a variation of the pH. Firstly, experiments were performed to obtain more information about the ligand and its complex with gadolinium. For this, a solution containing 3 mg L-1 of the ligand (PAN) was submitted to scanning molecular absorption spectrometry, followed by the addition of 0.98 mg L-1 of a solution of Gd3+. Initially, the tests were performed at pH 9 and then in the pH range from 7 up to 11 by the addition of buffers. The best condition was then selected for the subsequent experiments. Figure 1a shows the absorption spectra for PAN and PAN-Gd at pH values of 7, 8, 9, 10, and 11. Higher absorption by the complex was observed at the wavelength range from 530 to 600 nm, and the condition at the wavelength of 556 nm, in pH 8, was chosen for Gd determination. The solution of PAN is slightly acid and no complex with gadolinium is formed when the solutions were mixed. As expected, in the basic medium, the conjugate base of PAN is in higher concentration, making it possible for the ligand to act as a complexant. In solution at pH 7 (neutral solution) and pH 11 (higher value), no formation of the PAN-Gd complex was observed, and the profile of the spectra is very similar to the PAN spectrum.
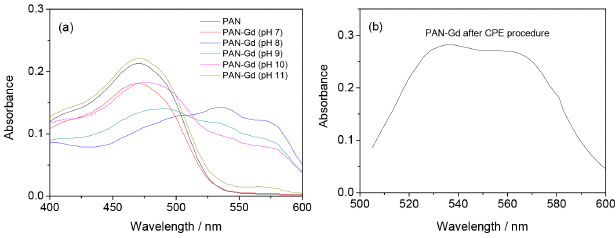 Figure 1. Absorbance spectra of PAN and PAN-Gd: (a) in pH range from 7 to 11; and (b) at pH 8 after CPE procedure
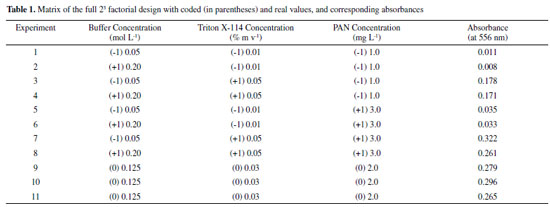
In all experiments, the micellar phase was treated with 2.5 mL of the ammonia buffer solution at pH 8, containing 10% v v-1 acetone, before analysis using molecular absorption spectrophotometry at wavelength 556 nm. Figure 1b shows the spectrum PAN-Gd at pH 8 after the CPE procedure. Multivariate optimization of the cloud point extraction Cloud point extraction (CPE) depends on several factors such as complex formation and pH. These factors were established in preliminary experiments. Multivariate optimization was performed in two steps. Firstly, full 23 factorial design was applied to obtain initial information about the significant variables in the chemical system. In this step, a Gd concentration of 50 µg L-1 was employed and the concentrations of the evaluated factors were as follows: Tris buffer solution (0.05 - 0.20 mol L-1), Triton X-114 (0.01 - 0.05% m v-1), and PAN (1.0 - 3.0 mg L-1), for 25 mL of the resulting solution, as shown in Table 1. The obtained absorbance was used as the response (dependent variable) in the two-level factorial design. The Pareto chart (Figure 2) shows that the variables Triton X-114 and PAN concentrations were significant, with an increasing effect on the absorbance at higher concentrations. A new optimization was required to obtain the critical values for the CPE procedure. The Tris buffer concentration was not significant and was fixed at 0.125 mol L-1.
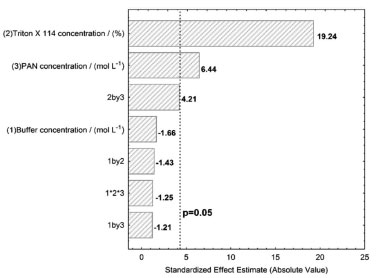 Figure 2. Pareto chart for the two-level factorial design
In the second step, the Triton X-114 and PAN concentrations were optimized using a Doehlert design to obtain the best condition for the spectrophotometric Gd determination after the CPE. The coded and real values for the studied variables are shown in Table 2.
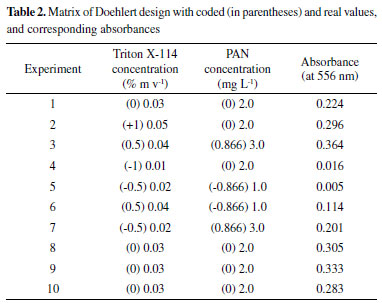
Figure 3 shows the contour graph obtained using the Doehlert design. Evaluation of the fitting of the quadratic model to the experimental data was performed by analysis of variance (ANOVA), with a p-value of 0.85, confirming a satisfactory fit of the quadratic model (at 95% confidence level), as shown in Table 3. The critical real values were 2.7 mg L-1 and 0.04% m v-1 for PAN and Triton X-114 concentrations, respectively, for a final volume of 25 mL. In all experiments, the micellar phase was treated with 2.5 mL of ammonia buffer solution, at pH 8.0, containing 10% v v-1 acetone, added before the analysis using molecular absorption spectrophotometry at wavelength 556 nm.
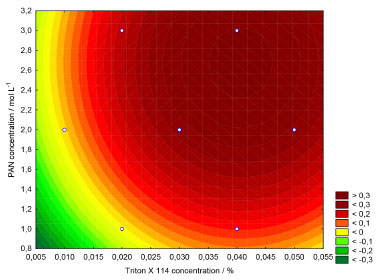 Figure 3. Contour curves for the Doehlert design
Linear regression analysis was used in determining the correlation between the predicted and experimental values. The linear equation was y = 0.952 (± 0.174)x + 0.010 (± 0.043), expressed as 95% confidence interval, and a correlation coefficient (r) of 0.9758, indicated strong correlation. Hence, there were no significant differences between the experimental values obtained using the Doehlert design, and the predicted values found using the mathematical model since the values of a, b, and r met the ideality requirements for a 95% confidence interval (a = 1, b = 0, and r = 1).30Figure 1S (see in Supplementary Material) shows the graph of observed and predicted values, as well as the correlation between them. Determination of Gd after cloud point extraction The enrichment factor for gadolinium determination by the spectrophotometric method, after cloud point extraction, was determined through the plotting of two analytical curves. The enrichment factor was calculated considering the ratio between the slopes of the analytical curves with preconcentration (ranging from 0.01 up to 0.20 mg L-1, Abs = 2.624 (±0.036) L mg-1 - 0.002 (±0.004), r = 0.9993) and without preconcentration (ranging from 0.98 up to 2.45 mg L-1, Abs = 0.286 (±0.012) L mg-1 + 0.0352 (±0.019), r = 0.9965), resulting in a value of 9.4. The obtained analytical curves, with and without preconcentration, are shown in Figure 2S (see Supplementary Material). The analytical curve prepared with Gd preconcentration using cloud point extraction presented a correlation coefficient (r) of 0.9993. The sensitivity was given by an angular coefficient of 2.62 L mg-1. The limits of detection (LoD) and quantification (LoQ) were obtained as 3×SD and 10×SD divided by the slope of the line equation obtained from the external analytical curve, considering the standard deviation (SD) of ten measurements of the absorbance of a blank solution,31 resulting in values of 1.0 and 3.2 µg L-1, respectively. This LoD was similar to the value of 0.91 µg L-1 obtained in an earlier study by Silva et al.,3 who developed a new molecular absorption spectrometry method for the determination of Gd3+ in urine, based on the formation of complexes with 2-(3,5-dichloro-2-pyridylazo)-5-dimethylaminophenol. However, in contrast to the earlier method, in the present case, it was not necessary to use a cation exchange column and a chromatographic procedure to remove Ca2+ and other possible concomitants present in the sample. In another work, Khalifa et al.28 developed a method for gadolinium determination using CPE and detection by ICP OES. Although the obtained values of LoD and LoQ, 0.03 and 0.11 μg L-1 respectively, were more sensitive than those obtained in our methodology, they used a high-cost instrumentation for both acquisition and maintenance. A comparison is presented in Table 4.
Accuracy, precision, and tap water analysis The proposed analytical method was applied to the analysis of tap water, using potassium cyanide to mask the interfering ions present in the samples. Addition and recovery tests were performed using concentration levels of 10 and 100 µg L-1, resulting in recoveries of 98.4 ± 2.3% and 85.9 ± 2.7%, respectively. The precision values, expressed as relative standard deviation (RSD), were 2.3% for 10 µg L-1 and 2.7% for 100 µg L-1, showing that the proposed analytical method provides accurate and precise quantitative analysis. The concentration of Gd in tap water was below the LoQ (<3.2 µg L-1) for the proposed methodology. Determination of Gd in contrast pharmaceuticals The contrast agent solutions A and B (containing 75.8 g L-1 Gd, according to the manufacturer, as stated on the label) were digested using the procedure described in Section 2.6, followed by cloud point extraction and determination of Gd. The recovery values were 88.1 ± 7.5% for solution A and 78.3 ± 3.6% for solution B, relative to the theoretical concentrations, informed in the label of the contrast agent flask.
CONCLUSIONS A simple, sensitive, accurate, precise, and low-cost methodology was developed for the determination of Gd using cloud point extraction (CPE) and detection by UV-Vis molecular absorption spectrophotometry. This method does not require the use of expensive organic solvents and is simpler when compared to other methodologies. The use of experimental designs enabled optimization of the significant variables of the preconcentration employing CPE. Data from experiments and theoretical calculations presented a good agreement, and the model could be used to describe the behavior of the chemical system. The proposed analytical method was applied to analyses of tap water and contrast agents, demonstrating its suitability for the determination of Gd in environmental and pharmaceutical samples. The results showed that CPE is a viable option for Gd determination using UV-Vis molecular absorption spectrometry, with an enrichment factor of 9.4. SUPPLEMENTARY MATERIAL Supplementary data are available free of charge at http://quimicanova.sbq.org.br as PDF file.
ACKNOWLEDGEMENTS This work was supported by Conselho Nacional de Desenvolvimento Científico e Tecnológico (CNPq, Brasília, Brazil), Fundação de Amparo à Pesquisa do Estado da Bahia (FAPESB, Salvador, Brazil), Fundação de Amparo à Pesquisa do Estado de São Paulo (FAPESP, São Paulo, Brazil) and Fundação de Apoio à Pesquisa e a Inovação Tecnológica do Estado de Sergipe (FAPITEC, Aracaju, Brazil), providing scholarship and financial support. This study was also financed in part by the Coordenação de Aperfeiçoamento de Pessoal de Nível Superior, Brasil (CAPES, Brasília, Brazil), Financial Code 001.
REFERENCES 1. Sato, T.; Ito, K.; Tamada, T.; Kanki, A.; Watanabe, S.; Nishimura, H.; Tanimoto, D.; Higashi, H.; Yamamoto, A.; Magnetic Resonance Imaging 2013, 31, 1412. [Crossref] 2. Birka, M.; Wehe, C. A.; Telgmann, L.; Sperling, M.; Karst, U.; J. Chromatogr. A 2013, 1308, 125. [Crossref] 3. Silva, M. F.; Fernandez, L. P.; Olsina, R. A.; Analyst 1998, 123, 1803. [Crossref] 4. Cuende, E.; Aldamiz, M.; Portu, J.; Ruiz de Gauna, R.; Zaballa, R.; Vesga J. C.; Reumatología Clínica 2009, 5, 264. [Crossref] 5. Marckmann, P.; Skov, L.; Radiologic Clinics 2009, 47, 833. [Crossref] 6. Lohrke, J.; Frenzel, T.; Endrikat, J.; Alves, F. C.; Grist, T. M.; Law, M.; Lee, Jeong, M.; Leiner, T.; Li, K. C.; Nikolaou, K.; Prince, M. R.; Schild, H. H.; Weinreb, J. C.; Yoshikawa, K.; Pietsch, H.; Adv. Ther. 2016, 33, 1. [Crossref] 7. Wei, H.; Bruns, O. T.; Kaul, M. G.; Hansen, E. C.; Barch, M.; Wisniowska, A.; Chen, O.; Chen, Y.; Li, N.; Okada, S.; Cordero, J. M.; Heine, M.; Farrar, C. T.; Montana, D. M.; Adam, G.; Ittrich, H.; Jasanoff, A.; Nielsen, P.; Bawendi; M. G.; Proc. Natl. Acad. Sci. U. S. A. 2017, 114, 2325. [Crossref] 8. Kümmerer, K.; Helmers, E.; Environ Sci Technol. 2000, 34, 573. [Crossref] 9. De Jong, N.; Draye, M.; Favre-Réguillon, A.; LeBuzit, G.; Cote, G.; Foos, J.; J. Colloid Interface Sci. 2005, 291, 303. [Crossref] 10. Yantasee, W.; Fryxell, G. E.; Porter, G. A.; Pattamakomsan, K.; Sukwarotwat, V.; Chouyyok, W.; Koonsiripaiboon, V.; Xu, J.; Raymond, K. N.; Nanomedicine: Nanotechnology, Biology and Medicine 2010, 6, 1. [Crossref] 11. Boyken, J.; Frenzel, T.; Lohrke, J.; Jost, G.; Pietsch, H.; Invest. Radiol. 2018, 53. [Crossref] 12. Martinez, L. D.; Perino, E.; Marchevsky, E. J.; Olsina, R. A.; Talanta 1993, 40, 385. [Crossref] 13. Shibata, S.; Anal. Chim. Acta 1963, 28, 388. [Crossref] 14. Barge, A.; Cravotto, G.; Gianolio, E.; Fedeli, F.; Contrast Media Mol. Imaging 2006, 1, 184. [Crossref] 15. Ganesh, S.; Pandey, N. K.; International Journal of Advances in Chemistry 2017, 3, 1. 16. Bezerra, M. de A.; Arruda, M. A. Z.; Ferreira, S. L. C.; Appl. Spectrosc. Rev. 2005, 40, 269. [Crossref] 17. Paleologos, E. K.; Giokas, D. L.; Karayannis, M. I.; Trends Anal. Chem. 2005, 24, 426. [Crossref] 18. Ulusoy, H. B.; Gürkan, R.; Ulusoy, S.; Talanta 2012, 88, 516. [Crossref] 19. Samaddar, P.; Sen, K.; J. Ind. Eng. Chem. 2014, 20, 1209. [Crossref] 20. Bezerra, M. A.; Ferreira, S.; Extração em ponto nuvem: Princípios e aplicações em química analítica, 1a ed., Empresa Gráfica da Bahia: Vitoria da Conquista, 2006. 21. Pytlakowska, K.; Kozik, V.; Dabioch, M.; Talanta 2013, 110, 202. [Crossref] 22. Zain, N. N. M; Abu Bakar, N. K; Mohamad, S.; Saleh, N. M.; Spectrochim. Acta, Part A 2014, 118, 1121. [Crossref] 23. Gouda, A. A.; Amin, A. S.; Spectrochim. Acta, Part A 2014, 120, 88. [Crossref] 24. Dittert, I. M.; Maranhão, T. A.; Borges, D. L. G.; Vieira, M. A.; Welz, B.; Curtius, A. J.; Talanta 2007, 72, 1786. [Crossref] 25. Matos, G. D.; dos Reis, E. B.; Costa, A. C. S.; Ferreira, S. L. C.; Microchem. J. 2009, 92, 135. [Crossref] 26. Blanchet-Chouinard, G.; Larivière, D.; Talanta 2018, 179, 300. [Crossref] 27. Tarighat, M. A.; Afkhami, A.; J. Braz. Chem. Soc. 2012, 23, 1312. [Crossref] 28. Khalifa, M. E.; Mortada, W. I.; El-defrawy, M. M.; Awada, A. A.; Microchem. J. 2019, 151, 104214. [Crossref] 29. Goto, K.; Taguchi, S.; Fukue, Y.; Ohta, K.; Watanabe, H.; Talanta 1977, 24, 752. [Crossref] 30. Miller, J. N.; Miller, J. C.; Statistics and Chemometrics for Analytical Chemistry, 6th ed., Pearson: Gosport, 2010. 31. IUPAC; Spectrochim. Acta, Part B 1978, 33, 247. [Crossref] |
On-line version ISSN 1678-7064 Printed version ISSN 0100-4042
Qu�mica Nova
Publica��es da Sociedade Brasileira de Qu�mica
Caixa Postal: 26037
05513-970 S�o Paulo - SP
Tel/Fax: +55.11.3032.2299/+55.11.3814.3602
Free access


