Artigo
| ATR-FTIR and UV-Vis as techniques for methanol analysis in biodiesel-washing wastewater |
|
Tiago Gomes dos Santos*; Rúben Santana Ramos da Silva; Fabioney Garcia da Costa; Demétrio de Abreu Sousa
Instituto Federal do Mato Grosso (IFMT), Campus Cuiabá-Bela Vista, 78050-560 Cuiabá − MT, Brasil Recebido em 09/11/2022 *e-mail: tgs.catalise@gmail.com Methanol present in wastewater from the biodiesel industry can become an atmospheric pollutant and an environmental liability of effluents. This article proposes the development and performance evaluation of two spectroscopic methods, ATR-FTIR and UV-Vis, to identify and quantify methanol in aqueous media. The results of both ways exhibited remarkable linear detection, with a coefficient of determination (r2) > 0.99, wide working range, and relative standard deviation (RSD) < 12%. In the ATR-FTIR method, the detection and quantification limits were 0.064 and 0.128% m V-1, respectively. The UV-Vis method presented lower limits (0.005 and 0.008% m V-1, respectively). Finally, the methods were successfully applied to quickly and sensitively quantify the methanol present in wastewater from biodiesel-washing in a wide concentration range of 0.008-0.641% m V-1. Therefore, we evidenced the feasibility of spectroscopic methods in quality control for identifying and quantifying methanol in aqueous solution, with potential for application in biodiesel production industries and research laboratories. Mainly by ATR-FTIR, in the region of 1300-900 cm-1, as it proved to be more environmentally friendly, faster, and cheaper than the GC-FID method. INTRODUCTION Water is a limited resource, and it is increasingly challenging to meet the population's use needs. Based on the UN's World Water Development Report (WWDR), it is estimated that 57% of the world's population will live in areas that will experience water shortages at least one month a year by 2050 and that pollution from the generation of industrial effluents in water bodies, will further limit the amount of water with potability standard for human consumption.1 In this scenario, the biofuels industry routinely uses large volumes of potable water and discharges large volumes of post-processed water as effluents. In the final process of biodiesel production, it is submitted to a refining step that involves the removal of by-products, such as glycerol and residual catalyst, by repeated washing with warm water.2,3 These washes also allow the separation of unreacted methanol, glycerides that have not been transesterified, and sodium methylate residues.4 Washing with water is very efficient in removing impurities. However, this step has been the subject of criticism and environmental objections due to the relatively large amounts of process water that are emitted as effluents. It is estimated that about 20-120 L of effluent is generated for every 100 L of biodiesel.5 The large volume of effluent produced by the washing process becomes an obstacle for the industry and the environment. In general, these waters resulting from the biodiesel-washing process are chemically unsuitable to be released into any water body, requiring treatment for disposal, which increases the cost of production or reuse properly. In particular, residual methanol is the simplest of the organic alcohols, a polar molecule, highly toxic to humans, causing blindness and/or death.6-8 In addition to water contamination, methanol can evaporate during effluent treatment, causing atmospheric pollution. However, methanol must be removed from biodiesel to ensure a quality parameter, whose concentration to be limited is 0.20% m/m, or equivalent to 2000 mg kg-1.9 Most analytical methods follow the ABNT NBR 153439 or BS EN 1411010 technical standards, official methods for determining the concentration of residual methanol in biodiesel by gas chromatography with flame ionization detection (GC-FID), which requires sample preparation, long analysis time, expensive equipment, and chromatographic supplies. The use of other techniques has also been reported in the literature, for example, near-infrared spectroscopy,11 spectrophotometer in the visible region using a wavelength of 420 nm,12 determination of flash point,13 1H nuclear magnetic resonance spectroscopy,7 vapor permeation with voltammetric detection,14 Raman15 and microdistillation with detection based on pictures taken by a smartphone.16 In addition to these, Indian researchers released for the first time a study to evaluate biodiesel wastewater but consider parameters such as pH and turbidity by the image processing technique.17 Although De Gisi et al.18 made a significant contribution by studying the variation of the physicochemical parameters of biodiesel wastewater during different treatments, according to the researchers, the variation of chemical oxygen demand (COD) and pH is remarkable, 10,850.8-43,898.9 ppm and 5.9 to 3.3, respectively, concluding that these parameters have an important effect on the type of process to be carried out. In addition, some procedures for quality control of biodiesel have been developed, such as the local paper test to quantify the value of iodine,19 the single vial procedure for glycerol determination,20 those based on flow analysis to determine water,21 acidity22 or glycerol,23 but a methodology is still needed to analyze the concentration of methanol present in the wastewater from biodiesel-washing, which shows demand in this area of research. To this end, the objective of this work was to develop and compare two methods using Fourier transform infrared (FTIR) absorption spectroscopy techniques coupled to an attenuated total reflectance (ATR) cell, and in the ultraviolet-visible (UV-Vis), for identification and quantification of methanol in the aqueous medium. There is a lot of potential in using these spectroscopic techniques, mainly because they are relatively simple, fast, without the need for previous sample preparation, reproducible, and allow the addition of a large number of scans due to the stability of commercial instruments. Finally, after developing the methods, they were applied to real effluent, further proving the practicality and convenience of the developed methodologies. To the best of our knowledge, this study is the first to focus on analyzing methanol in aqueous media with a focus on biodiesel-washing wastewater.
EXPERIMENTAL Materials Methanol (CH3OH, Merck, HPLC, ≥ 99.9%), sulfuric acid (H2SO4, Cinética, 97%), potassium dichromate (K2Cr2O7, Cinética, 99%), ethanol (CH3CH2OH, Qhemis, 99.5%), glycerin (C3H8O3, Synth, 99.5%) and deionized water. All reagents were used as received. The biodiesel-washing wastewater selected for this study was donated by the industry in Mato Grosso, Brazil. Detection and quantification of methanol by ATR-FTIR Before obtaining the infrared spectra, in addition to the analysis room environment being fully controlled with temperature and air humidity of approximately 20 ºC and 35%, respectively, methanol standard solutions were prepared to quantify 0.3204 g of methanol poured into 50 mL volumetric flasks and made up to volume with deionized water. Ten standard methanol solutions of the same concentration (0.641% m V-1) were prepared. For the construction of the analytical curve, five points corresponding to 40 dilutions of the standard solutions were considered. Arranged from the working solutions, the mid-IR spectra by Fourier transform were obtained by a Shimadzu spectrometer, model IRSpirit, coupled with a QATR-S single-reflection cell, and diamond prism with a contact diameter of 1.8 mm. Measurements were made in the spectral range of 1300-900 cm-1, 45 scans in absorbance mode, resolution of 8 cm-1, apodization by the Sqr Triangle function, and 20 µL of each sample entry was used. These operating conditions led to 30 s analysis time. Height values were used as an analytical signal to construct the curve. They were obtained in two steps: baseline subtraction by peak analysis function and band deconvolution using the Gauss model with Levenberg-Marquardt interaction algorithm. Detection and quantification of methanol by UV-Vis The absorbance values achieved at a wavelength of 600 nm were obtained using diffuse reflectance spectroscopy in the visible region (380-800 nm) in a Shimadzu spectrophotometer, model UV-1800. The preparation of the standard and working solutions was carried out as described above. In addition, before measurements in the spectrophotometer, some steps were necessary: 5 mL of H2SO4 was slowly poured into each diluted sample, followed by the addition of 1 mL of the K2Cr2O7 solution (10% m V-1), and, finally, the solutions were mixed for approximately 2 min by vortexing. The finished mixtures were analyzed using a blank sample prepared in the same way described above by pouring H2SO4 and the K2Cr2O7 solution into 5 mL of deionized water without adding methanol. Determination of methanol by GC-FID A Shimadzu GC-2010 gas chromatograph with flame ionization detection (FID) in headspace mode was used, following the BS EN 14110 standard's experimental procedures to determine the methanol concentration in the biodiesel-washing wastewater.10 The amount of CH3OH was calculated by the standard addition method: four effluent samples were diluted in water using 0.2500 g of effluent poured into a 5 mL volumetric flask and enriched with different known concentrations of methanol. The dilution factor was 20 times. Performance evaluation of spectroscopic methods The performance evaluation of the methods developed in this work was followed according to INMETRO document DOQ-CGCRE-008.24 Therefore, the performance parameters were analyzed: linearity, working range, sensitivity, limit of detection (LOD), limit of quantification (LOQ), and precision (repeatability and intermediate precision). To evaluate linearity, sensitivity, and determination of the working range, Huber's tests were applied to exclude anomalous values and residual homoscedasticity. The coefficient of determination (r2) was also determined. The LOD and LOQ were determined by the signal:noise ratio, as recommended by INMETRO,24 where successive dilutions were performed until finding the lowest concentration, the lowest property value that could be differentiated from the blank. Repeatability was evaluated by the relative standard deviation (RSD) calculated from ten repetitions performed, at three points of the analytical curve, on the same day and with the same analyst. Meanwhile, the intermediate precision was also evaluated by the RSD, but on different days and with different analysts. Statistical analyses The statistical program RStudio® version 4.1.1717 was used with the addition of collections – tidyverse, ExpDes.pt – and packages – car, chemCal, ggplot2, ggplot.multistats, and knitr, in addition to the program's basic packages. Initially, normality was evaluated by the Shapiro-Wilk method, and homogeneity of the variance of the residues by the Levene method. The simple linear regression equation was then calculated using the unweighted ordinary least squares method (MMQnP) if the data showed homogeneity of variances and the weighted ordinary least squares method (MMQP) if the data showed heteroscedasticity. The AIC index was used to define the most appropriate mathematical model for evaluating the intermediate precision between different analysts. Additionally, to evaluate the intermediate precision, the F test (ANOVA) and the t-Student test were also performed, considering the ratio of the absorbance values by the concentration of all the analyzes performed.
RESULTS AND DISCUSSION Vibrational analysis and performance evaluation of spectroscopic methods Figure 1 shows a typical absorbance spectrum of liquid methanol in the mid-infrared region. It is known that it is a region of difficult analysis due to the existence of several vibrational modes, suggesting symmetrical vibrations, asymmetrical vibrations, harmonic or combined modes of the C−H bond, and stretching of the O−H bond in the region above 2500 cm-1 and stretching of the C−O bond at ~1023 cm-1.6,25,26
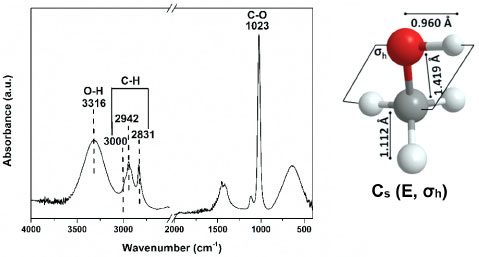 Figure 1. ATR-FTIR spectrum of methanol molecule obtained in the mid-infrared range (4000-400 cm-1). Colors of the atoms: red: O; white: H, and gray: C
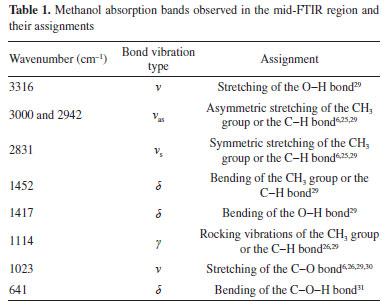
All these bonds are σ-type, none are π-type, and bond length plays an important role in vibration, for example, O−H (3316 cm-1), C−H (3000, 2942, and 2831 cm-1), and C−O (1023 cm-1) bonds have lengths of 0.960, 1.112 and 1.419 Å, respectively. Therefore, the C−O bond is the weakest because it is longer, which may explain the high absorbance intensity at ~1023 cm-1. All absorption bands in the region of 4000-400 cm-1 observed in the methanol spectrum and their attributions are listed in Table 1.
In addition, methanol has 12 normal modes of vibration, as it is a non-linear molecule with 3n-6 vibrational degrees of freedom, eight of which belong to symmetry identifiers A' and four to identifiers A". A more detailed analysis of its spectrum, takes into account the symmetry operations of the Cs point group (Figure 1), a group of low symmetry which has only two operators: identity and a horizontal reflection plane σh.27,28 Considering their character table, the identifiers A' and A" give rise to a variation in the molecular dipole moment and are therefore active in the infrared. Finally, studies have also shown that with the twisting movement of the methyl group in the H−O−C−H plane, the internal movement is characterized by the G12 extended point group (composed of C3v and CS), where the C3v (E, 2C3, 3σv) and CS (E, σh) symmetry characterize the CH3 and COH structures, respectively.27 In the present study, the FTIR coupled to an ATR cell, in absorbance mode, was used to validate the analytical curve prepared at different concentrations considering the protocol determined by INMETRO.24 Therefore, the band related to the vibrations of the C−O bond at 1016 cm-1 was analyzed (Figures 2(a) and 2(b)), because with the preparation of the standard solutions there was a slight shift compared to the band of pure methanol (Figure 1). It suggests that this shift was due to possible intermolecular interactions with water. In other studies,32 using methanol vapor, this C−O stretch band was quantified at 1034 cm-1.
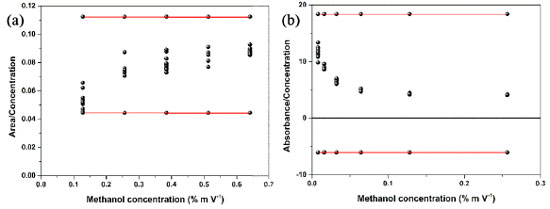 Figure 2. Residue scatter plot by Huber's regression test to evaluate the linearity of the methods (a) ATR-FTIR and (b) UV-Vis
Initially, the absence of outliers for each concentration was verified by the Huber regression test,33 in which a good performance of the models was obtained, that is, points markedly different from the samples were not detected in the methods of this study (Figures 2(a) and 2(b)) and we observed in the graphs of Figures 1S(a) and 1S(b) (supplementary material) that the normality of the residuals was satisfied. The Huber test and the homoscedasticity of the residues indicated the linearity and sensitivity of the methods applied in ATR-FTIR and UV-Vis. Preliminarily, for the construction of the analytical curve, nine points were prepared corresponding to 70 dilutions of the standard solutions, alternating between ten and five repetitions per point. However, as the ATR-FTIR could not read the samples of lower concentrations (0.008, 0.016, and 0.032% m V-1), the analytical curve was constructed with five points that corresponded to 40 dilutions of concentrations that varied from 0.128 to 0.641% m V-1 (Figures 3(a-c)). Given this limitation, based on the signal:noise ratio, the lowest methanol concentration that could be reliably detected was 0.064% m V-1, considered the LOD, and 0.128% m V-1 the LOQ (Table 2).
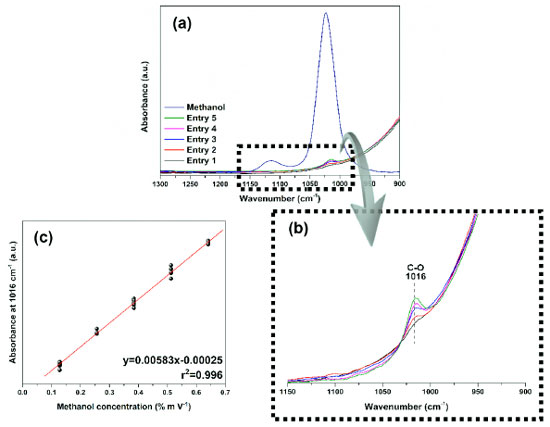 Figure 3. Graphs of dilutions of standard methanol solutions: (a) and (b) spectra obtained by ATR-FTIR of pure methanol and its solutions at different concentrations: 0.128, 0.256, 0.384, 0.512, and 0.641% m V-1 of entries from 1 to 5, respectively; (c) analytical curve by ATR-FTIR of absorbance as a function of concentration with r2 > 0.99
Likewise, the analytical curve of the UV-Vis analysis was initially prepared with nine points and 70 dilutions. However, unlike the FTIR, the samples of higher concentrations (0.384, 0.513, and 0.641% m V-1) were not used due to the maximum absorbance limit of the solution. Generating, then, a curve with six points of concentrations in the range of 0.256-0.008% m V-1 (Figure 4(b)) and LOD and LOQ of 0.005 and 0.008% m V-1, respectively (Table 2). After the methanol oxidation process, the samples were revealed with colors that started from a scale from golden yellow to dark green (Figure 4(c)). As shown in Equation 1, it is suggested that methanol was wholly oxidized to CO2 and H2O in the presence of K2Cr2O7 under a strongly acidic medium,34 at the same time that Cr6+ (golden yellow) was reduced to Cr3+ (dark green). It is also believed that this reduction may pass through an intermediate state of Cr4+ due to the reddish-brown coloration.34 The intensity of the color read at 600 nm was proportional to the concentration of methanol in each sample. Furthermore, the LOD and LOQ values for both methods were considered adequate since there are no limits established in Brazilian legislation for the presence of methanol in wastewater, and, comparatively, the maximum concentration of methanol to be limited in biodiesel is 0.20% m/m.9 
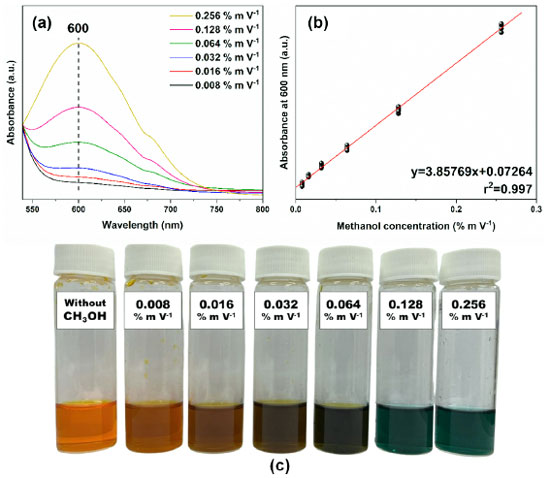 Figure 4. Graphs of dilutions of standard methanol solutions: (a) spectra obtained by UV-Vis of methanol solutions at different concentrations: 0.008, 0.016, 0.032, 0.064, 0.128, and 0.256% m V-1; (b) analytical UV-Vis curve of absorbance as a function of concentration with r2 > 0.99; (c) color change of the analyzed samples in the UV-Vis as the concentration increases from 0.008-0.256% m V-1
Before the linear regression, the upper limit of the working range was verified. In view of the data obtained by UV-Vis, presented in Table 1S (supplementary material), it was noticed that there was a gradual increase in absorbance as the concentration of the methanol solution also increased. This behavior was reported by Yuan et al.,35 in the detection of carbonyl compounds in aqueous media by UV-Vis. Furthermore, analyzing the graph in Figure 5, it became evident that the method developed in UV-Vis has an upper limit in its working range, and it is not possible to carry out measurements from 0.384% m V-1. In turn, the upper limit was not evaluated in ATR-FTIR, as this method, as experimentally verified, has limitations only in very dilute solutions.
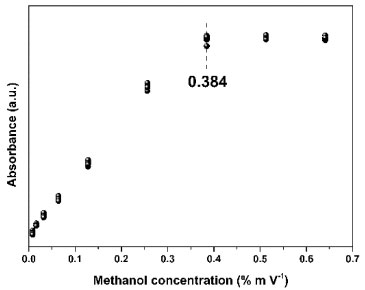 Figure 5. Graph of the upper limit of the working range for the UV-Vis method
In the ATR-FTIR and UV-Vis methods, when the concentration of the methanol solution was taken as the value of x, the band area was taken as the value of y, and linear equations were obtained after establishing the analytical curves and completing the linear regression analysis as follows: y = 0.0058x − 0.0002 (for the ATR-FTIR) and y = 3.858x + 0.072 (for the UV-Vis), with r2 > 0.99 for the both methods (Table 2). The relative standard deviation (RSD) values were less than 12% and the performance parameters of the analytical curves are in accordance with INMETRO24 recommendations. Compared with other methods reported in the literature for the determination of methanol,7,36 our spectroscopic methods do not require complicated sample preparation steps, especially by ATR-FTIR which by direct analysis it is possible to obtain quantitative results of methanol in a wide concentration range. Therefore, these methods can quickly and sensitively detect and quantify methanol in solution by FTIR and UV-Vis. In addition to the data presented, the ability of the spectroscopic methods developed in this study to provide the same results, with the analyzes carried out in the same laboratory, on different days, under the same experimental conditions previously described and by a second analyst, are presented in Figures 2S(a) and 2S(b) (supplementary material) and in Table 3. The working range, LOD and LOQ remained the same compared to the first analyst's data (Table 2). In addition, when compared with the first analyst, in the ATR-FTIR and UV-Vis methods, the linear regression analysis determined a small variation in the angular and linear coefficients of 0.00049 and 0.00003 for the ATR-FTIR and 0.130 and 0.004 for the UV-Vis, respectively.
Thus, when comparing the results of analyzes carried out on different days and by different analysts, a significant difference was noted in the results obtained. The AIC parameters of the analytical curve for analysts 1 and 2 were –389.42 and –393.38 (in the ATR-FTIR method) and –245.63 and –166.57 (in the UV-Vis method), respectively. It was also possible to confirm that there was a difference between the analysts by the F test (ANOVA) and Student's t-test with a p-value < 0.05. Despite the differences, we do not rule out the possibility that the intermediate precision was influenced in the preparation stage of the working solutions, being classified as an operational error,37 not depending on the analytical instruments used, since an analyst is a student involved in a graduate course, and the other is in a scientific initiation fellow. However, based on the other performance results presented in this work, such as, for example, linearity, working range, sensitivity, LOD, and LOQ, the proposed spectroscopic methods can be used routinely for the analysis of methanol in aqueous solution. Application in real industrial effluent To optimize the responses of the spectroscopic methods developed in this work, four samples were prepared considering four different dilutions of the effluent received to quantify methanol concentration values, not extrapolating the analytical curves shown in Figures 3(c) and 4(b). Dilutions occurred in triplicate, and 5 mL volumetric flasks with 1.0000 g (point 1), 0.5000 g (point 2), 0.2500 g (point 3), and 0.1250 g (point 4) of effluent and deionized water. The mid-infrared spectra showed differences in the intensity of the absorbance of the undiluted effluent and the dilutions corresponding to the mass amounts of the effluent quantified in 1016 cm-1 (Figure 6(a)). In the same way, Figure 6(b) shows the differences in the intensity of the absorbance of the spectra in the visible region and a limiting response of the absorbance in the dilutions above 0.5000 g of effluent. Figure 6(c) shows the color of the dilutions before being analyzed in UV-Vis equivalent to the mass quantities of effluent. Finally, Figure 6(d) shows the graph of concentrations as a function of effluent dilutions for both methods. We observed that the concentrations obtained from the height values corresponding to points 2 (0.330% m V-1), 3 (0.146% m V-1), and 4 dilutions (0.106% m V-1) in the ATR-FTIR and from the absorbance values at points 3 (0.227% m V-1) and 4 dilutions (0.110% m V-1) in the UV-Vis are within the detection and quantification limits of the respective analytical curves. Both methods demonstrated efficiency in measuring methanol concentrations in diluted solutions of real effluents. However, unlike the ATR-FTIR, the UV-Vis presented a limitation when quantifying solutions with high concentrations of methanol, as evidenced by the linearity of points 1 and 2, corroborating the upper limit data of the working range (Figure 5).
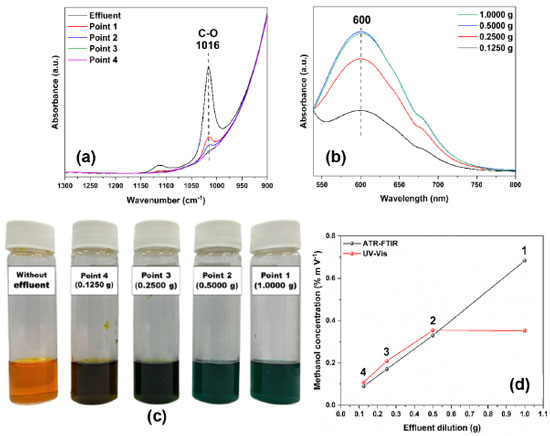 Figure 6. (a) Spectra obtained by ATR-FTIR of wastewater from biodiesel-washing and of diluted solutions of 1.0000 g (point 1), 0.5000 g (point 2), 0.2500 g (point 3), and 0.1250 g (point 4) of the effluent in aqueous solution; (b) spectra obtained by UV-Vis of effluent samples at different dilutions in aqueous solution; (c) color change of the samples analyzed in the UV-Vis according to the increase in the amount of effluent in mass at each dilution; (d) graph of methanol concentration as a function of effluent dilution obtained by ATR-FTIR and UV-Vis
The normalized results of effluent methanol concentration obtained by ATR-FTIR (3.415% m V-1) and UV-Vis (4.181% m V-1) were calculated by Equation 2 and compared with the result of chromatography, which followed the BS EN 14110 standard.10 Considering the data of the analytical curve acquired by GC-FID (Figure 3S) by the method of addition of the standard of the samples diluted to 0.2500 g of effluent and enriched with different known concentrations of methanol, the result of the final concentration of methanol was 3.400% m V-1. Given these results, the ATR-FTIR method obtained greater accuracy and proved to be more adequate to quantify methanol in wastewater from biodiesel-washing, with a relative error of 0.4%, than the UV-Vis method, which obtained a relative error of 22.9%, compared to GC-FID.  In Equation 2, LC and AC are the linear and angular coefficients of the analytical curve equation, respectively, and 20 is the dilution factor of the effluent samples. For more excellent reliability of the methanol concentration obtained and the applicability of the ATR-FTIR method, ethanol, methanol, and glycerin standards were added to pure effluent samples, as shown in Figure 4S (supplementary material). In Figure 4S(a), it was possible to notice different wavenumbers of the bands present in the pure effluent (1016 cm-1, referring to the C−O bond of the methanol molecule present in the effluent) and in the ethanol standard (1044 cm-1). In the effluent/ethanol mixture, the band referring to the addition of ethanol appears at 1044 cm-1, and it is observed that there was no interference of ethanol in the effluent since there was no increase in intensity or displacement of the band at 1016 cm-1. Differently, when adding the methanol standard to the effluent, there is an increase in the intensity of 1016 cm-1. The same behavior could be observed with the addition of the glycerin standard in the effluent, where an intense band appeared at 1041 cm-1, and there was no change in the band at 1016 cm-1 (Figure 4S(b) in the supplementary material). Then, an additional calibration was performed following the standard addition method. Another analytical curve was constructed from known concentrations of methanol (1.250 to 10.000% m V-1) added to 1.0000 g of each pure effluent sample and in triplicate (Figure 7). An equation described the model, and methanol concentration was determined by extrapolating the analytical curve to the x-axis (concentration of added methanol). The final methanol concentration was 3.442% m V-1, obtained by dividing the linear coefficient by the angular coefficient.7
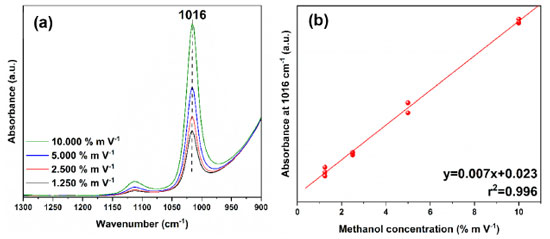 Figure 7. (a) spectra obtained by ATR-FTIR of the biodiesel-washing wastewater with the addition of methanol standard in the different concentrations 1.250, 2.500, 5.000, and 10.000% m V-1; (b) graph of the analytical curve obtained by ATR-FTIR
Finally, the residual water from the biodiesel wash received for this study was visually heterogeneous and of slightly whitish in color. It presented oil droplets which justified its characteristic odor, moderately acidic pH equal to 4.4, and high concentration of methanol (> 3.000% m V-1). These physical-chemical characteristics may suggest serious environmental risks, as the pH is outside the allowed limit in Brazil, which is between 5 and 9, according to Resolution nº 430 of 2011 of the National Council for the Environment (CONAMA, Brazil). Furthermore, considering this resolution, there are no parameters for the concentration of methanol allowed for wastewater discharges originating from industries in water bodies. According to Daud et al.,38 these characteristics contribute to high values of chemical demand for oxygen, oil and grease and can disturb the biological activity in sewage treatment. That said, the failure in the current Brazilian legislation leads to a lack of protection of water resources and accountability of polluting agents, making environmental conditions unfavorable to aquatic life, as well as bringing risks to human health due to effluents with a high content of methanol released, for the most part, directly in water bodies. In addition to polluting water resources, we must remember that methanol can evaporate in effluent treatment ponds, also becoming a potential atmospheric contaminant. Finally, it is worth mentioning that the industry that donated the wastewater performs fractional distillation of it in the biodiesel production process for methanol recovery, however, this practice is neither common nor mandatory in Brazilian legislation. This leads us to believe that methanol concentrations in other industries may be higher than what we found in our work.
CONCLUSIONS Performance parameters such as linearity, working range, sensitivity, LOD, LOQ, and precision were efficiently determined to evaluate the methods developed in the methanol analysis from the spectral data of FTIR by ATR and absorbance by UV-Vis. Both spectroscopic techniques showed, mainly, linearity, sensitivity, repeatability, and intermediate precision in a wide working range with good predictive capacity for identification and quantification of methanol in aqueous solution. The results showed that, despite the low LOD and LOQ values of UV-Vis, it still needs sample preparation, while the ATR-FTIR analyses are straightforward. Furthermore, UV-Vis could not quantify concentrations > 0.209% m V-1 of methanol in industrial effluent solutions obtained from the biodiesel-washing wastewater and had low accuracy. For this reason, the mid-FTIR region spectroscopy method developed here may be more interesting for use in biodiesel production industries, adaptable in research laboratories, and offers advantages over classical methods of analysis in the determination of quality standards, such as, for example, it is a direct analysis, without sample preparation, without the use of solvents, economically viable and carried out in a maximum time of 30 seconds per sample.
ACKNOWLEDGEMENTS This work was supported by the Brazilian Federal Agency for the Improvement of Higher Education (CAPES), the Mato Grosso Research Foundation (FAPEMAT) and the Federal Institute of Mato Grosso (IFMT). T. G. S. acknowledge CAPES for postdoc research fellow (88887.612485/2021-00 and 88887.683573/2021-00). F. G. C., R. S. R. S. and D. A. S. express their appreciation for fellowships granted by FAPEMAT, FAPEMAT/IFMT and PROPES/IFMT (45331.668.31485.17062021, 0300/2021 and 50/2021, respectively). For their contributions, the authors thank the Prof. Ailton Terezo (GENMAT/UFMT), Prof. Edgar Nascimento (GResCo/IFMT), Prof. Simoni Meneghetti (GCaR/UFAL) and PPGQTA/IFMT.
REFERENCES 1. Boretti, A.; Rosa, L.; npj Clean Water 2019, 2, 1. [Crossref] 2. Vicente, G.; Martínez, M.; Aracil, J.; Bioresour. Technol. 2004, 92, 297. [Crossref] 3. Palomino-Romero, J. A.; Leite, O. M.; Barrios Eguiluz, K. I.; Salazar-Banda, G. R.; Silva, D. P.; Cavalcanti, E. B.; Quim. Nova 2012, 35, 367. [Crossref] 4. Atadashi, I. M.; Aroua, M. K.; Aziz, A. A.; Renewable Energy 2011, 36, 437. [Crossref] 5. Chavalparit, O.; Ongwandee, M.; J. Environ. Sci. 2009, 21, 1491. [Crossref] 6. Harrison, J. J.; Allen, N. D. C.; Bernath, P. F.; J. Quant. Spectrosc. Radiat. Transfer 2012, 113, 2189. [Crossref] 7. Shimamoto, G. G.; Tubino, M.; Fuel 2016, 175, 99. [Crossref] 8. Nekoukar, Z.; Zakariaei, Z.; Taghizadeh, F.; Musavi, F.; Banimostafavi, E. S.; Sharifpour, A.; Ebrahim Ghuchi, N.; Fakhar, M.; Tabaripour, R.; Safanavaei, S.; Ann. Med. Surg. 2021, 66, 102445. [Crossref] 9. Associação Brasileira de Normas Técnicas (ABNT); NBR 15343: Biodiesel - Determination of Methanol or/and Ethanol Concentrations in Fatty Acid Esters by Gas Chromatography, 2012. [Link] accessed in March 2023 10. European Standards; BS EN 14110: Fat and Oil Derivatives. Fatty Acid Methyl Esters. Determination of Methanol Content, 2019. [Link] accessed in March 2023 11. Felizardo, P.; Baptista, P.; Menezes, J. C.; Correia, M. J. N.; Anal. Chim. Acta 2007, 595, 107. [Crossref] 12. Araujo, A. R. T. S.; Saraiva, M. L. M. F. S.; Lima, J. L. F. C.; Korn, M. G. A.; Anal. Chim. Acta 2008, 613, 177. [Crossref] 13. Boog, J. H. F.; Silveira, E. L. C.; de Caland, L. B.; Tubino, M.; Fuel 2011, 90, 905. [Crossref] 14. Shishov, A.; Penkova, A.; Zabrodin, A.; Nikolaev, K.; Dmitrenko, M.; Ermakov, S.; Bulatov, A.; Talanta 2016, 148, 666. [Crossref] 15. Wirasuta, I. M. A. G.; Dewi, N. K. S. M.; Purwaningsih, N. K. P. A.; Heltyani, W. E.; Aryani, N. L. P. I.; Sari, N. M. K.; Sari, P. M. N. A.; Ramona, Y.; Forensic Chem. 2019, 16, 100190. [Crossref] 16. Soares, S.; Rocha, F. R. P.; Talanta 2019, 199, 285. [Crossref] 17. Poornapushpakala, S.; Dawn, S. S.; Arun Govind, M.; Santhosh, A.; Nirmala, N.; Barani, S.; Nirmala, M.; Biocatal. Agric. Biotechnol. 2021, 31, 101874. [Crossref] 18. De Gisi, S.; Galasso, M.; De Feo, G.; Environ. Technol. 2013, 34, 861. [Crossref] 19. Soares, S.; Lima, M. J. A.; Rocha, F. R. P.; Microchem. J. 2017, 133, 195. [Crossref] 20. Ribeiro, M. S.; Rocha, F. R. P.; Microchem. J. 2013, 106, 23. [Crossref] 21. Pereira, A. C.; Reis, B. F.; Rocha, F. R. P.; Talanta 2015, 131, 21. [Crossref] 22. Batista, A. D.; Amais, R. S.; Rocha, F. R. P.; Microchem. J. 2016, 124, 55. [Crossref] 23. Lima, M. B.; Insausti, M.; Domini, C. E.; Pistonesi, M. F.; de Araújo, M. C. U.; Fernández Band, B. S.; Talanta 2012, 89, 21. [Crossref] 24. INMETRO; DOQ-CGCRE-008: Orientação sobre Validação de Métodos Analíticos, 2020. [Link] accessed in March 2023 25. Yu, Y.; Wang, Y.; Lin, K.; Hu, N.; Zhou, X.; Liu, S.; J. Phys. Chem. A 2013, 117, 4377. [Crossref] 26. Mukhopadhyay, I.; Infrared Phys. Technol. 2016, 77, 203. [Crossref] 27. Burenin, A. V.; Opt. Spectrosc. 2006, 100, 483. [Crossref] 28. Pearson, J. C.; Yu, S.; Drouin, B. J.; J. Mol. Spectrosc. 2012, 280, 119. [Crossref] 29. Bulgarevich, D. S.; Horikawa, Y.; Sako, T.; J. Supercrit. Fluids 2008, 46, 206. [Crossref] 30. Ding, Y.; Strand, C. L.; Hanson, R. K.; J. Quant. Spectrosc. Radiat. Transfer 2019, 224, 396. [Crossref] 31. Banik, S.; Melanthota, S. K.; Vannathan, A. A.; Mahato, K. K.; Mal, S. S.; Mazumder, N.; Chem. Pap. 2022, 76, 4907. [Crossref] 32. Bangalore, A. S.; Small, G. W.; Combs, R. J.; Knapp, R. B.; Kroutil, R. T.; Anal. Chim. Acta 1994, 297, 387. [Crossref] 33. Fernández, Á.; Bella, J.; Dorronsoro, J. R.; Neurocomputing 2022, 486, 77. [Crossref] 34. Rao, G.; Talanta 1966, 13, 1473. [Crossref] 35. Yuan, C.; Pu, J.; Fu, D.; Min, Y.; Wang, L.; Liu, J.; J. Hazard. Mater. 2022, 438, 129457. [Crossref] 36. Park, D. S.; Won, M. S.; Goyal, R. N.; Shim, Y. B.; Sens. Actuators, B 2012, 174, 45. [Crossref] 37. Andrade, J. C.; Quim. Nova 1987, 10, 159. [Link] accessed in March 2023 38. Daud, N. M.; Sheikh Abdullah, S. R.; Abu Hasan, H.; Yaakob, Z.; Process Saf. Environ. Prot. 2015, 94, 487. [Crossref] |
On-line version ISSN 1678-7064 Printed version ISSN 0100-4042
Qu�mica Nova
Publica��es da Sociedade Brasileira de Qu�mica
Caixa Postal: 26037
05513-970 S�o Paulo - SP
Tel/Fax: +55.11.3032.2299/+55.11.3814.3602
Free access


