Artigo
| Facile fabrication of aniline sensor by using commercial calcium silicate hydrate nanosheets as sensing material |
|
Luyu WangI,*; Jia SongII,*; Chunyang YuIII
I. College of Artificial Intelligence and E-Commerce, Zhejiang Gongshang University Hangzhou College of Commerce, 311599 Hangzhou, China Recebido em: 19/05/2023 Various aniline sensing materials have excellent properties based on quartz crystal microbalance (QCM) transducer, but their synthesis processes are complex. Herein, commercial calcium silicate hydrate nanosheets (CSH-S) was utilized for facile fabrication of aniline sensor based on QCM platform. This sensor was capable of detecting 0.1 ppm aniline, and the response time (14 s) and recovery time (16 s) were short. Besides, the devices could restore sensitivity after 30 days, demonstrating excellent stability. In addition, variable temperature experiment combined with simulation calculation methods were carried out to study the adsorption of aniline on CSH-S surfaces, then the sensing mechanism was revealed. This work opens up a rapid and convenient method for detecting gaseous aniline. INTRODUCTION Aniline is one of the most important amine substances, mainly used in the manufacture of dyes, drugs, resins, and can also be used as a rubber vulcanization accelerator.1 According to the list of carcinogens published by the World Health Organization's International Agency for Research on Cancer, aniline is on the list of carcinogens.2 Real-time sensing of gaseous aniline has recently attracted attention, especially for chemosensitized sensors. The current method used for detecting aniline is fluorescence sensing, which includes o-carborane modified pyromellitic diimide derivative, Eu@UiO-66(COOH), and others.3,4 Another widely used method is semiconductor sensing, such as ZnO-TiC, Ce doped ZnO, etc.1,5 Based on quartz crystal microbalance (QCM), a low power mass-sensitive platform,6 several aniline sensing sensors have also emerged. The pristine QCM has some disadvantages, such as limited sensitivity, sensitivity to environmental interference, frequency drift, and mass loading effects. To optimize these issues, it is common practice to modify the QCM surface with sensing materials.7 The working principle of this type of sensors is mainly based on the mass change caused by the adsorption of target gas by the sensitizing material on the QCM surface, and the mass change is converted into a frequency change through the Sauerbrey equation, and then output as an electrical signal.8 The Sauerbery equation is expressed as Equation 1:9  where f is the basic resonance frequency, A is the working area of the electrode, the frequency shift (ΔF) depends on the mass change (Δm). The QCM based sensitizing materials for detecting aniline are mainly concentrated in metal-organic frameworks (MOFs),10,11 amino polymer materials,12 etc. However, it is complex to synthesize the above materials in large quantities and ensure their quality. Therefore, it has broad market prospects and time saving significance to find some commercial materials and design them into high-performance aniline sensors facilely. Carbide slag is the by-product of the hydrolysis of calcium carbide to produce acetylene, and its main component is calcium hydroxide, which is strongly alkaline.13 Currently, carbide slag is mainly used for flue gas treatment, CO2 capture, or as a chemical additive.14 Recently, calcium silicate hydrate (CSH) nanomaterials can be developed using calcium carbide slag as a raw material for applications such as heavy metals recovery.15 Here, a calcium silicate hydrate nanosheets (CSH-S) acquired commercially has been utilized to facile fabrication of sensor aiming at detect gaseous aniline based on QCM platform, as shown in Figure 1. The sensing performance parameters of this sensor are excellent, including sensitivity, selectivity, stability, etc. The sensing mechanism between CSH-S and aniline was analyzed by means of variable temperature experiment and simulation calculation. This work provides a potential way for rapid design of aniline sensors.
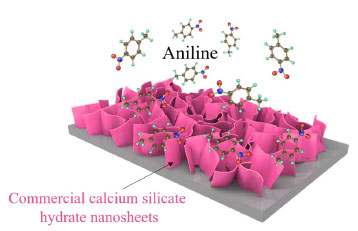 Figure 1. Scheme of the experiment designed
EXPERIMENTAL Materials and sensor fabrication process A high-purity (99%) calcium silicate hydrate nanosheets (CSH-S) sample was purchased from Nanjing XFNano Material Tech Co., Ltd. Its raw material is carbide slag. The absolute water dispersion of the CSH-S after ultrasonic processing was drop-casted on QCM chip, and the as-fabricated sensor chip was dried in an infrared box for evaporating of water. QCM chip coated with silver electrodes was purchased from Chengdu Westarace Electronic Co., China. The fundamental frequency of all QCM resonators was 107 Hz (AT-cut). Characterization The characterization instruments and methods of the material are displayed in Supplementary Material. Deposition of CSH-S on QCM surface The QCM for the construction of NQHSs was composed of an AT-cut quartz crystal with a fundamental frequency of 107 Hz and one silver electrode (diameter, 4 mm) on each side. The dried CSH-S was dispersed uniformly into water by ultrasonication to form a slurry with a mass concentration of 0.01%. About 100 µL of the filtrate was dropped on the QCM surface with a pipette gun and allowed to dry. The frequency shift of the QCMs coated with CSH-S were measured to be 4817 Hz. Test method of QCM sensor According to Sauerbrey equation (ΔF = -2.2 × 10⁻⁶ × f2 × Δm/A), the frequency shift of QCM resonator (ΔF) is proportionate with the increased mass on silver electrode (Δm). As shown in Figure 1S (supplementary material), QCM chip was vertically suspended inside a sealed chamber with gas inlet/outlet. The air (15 sccm) generated by an air generator was used as the carrier gas. Because the evaporation point of aniline is relatively high, a heater is indispensable. All tests were conducted at ambient temperature and relative humidity (RH) of 60%. Two running fans can accelerate the dispersion of gaseous aniline homogeneously. As a typical process, QCM sensor was flushed with air until a steady fundamental frequency was obtained. Then, the liquid aniline analyte with calculated volume was introduced to the chamber by a microliter syringe. The exact volume of the injected aniline analyte liquid was concretely calculated in µL based on the Equation 2:  where Vl represents the volume of liquid in µL, c is the liquid concentration in ppm, M represents the molecular weight, d is the liquid density, and p represents the degree of purity. Then, following the sensing test, a frequency shift to analyte would be obtained after a period of time. The frequency shift was living measured by a digital controller and recorded by a desktop computer. At the end of each testing cycle, continuous air would wash away the analyte to re-establish the fundamental frequency. In order to further understand the sensing mechanism, the concentration dependent gas sensing experiments in two different temperatures (298 and 313 K) were carried out in order to obtain the value of ΔH via employing the Clausius-Clapeyron equation. Gaussian calculations Based on the previous literature,16 we explored the sensing mechanism by means of simulation calculation. We utilized Gaussian 09 software with a DFT method and the hybrid B3LYP functional and 6-311++G(d,p) basis set to optimize the geometries of the molecules and frequency. The optimized structures were confirmed to be minima on the potential energy surface via vibration frequency analysis. To verify which group plays a key role in aniline detection, the interaction energies between aniline molecule and the multiple functional groups of sensing material were calculated according to the following Equation 3. The sensing material will be named S: 
RESULTS AND DISCUSSION Materials characterization FTIR spectra of CSH-S sample is presented in Figure 2. The CSH-S exhibited an obvious adsorption peak around 971 cm-1, corresponding to the antisymmetric stretching vibration of Si-O-Si. Similarly, a bending vibration peak of Si-O-Si appeared around 458 cm-1. The above two peaks demonstrated that the CSH-S possessed a Si-O tetrahedron structure. Besides, the CSH-S exhibited a peak of Ca-O around 1441 cm-1. Furthermore, The CSH-S showed obvious vibration peaks at 1634 and 3457 cm-1. These two peaks are reflections of hydroxyl groups, indicating that there were two linkage types of hydroxyl groups in CSH-S: Ca-OH and Si-OH.17 The XRD pattern (Figure 2S, supplementary material) shows the low crystallinity of the CSH-S sample. Besides, the consistency between the position of the characteristic peaks of CSH-S sample and the previous literature on CSH indicates the successful synthesis of calcium silicate hydrate.18
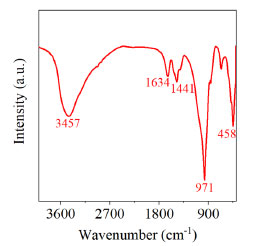 Figure 2. FTIR spectra of fresh CSH-S
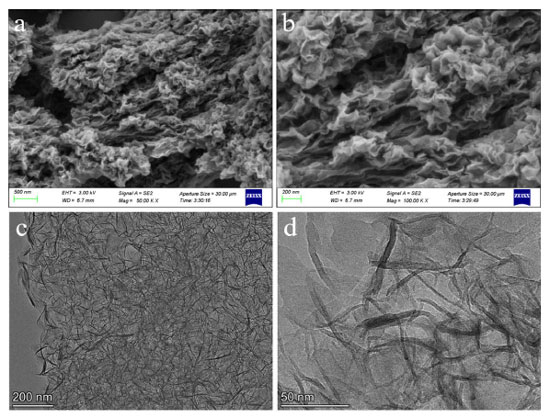
The morphology and microstructure of CSH-S were observed, and the representative results are shown in Figure 3. Figures 3a and 3b are FESEM images with different magnifications, and Figures 3c and 3d are HRTEM images with different magnifications. It is obvious that the CSH-S powder has a stacked nanosheet structure, and its small size is of great significance for gas adsorption and other applications.19,20
Gas-sensing properties The results of utilizing QCM as an aniline sensor in recent years are presented in Table 1. The table demonstrates that scientists have identified various MOFs and polymers, which were transformed into sensing materials. These materials were then coated onto QCM for aniline detecting. Here, commercial calcium silicate hydrate nanosheets was used to make sensing material selective to aniline vapor. Figure 4a depicts the dynamic frequency shift result of CSH-S coated QCM sensor when exposed to 0.1-2 ppm gaseous aniline. It can be observed that with the increase of gaseous aniline concentration gradient, the frequency shift of the prepared CSH-S coated QCM sensor shows an upward trend. The frequency shift to concentrations of 0.1, 0.25, 0.5, 1 and 2 ppm were -14.7, -27.4, -43.5, -76.3 and -132.2 Hz, respectively. The fitting function of the frequency shift (y) and aniline concentration (x) of the CSH-S coated QCM sensor is depicted in Figure 4b. The fitting function can be expressed as y = -61.2 x -11.7 for the CSH-S coated QCM sensor. And the fitting coefficients (R2) was 0.9970.
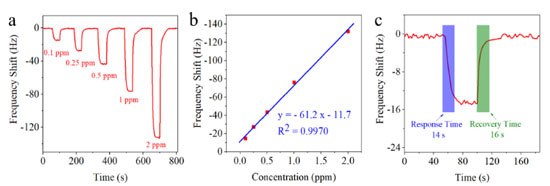 Figure 4. (a) Dynamic frequency shift curve of CSH-S coated QCM sensor when exposed to gaseous aniline; (b) fitting curve of CSH-S coated QCM sensor with different gaseous aniline concentrations; (c) response/recovery time of CSH-S coated QCM sensor to 0.1 ppm gaseous aniline
We then calculated the limit of detection (LOD) and the limit of quantification (LOQ) of the CSH-S coated QCM sensor. The LOD and the LOQ were calculated using the Equations 4 and 5, respectively:21 where, σ represents the standard deviation of the blank signal, and S represents the slope of the calibration curve. Using the above two formulas, the theoretical LOD was 0.0215 ppm, and the theoretical LOQ was 0.0652 ppm, respectively. Fast response/recovery time is an important indicator to evaluate gas sensors.22Figure 4c shows the response and recovery curve of CSH-S coated QCM sensor to 0.1 ppm gaseous aniline. The response/recovery time of CSH-S coated QCM sensor to gaseous aniline was calculated to be about 14 s/16 s, indicating the excellent response/recovery speed. Figure 5a presents the repeatability of CSH-S coated QCM sensor to various concentrations of gaseous aniline. The CSH-S coated QCM sensor was sequentially exposed to 0.1 ppm, and was recovered after each cycle. The three continuous frequency shift curves to the same gaseous aniline concentration are almost the same, indicating that CSH-S coated QCM sensor has excellent repeatability. Besides, to explore the long-term stability, we tested the frequency shift of CSH-S coated QCM sensor to gaseous aniline of 0.1, 0.25, 0.5, 1 and 2 ppm within one month, as shown in Figure 5b. The frequency shift of CSH-S coated QCM sensor to gaseous aniline did not fluctuate significantly over one month, which confirmed favorable long-term stability.
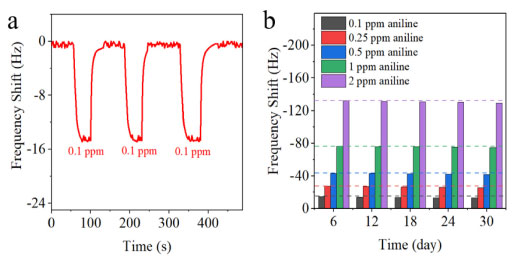 Figure 5. (a) Repeatability of the CSH-S coated QCM sensor exposed to gaseous aniline at 0.1 ppm; (b) long-term stability of CSH-S coated QCM sensor to gaseous aniline
The selectivity of CSH-S coated QCM sensor was evaluated by exposure to 0.5 ppm of six kinds of interference gases at 298 K, including CO, NO2, NH3, H2, O2, and HCHO, as shown in Figure 6a. The frequency shift of this sensor to gaseous aniline is obviously higher than other interference gases. In addition, we tested the frequency shift of the CSH-S coated QCM sensor to a mixed gas containing 0.5 ppm aniline and the above interference gases, as shown in Figure 3S. The sensor's frequency shift to 0.5 ppm aniline showed no significant variations. We also conducted tests on three common aniline derivative compounds, namely N,N-diethylaniline, N,N-diphenylaniline, and N,N-dimethylaniline. The concentrations of these three vapors were all set at 0.5 ppm. As shown in Figure 4S, the CSH-S coated QCM sensor response to 0.5 ppm aniline was significantly higher compared to the vapors of the three derivatives.
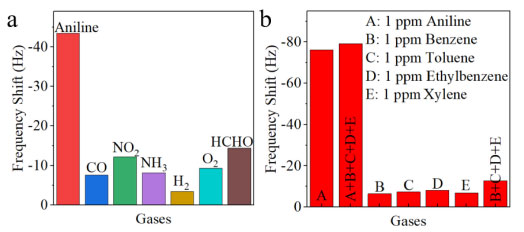 Figure 6. (a) Selective tests of CSH-S coated QCM sensor to 0.5 ppm of various detected gases at 298 K; (b) the comparison of frequency shift of CSH-S coated QCM sensor to five kinds of vapor (the concentration was set as 1 ppm). Frequency shift data showing the selectivity of CSH-S coated QCM sensor when exposed to gaseous aniline and interferent BTEX vapors with the concentration of 1 ppm
As shown in Figure 6b, it is nonnegligible to evaluate the anti-interference ability of BTEX vapor during the process of gaseous aniline sensing, including benzene, toluene, ethylbenzene, and xylene vapor.24 The concentration of the five gases is set at 1 ppm. The frequency shift of CSH-S coated QCM sensor to gaseous aniline, benzene vapor, toluene vapor, ethylbenzene vapor, and xylene vapor were -76.3, -6.5, -7.4, -8.1 and -6.9 Hz, respectively, indicating its selective detection ability to gaseous aniline against BTEX vapor. It should be attributed to the hydroxyl groups of CSH-S. Hydroxyl groups can interact with amino groups in aniline via hydrogen bond adsorption. Besides, the CSH-S coated QCM sensor was exposed to a gaseous aniline mixed with four interfering BTEX vapors to further assessment, including benzene, toluene, ethylbenzene, and xylene. Although the frequency shift increased (-79.1 Hz), the increase was not significant, indicating favorable selectivity against various interfering BTEX mixtures. By contrast, the frequency shift for four interfering BTEX vapors mixture (-12.8 Hz) is very small than that of aniline vapor (-76.3 Hz). These research results show that CSH-S coated QCM sensor possesses advantage of resistance to BTEX vapor. Thermodynamic study of the sensor to gaseous aniline The frequency shift of the QCM based gas sensor originates from the change of the gas mass, which is caused by the adsorption between the target gas and the sensing material.25 The adsorption enthalpy (ΔH) was extracted to determine the selectivity and reversibility of adsorption process.26Figure 7a shows the frequency shift of CSH-S coated QCM sensor to various concentrations of gaseous aniline at 298 and 313 K. The frequency shift of CSH-S coated QCM sensor declined with the increase of temperature, indicating the gaseous aniline adsorption exhibits negative Arrhenius temperature dependence. Figure 7b listed two isotherms, which express the relation between the uptake of gaseous aniline and the partial pressure of gaseous aniline at 298 and 313 K. According to Clausius-Clapeyron equation, ΔH was calculated to be -28.52 kJ mol-1 (showcased in the supplementary material). Many scientists25 report that the reversibility of sensors is satisfactory when ΔH is between 0 and -40 kJ mol-1, so the absorption sensing process of CSH-S coated QCM sensor for gaseous aniline can be considered as reversible, which is consistent with the above sensing test results.
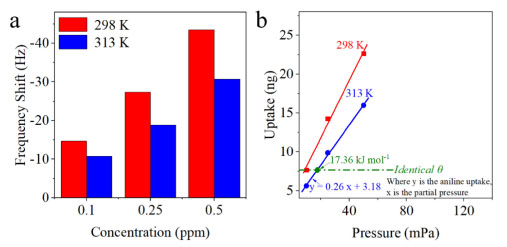 Figure 7. (a) Frequency shift of CSH-S coated QCM sensor at 298 K and 313 K to gaseous aniline with different concentrations of 0.1, 0.25 and 0.5 ppm. Based on temperature-varied micro-gravimetric curves, the plotted isotherms are used to extract the ΔH; (b) based on the experimental results of (a), two isotherms are plotted to calculate the ΔH
Exploring the interaction between sensing materials and target gas is an effective way to study the sensing mechanism.27 The hydrogen bond adsorption of hydroxyl group and amino group in aniline can promote the sensing process.10 However, there are two different hydroxyl groups in CSH-S, including Ca-OH and Si-OH,17 as shown in Figure 8. It is very hard to select experimental method to explore their roles in the gaseous aniline-sensing process, so we choose the method of simulation calculation.
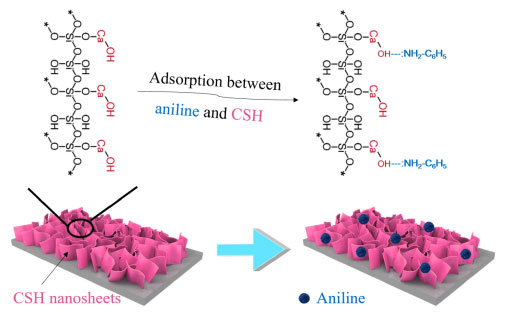 Figure 8. Schematic representation of the proposed mechanism of gaseous aniline-sensing by CSH-S
Gaussian 09 software is used to carry out the corresponding simulation calculation.28 Both hydroxyl groups in CSH-S, Ca-OH and Si-OH, can adsorb with amino group in aniline molecule. The thermodynamic parameters of the above adsorption processes were simulated. As shown in Figure 9, the enthalpy variation can be extracted as ΔH1 = -29.61 kJ mol-1 and ΔH2 = -26.37 kJ mol 1. The above two adsorption enthalpy data indicate that all two hydroxyl groups of CSH-S play a role in the sensing process, but Ca-OH is more important for detecting gaseous aniline. In addition, the Gaussian calculations also provide the entropy changes (ΔS) and Gibbs free energy changes (ΔG) for two reactions, which are as follows: ΔS1 = -17.53 J (K mol)-1, ΔS2 = -16.47 J (K mol)-1, ΔG1 = -24.38 kJ mol-1, ΔG2 = -21.46 kJ mol-1. The values of both ΔG1 and ΔG2 are less than 0 indicates that the adsorption reactions proceed spontaneously.
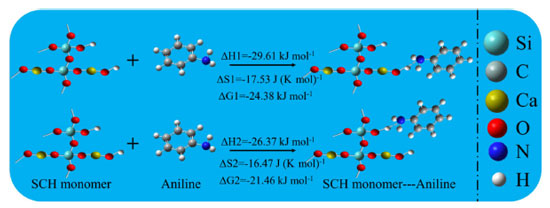 Figure 9. The Gaussian simulations of hydrogen bonding adsorption between aniline molecule and two hydroxyl groups of CSH-S
CONCLUSIONS In summary, the facile loading of commercial calcium silicate hydrate nano sheets on the QCM platform made the sensing process of gaseous aniline sensitive, selective, repeatable and stable. In addition, the sensing mechanism and thermodynamic process were explored by combining experiments and theoretical calculations. The hydroxyl groups in the silicate hydrate nanosheets play a key role in the detection of gaseous aniline. This facile constructed sensor may be a potential candidate for the commercialization of aniline detection in the future. SUPPLEMENTARY MATERIAL In supplementary material, available on http://quimicanova.sbq.org.br as a PDF file, with free access, are presented the characterization process; Clausius-Clapeyron equation; schematic of the testing system; XRD pattern; frequency shift values of the CSH-S coated QCM sensor to 0.5 ppm aniline mixed with 0.5 ppm of interference gases and, frequency shift of CSH-S coated QCM sensor to aniline vapor and three aniline derivative vapors.
ACKNOWLEDGEMENTS This research was supported by National Natural Science Foundation of China under grant No. 62001420, Zhejiang Provincial Natural Science Foundation of China under grant No. LQ21F010017, University-Industry Collaborative Education Program under grant No. 220400576262052, and Science Foundation of Zhejiang Gongshang University Hangzhou College of Commerce, Zhejiang Gongshang University, China (ZJHZCC) under grant No. 2222111.
REFERENCES 1. Zhang, Y. H.; Peng, M. X.; Yue, J. L.; Chen, J. L.; Gong, F. L.; Xie, K. F.; Fang S. M.; J. Alloys Compd. 2021, 885, 160988. [Crossref] 2. Roales, J.; Pedrosa, J. M.; Guillén, M. G.; Lopes-Costa, T.; Pinto, S. M.; Calvete, M. J.; Pereira, M. M.; Sens. Actuators, B 2015, 210, 28. [Crossref] 3. Gao, X.; Huang, R.; Fang, W.; Huang, W.; Yin, Z.; Liu, Y.; Huang, X.; Ding, L.; Peng, H.; Fang, Y.; Adv. Mater. Interfaces 2022, 9, 2201275. [Crossref] 4. Che, H.; Yan, S.; Nie, Y.; Tian, X.; Li, Y.; J. Hazard. Mater. 2022, 435, 129016. [Crossref] 5. Dong, H. D.; Zhao, J. P.; Peng, M. X.; Zhang, Y. H.; J. Mater. Sci.: Mater. Electron. 2022, 33, 458. [Crossref] 6. Chappanda, K. N.; Shekhah, O.; Yassine, O.; Patole, S. P.; Eddaoudi, M.; Salama, K. N.; Sens. Actuators, B 2018, 257, 609. [Crossref] 7. Torad, N. L.; Zhang, S.; Amer, W. A.; Ayad, M. M.; Kim, M.; Kim, J.; Ding, B.; Zhang, X.; Kimura, T.; Yamauchi, Y.; Adv. Mater. Interfaces 2019, 6, 1900849. [Crossref] 8. Liu, K.; Zhang, C.; Food Chem. 2021, 334, 127615. [Crossref] 9. Mintovak, S.; Bein, T.; Microporous Mesoporous Mater. 2001, 50, 159. [Crossref] 10. Wang, L. Y.; Wu, Y. L.; Yu, C. Y.; J. Solid State Chem. 2022, 310, 123038. [Crossref] 11. Wang, L. Y.; Wu, Y. L.; Pan, Z. P.; Yu, C. Y.; Sens. Actuators, A 2022, 333, 113296. [Crossref] 12. Kosaki, Y.; Izawa, H.; Ishihara, S.; Kawakami, K.; Sumita, M.; Tateyama, Y.; Ji, Q.; Krishnan, V.; Hishita, S.; Yamauchi, Y.; Hill, J. P.; Vinu, A.; Shiratori, S.; Ariga, K.; ACS Appl. Mater. Interfaces 2013, 5, 2930. [Crossref] 13. Cong, P.; Mei, L.; Constr. Build. Mater. 2021, 275, 122171. [Crossref] 14. Gong, X.; Zhang, T.; Zhang, J.; Wang, Z.; Liu, J.; Cao, J.; Wang, C.; Renewable Sustainable Energy Rev. 2022, 159, 112133. [Crossref] 15. Qi, F.; Zhu, G.; Zhang, Y.; Hou, X.; Li, S.; Yang, C.; Zhang J.; Li, H.; Sep. Purif. Technol. 2022, 282, 120092. [Crossref] 16. Yan, D.; Xu, P.; Xiang, Q.; Mou, H.; Xu, J.; Wen, W.; Li, X.; Zhang, Y.; J. Mater. Chem. A 2016, 4, 3487. [Crossref] 17. Fang, D.; Huang, L.; Fang, Z.; Zhang, Q.; Shen, Q.; Li, Y.; Xu, X.; Ji, F.; Chem. Eng. J. 2018, 354, 1. [Crossref] 18. Zhang, Z.; Wang, X.; Zhao, J.; Environ. Sci.: Water Res. Technol. 2019, 5, 131. [Crossref] 19. Cortés-Arriagada, D.; Villegas-Escobar, N.; Ortega, D. E.; Appl. Surf. Sci. 2018, 427, 227. [Crossref] 20. Han, C.; Han, R.; Zhang, X.; Xu, Z.; Li, W.; Yamauchi, Y.; Huang, Z.; J. Mater. Chem. A 2022, 10, 2736. [Crossref] 21. Rianjanu, A.; Triyana, K.; Nugroho, D. B.; Kusumaatmaja, A.; Roto, R.; Sens. Actuators, A 2020, 301, 111742. [Crossref] 22. Zhang, X.; Sun, J.; Tang, K.; Wang, H.; Chen, T.; Jiang, K.; Zhou, T.; Quan, H.; Guo, R.; Microsyst. Nanoeng. 2022, 8, 1. [Crossref] 23. Wang, L.; Wang, B.; Song, J.; RSC Adv. 2022, 12, 23169. [Crossref] 24. Hu, X.; Wang, C.; Luo, R.; Liu, C.; Qi, J.; Sun, X.; Shen, J.; Han, W.; Wang, L.; Li, J.; Nanoscale 2019, 11, 2805. [Crossref] 25. Zhang, D.; Fan, Y.; Li, G.; Du, W.; Li, R.; Liu, Y.; Cheng, Z.; Xu, J.; Sens. Actuators, B 2020, 302, 127187. [Crossref] 26. Xu, P.; Yu, H.; Guo, S.; Li, X.; Anal. Chem. 2014, 86, 4178. [Crossref] 27. Zhu, Y.; Zhu, Y.; Xu, J.; Chin. Chem. Lett. 2023, 34, 107391. [Crossref] 28. He, Z. H.; Gong, S. D.; Cai, S. L.; Yan, Y. L.; Chen, G.; Li, X. L.; Zheng, S. R.; Fan, J.; Zhang, W. G.; Cryst. Growth Des. 2019, 19, 3543. [Crossref] |
On-line version ISSN 1678-7064 Printed version ISSN 0100-4042
Qu�mica Nova
Publica��es da Sociedade Brasileira de Qu�mica
Caixa Postal: 26037
05513-970 S�o Paulo - SP
Tel/Fax: +55.11.3032.2299/+55.11.3814.3602
Free access


