Artigo
| Expired amoxicillin and penicillin V potassium tablets as the green corrosion inhibitor for lowcarbon steel in acetic acid solution containing chloride ions |
|
Yongshun LiangI,II; Chaojie LeiI,II; Lang XuI,II; Ya LiI,II; Ting YangI,II; Junming GuoI,II; Mingwu XiangI,II; Wei BaiI,II,*
I. National and Local Joint Engineering Research Center for Green Preparation Technology of Biobased Materials, Yunnan Minzu University, 650500 Kunming, China Received: 11/14/2023 *e-mail: bw369852147@qq.com The recycle and utilization of expired drugs is a challenge for many countries at present. The employment of expired drugs as green corrosion inhibitors is expected to address both drug recycling and corrosion prevention issues, with significant economic and environmental value. Herein, the individually and combination corrosion inhibition performance of expired amoxicillin (AMC) and penicillin V potassium tablets (PVP) for lowcarbon steel in 20% acetic acid solution containing 600 mg L-1 chloride ion are evaluated by electrochemistry and weight loss method. Both the AMC and PVP present the mixed-type corrosion inhibitors mainly affect the cathode process when used individually. The optimum inhibition efficiency is 61.22% (AMC) and 79.21% (PVP), which all appear in 5.0 × 10⁻³ mol L-1. The AMC and PVP are adsorbed on the steel surface by mixed physisorption and chemisorption, which are consistent with the Langmuir adsorption isotherm. The corrosion inhibition rate drops sharply when AMC and PVP are combined use with a close mole ratio. But a small amount of PVP significantly enhance the corrosion inhibition effect of AMC, the corrosion inhibition rate from 61.22 to 79.72%. The corrosion inhibition rate of AMC and PVP combination inhibitor decreased with the increase of temperature. INTRODUCTION With the development of society, metal materials have been applied to various aspects of human life. However, the loss of metals due to corrosion exceeds 20% of their annual production worldwide, accompanied by enormous economic losses and safety risks.1,2 It has been reported that the annual economic losses caused by corrosion in the developed countries account for about 3.5 to 4.2% of their gross national product, more than the total annual losses of the major disasters (fire, wind and earthquake, etc.).1,3 Therefore, protection against corrosion of metal materials is very important. Corrosion inhibitors have the advantages of high efficiency, low dosage, and ease of use, so they are one of the most widely used anti-corrosion methods.4,5 The evolution of medical technology and the increasing emphasis on personal health have contributed to a notable growth in medicine consumers in the past decades.6-8 However, only a small percentage of drugs can be used rationally, with the majority expiring due to the long-term placement, finally forming a large amount of pharmaceutical waste.8,9 These expired drugs bring large economic losses, potential safety hazards and terrible environmental pollution.10-14 At present, most countries have yet to establish a mature system for the recycling and utilization of expired drugs. The issues of drug recycling and disposal has attracted widespread attention from all sectors of society. It has been shown that expired drugs can be used as the green corrosion inhibitor to alleviate the corrosion of metal materials,15-17 which provides a good direction for the recycling of expired drugs with good economic benefits and environmental values. Acetic acid, an important chemical material, has been widely applied in the manufacture of drugs, pharmaceuticals, rayon, plastics, rubber and silk, also employed in acid cleaning, acid descaling, industry cleaning and oil-well cleaning.18-21 Lowcarbon steel materials are usually used as a container or cleaning object during the production, storage, and utilization of acetic acid. Some reactive anions (such as Cl-, Br-) may be introduced during the above process. Inevitably, the lowcarbon steel materials will generate serious corrosion in the acetic acid environment, and the introduction of anions will accelerate the corrosion of lowcarbon steel.20 Previous studies22,23 indicate that the 20% acetic acid solution and 600 mg L-1 chloride ions exhibit strongest corrosion for mild steel. At present, the corrosion inhibition of lowcarbon steel by expired amoxicillin (AMC) and penicillin V potassium tablets (PVP) in chloride ion containing acetic acid media have rarely been reported. Therefore, in this study, the corrosion inhibition effect of expired AMC and PVP on mild steel in 20% acetic acid (HAc) solution containing 600 mg L-1 chloride ions, individually and in combination, are investigated by electrochemical and weight loss methods to provide a reference for the recycling of expired drugs and corrosion inhibition of mild steel.
EXPERIMENTAL Materials and preparation The lowcarbon steel sheet with the composition of (C 0.07%, Si 0.01%, Mn 0.3%, P 0.022%, S 0.01%, Al 0.03%) was used as a corrosion object. Both amoxicillin capsules (Shandong Lukang Pharmaceutical Co., Ltd., China) and penicillin V potassium tablets (Southwest Pharmaceutical Co., Ltd., China) were expired in 2020, the structural formulas are shown in Figure 1. The lowcarbon steel sheet with the specification of 10 mm × 10 mm × 2 mm was polished and welded with a wire, finally sealing it in a PVC tube with AB glue to prepare the working electrode. The corrosion solution was constituted of 20% HAc solution containing 600 mg L-1 chloride ions. The AMC and PVP were dissolved in the corrosion solution to form the corrosion inhibitor with different apparent concentrations. When the AMC and PVP were used in combination (AMC + PVP), the total corrosion inhibitor molar concentration was controlled to be 1.0 × 10⁻² mol L-1, while the AMC:PVP molar ratios were 1:9, 1:4, 1:1, 4:1 and 9:1, respectively.
 Figure 1. The formulas of amoxicillin and penicillin V potassium tablet
Tests and characterization In this study, a three-electrode system with a saturated calomel electrode (type 232) as the reference electrode, a platinum electrode as the auxiliary electrode and a working electrode made of lowcarbon steel were connected to a CS350 electrochemical workstation for the electrochemical measurement. Before measurement, the working electrodes were polished brightly with 100, 600, 800 and 1000 grit sandpaper, and then degreased the polished working electrode with an acetone solution. Subsequently, the three-electrode system was soaked in the measurement solution for 2 h to stable the open circuit potential (OCP). After the OCP test, the potentiodynamic polarization (PDP) test was scanned in the range of ± 250 mV (E vs. SCE) at a scan rate of 0.5 mV s-1. Following, the electrochemical impedance spectroscopy (EIS) test was performed in the frequency range of 100 kHz to 0.01 Hz with an amplitude of 10 mV. The PDP and EIS data were fitted with Cview2 and Zview2 software, respectively. The corrosion inhibition rate (h%) is calculated by Equations 1 and 2.24 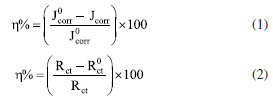 where the and Jcorr represent the current densities without and with corrosion inhibitors, and Rct are the charge transfer resistance without and with corrosion inhibitor, respectively. For weight loss measurements, three parallel pieces of 10 mm × 10 mm × 2 mm lowcarbon steel were polished with 100, 600, 800 and 1000 grit sandpaper and then washed with ethyl alcohol ultrasonic. After drying and weighing accurately, the samples were hung in the corrosion solution with different inhibitors and concentrations at 25 ºC. The ethyl alcohol ultrasonic was used to clear the lowcarbon steel sheets after the samples were immersed for 24 h. Subsequently, the samples were dried and re-weighed accurately again. The average weight loss was applied to evaluate the corrosion rate (mpy) according to Equation 3:25  where K represents a constant whose value is 3.16 × 10⁶, W represents the weight loss (g), A, t, r represent the exposed area (cm2), the immersion time (h) and the density of lowcarbon steel (7.85 g cm-3), respectively. Equation 4 had been used to calculate the corrosion inhibition efficiencies (h%).  where V0 and V1 represent the corrosion rate of without and with inhibitors, respectively. The surface compositions of lowcarbon steel immersed in corrosion solutions with different mediums at 25 ºC for 24 h were acquired by X-ray photoelectron spectroscopy (XPS, PHI5000 Versaprobe-II). The morphologies of samples were observed by scanning electron microscope (SEM, Nova 450, FEI) after ultrasonic clear the steel sheets which were immersed in corrosion solutions with different mediums and temperature for 24 h.
RESULTS AND DISCUSSION Open circuit potential (OCP) analysis The OCP variation of lowcarbon steel immersed in HAc solution with different concentrations of AMC, PVP and AMC + PVP inhibitors for 2000 s at 25 ºC is depicted in Figures 2a-2c, respectively. Obviously, the potentials are shifted to more negative values after the addition of various investigated inhibitors with different concentrations, which is similar with previous reports.26,27 This may be the state of steel/solution interface changed by the adsorption of inhibitors on the surface of steel.26 Aslam et. al28,29 suggest the more positive OCP values after the addition of inhibitor indicating that the compound exhibits anodic type inhibitor. In this work, the OCP are all shifted to more negative values after adding the AMC, PVP and AMC + PVP inhibitors, indicating that they all exhibit as cathode type inhibitors, which mainly inhibits cathode hydrogen evolution reaction. The PVP exhibits more negative potential compared to AMC, indicating PVP can better inhibit cathode hydrogen evolution reaction. Furthermore, the PVP exhibits a faster OCP stable time of about 500 s, but the AMC displays a slowly OCP stable time. This phenomenon suggests that PVP can form a stable adsorption film on the steel surface quickly compared with AMC. All OCP curves tend to be stable after 2000 s, indicating the steel surface has reached a more thermodynamically steady state because of the adsorption of inhibitors.30
 Figure 2. The OCP variation of lowcarbon steel exposed to 20% HAc solution containing 600 mg L-1 chloride ions with different concentrations of AMC (a), PVP (b) and AMC + PVP combination inhibitor (c) at 25 °C
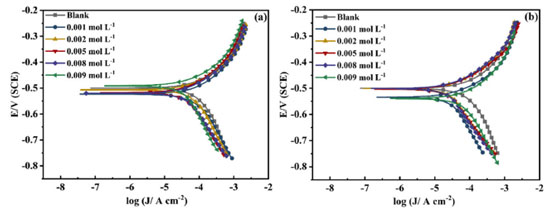
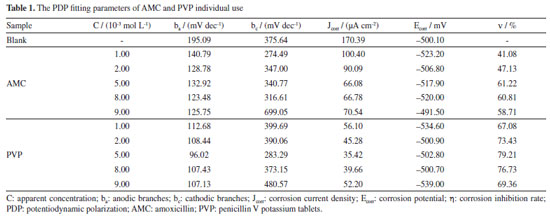
The corrosion inhibition properties of AMC and PVP in individual use Figure 3 and Table 1 show the PDP results for AMC and PVP individual use at 25 ºC. It can be noticed that the corrosion potential (Ecorr) exhibits a small change (less than 85 mV) after the addition of the AMC and PVP, indicating that both AMC and PVP are mixed-type inhibitors.31-33 The slope of the cathodic branches (bc) and the anodic branches (ba) of the polarization curve changes obviously, which indicate that the inhibitor molecules are adsorbed on the surface lowcarbon steel and building a covering layer.30 The corrosion current densities (Jcorr) (Table 1) decrease first and then increase with the concentration increase of both AMC and PVP. The values of Jcorr reach the minimum at the concentration of 5.0 × 10⁻³ mol L-1, suggesting that the corrosion inhibition rate reaches the maximum (61.22% for AMC and 79.21% for PVP).
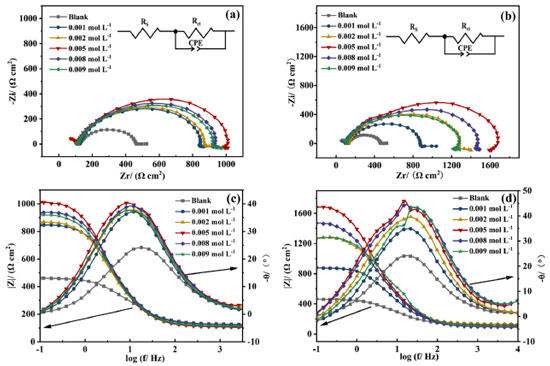
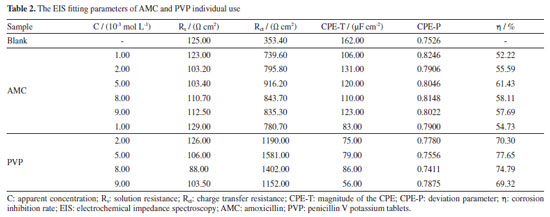
The Nyquist plots (Figures 4a and 4b) exhibit an irregular semicircle, which is caused by the roughness of the electrode surface and the adsorption inhomogeneity.34 The inset in Nyquist plots represents the equivalent circuit diagram for the EIS fitting, where the Rs performs the solution resistance, the Rct is the charge transfer resistance, and the CPE represents the non-uniform solid phase element.35 The addition of AMC and PVP result in a larger radius of capacitive loop compared with the blank solution, which represents a larger Rct value. The larger Rct indicates that the inhibitor forms an adsorption layer on the electrode surface, slowing down the corrosion of mild steel. The capacitive loop radius reaches the maximum at the concentration of 5.0 × 10⁻³ mol L-1, suggesting that the Rct value reaches the maximum. Meanwhile, the impedance modulus in low-frequency exhibits the maximum value at 5.0 × 10⁻³ mol L-1 (Figures 4c and 4d). At this point, the corrosion inhibition rate of the AMC and PVP reaches the maximum, with the values of 61.43% for AMC and 77.65% for PVP, respectively (Table 2). In addition, the CPE-T in Table 2 represents the magnitude of the CPE, and the CPE-P is the deviation parameter (-1≤ CPE-P ≤ 1) which is commonly caused by the non-uniformity of the solid surface.36 As seen, the values of the CPE-P are all lower than 1, indicating the CPE is not a perfect capacitance.28
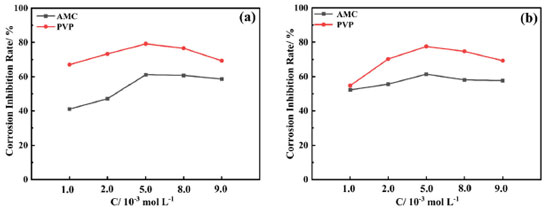
Figures 4c and 4d show that the phase angle curves exhibit only one extreme value in the mid-frequency region where the impedance mode slope is near -1, indicating that the solution system possesses only one time constant when the AMC and PVP are added individually.37 It is worth noting that the phase angle plot of PVP (Figure 4d) exhibit abrupt changes after the concentration higher than 5.0 × 10⁻³ mol L-1, some previous reports also show this phenomenon.38-43 This may be due to the formation of another outer adsorbed layer with uneven and porous peculiarity on the interior uniform single adsorption layer caused by the excess added of PVP. Thus, two relaxation processes which correspond to the response of intact inner adsorbed layer and outer adsorbed layer with uneven and porous peculiarity has been observed in the phase angle plot. Figures 5a and 5b show the corrosion inhibition rate variation of the two drugs measured by the PDP and EIS method, respectively. It can be seen that there are some differences in the values of corrosion inhibition rate, but the whole variation tendency in inhibition rate remains consistent between the PDP and EIS method, which ensures the reliability of test results. It is obvious that the best corrosion inhibition effect of the PVP is significantly stronger than that of AMC when they are used individually.
The corrosion inhibition performance of AMC + PVP combination inhibitor Figure 6 shows the electrochemical test results of the AMC + PVP combination inhibitor, the PDP and EIS fitting parameters are listed in Tables 3 and 4, respectively. As can be seen from Figure 6a and Table 3, the ba and bc also change evidently and the maximum change of Ecorr is less than 85 mV, indicating that the AMC + PVP combination inhibitors still behave as a mix-type inhibitor.33 The Jcorr increases with the close of the combination molar ratio, indicating that the performance of AMC + PVP combination inhibitor decreases with the close of the combination molar ratio. Especially, when AMC and PVP are combined with the molar ratio of 1:1, the corrosion inhibition rate reaches the lowest of 37.95%. It is worth noticing that a small amount of PVP promotes the corrosion inhibition performance of AMC. The corrosion inhibition rate increases from 61.22 (the best inhibition rate of AMC used alone) to 84.69% (the combination molar ratio AMC:PVP = 9:1). However, the small amount of AMC almost not affect the corrosion inhibition effect of PVP, the corrosion inhibition rate changes from 79.21 (the best inhibition rate of AMC used alone) to 80.20% (the combination molar ratio AMC:PVP = 1:9). The EIS results listed in Figures 6b, 6c and Table 4 also show the same regularity. Both the capacitive loop radius (Figure 6b) and the impedance modulus in low-frequency (Figure 6c) decrease with the combination molar ratio close, illustrating the reducing of the Rct and corrosion inhibition rate. When the AMC and PVP combination ratio is 1:1, the capacitive loop exhibits the smallest radius and the impedance modulus shows the lowest value except the blank solution, which represent the AMC + PVP combination inhibitor has the worst corrosion inhibition at this combination ratio. While when the AMC:PVP combination ratio is 1:9, the capacitive loop shows the largest radius and the impedance modulus exhibits the maximum value, indicating the best corrosion inhibition at this combination ratio. In addition, there is still only one peak in the phase angle after the AMC and PVP combining (Figure 6c), indicating that the solution system still has only one time constant. Figure 6d shows the consistency of the variation in the corrosion inhibition rate obtained by the PDP and EIS method.
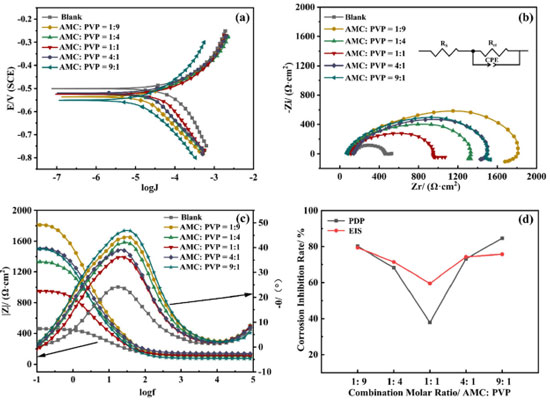 Figure 6. The polarization curve (a), Nyquist spectrum (b), Bode plot (c) and corrosion inhibition rate variation (d) of the AMC + PVP combination inhibitor at 25 °C
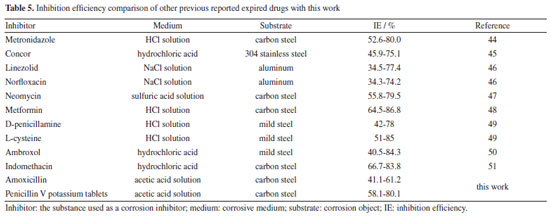
Weight loss analysis Figure 7 displays the mass loss results of lowcarbon steel immerse in the corrosion solutions with different concentrations of AMC, PVP and AMC + PVP inhibitors at 25 ºC. Apparently, the corrosion rate decreases significantly after the addition of the AMC, PVP and AMC + PVP inhibitors. Figures 7a and 7b exhibit that the corrosion rates decrease first and then increase with the increase of AMC and PVP concentrations when they are used individually. And the corrosion rate of AMC and PVP all reach the lowest at the concentration of 5.0 × 10⁻³ mol L-1. The inhibition efficiencies of AMC and PVP exhibit the opposite regularity of change. At the concentration of 5.0 × 10⁻³ mol L-1, the corrosion inhibition efficiencies reach the maximum with 61.59 for AMC and 80.07% for PVP, respectively. When the AMC and PVP are used in combination, the corrosion rate increases with the close of mixed molar ratios and the inhibition efficiency decreases with the close of mixed molar ratios. The inhibition efficiency achieves the minimum value of 48.52% at the 1:1 molar ratio. The results of weight loss test confirm the conclusion of electrochemical measurement well. Table 5 compares the inhibition performance of this work with the previous reports. As seen, the inhibition efficiency of this work is similar to previous reports.
 Figure 7. Weight loss measurements results of lowcarbon steel immerse in the corrosion solutions with different concentrations of AMC (a), PVP (b) and AMC + PVP (c) inhibitors at 25 °C
Effect of temperature on the AMC + PVP combination inhibitor To investigate the effect of temperature on the AMC + PVP combination inhibitor, the lowcarbon steel working electrode are tested in various temperatures solution by PDP and EIS methods. The molar ratio of AMC + PVP combination inhibitor is AMC:PVP = 1:9. The results are presented in Figure 8, Tables 6 and 7. As can be seen from Figure 8a, the cathodic and anodic branches of polarization curve at all temperatures are close to parallel, indicating that the temperature change do not affect the corrosion mechanism of lowcarbon steel.44 According to Table 6, the Jcorr increases gradually with the rise of temperature, indicating that more electrons pass through the electrode surface. Figures 8b and 8c show the gradually decrease of the capacitive arc radius and the impedance modulus with the increasing temperature, indicating the reduction of the adsorb layer density and uniformity on the steel surface. Table 7 shows the values of Rct decrease with the rise of temperature, indicating the increasing temperature result the instability of adsorb layer. Therefore, the corrosion inhibition rate decreases with rising temperature. Moreover, the phase angle in Figure 8c still shows only one peak, indicating that the corrosion inhibition system at different temperatures has only one time constant, further proving that the temperature change does not affect the corrosion mechanism of mild steel. As can be seen from Figure 8d, the corrosion inhibition rates obtained by the PDP and EIS methods exhibit a large decrease with the increasing temperature, from 79.37 and 80.20% at 25 ºC to 38.74 and 29.07% at 55 ºC, respectively.
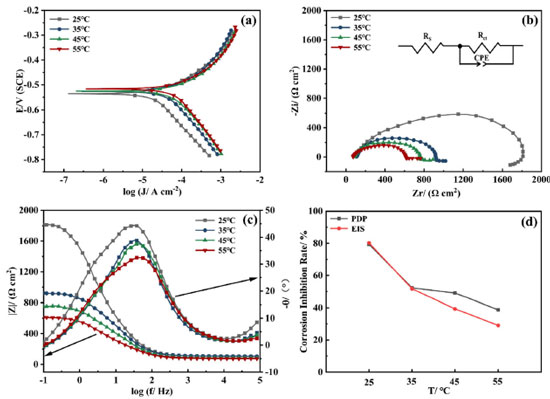 Figure 8. The PDP plot (a), the Nyquist spectrum (b), the Bode plots (c) and the corrosion inhibition rate variation (d) of the AMC + PVP combination inhibitor at different temperatures
Adsorption model To explore the adsorption information of the AMC and PVP on mild steel electrodes, the Langmuir adsorption curve is treated with a regression of C/θ-C to describe the adsorption of the AMC and PVP inhibitors. The adsorption isotherm is as follows:45  where C, Kads, and θ are the corrosion inhibitor concentration, adsorption equilibrium constant, and surface coverage, respectively. The θ is calculated from Equation 6:35  As can be seen from Figure 9, the Langmuir adsorption curves fit the data well, indicating that the adsorption of both the AMC and PVP drugs on mild steel surface is consistent with the Langmuir adsorption model. The corrosion inhibitor molecules form a single molecular adsorption layer on the mild steel surface, which effectively alleviates the corrosion of mild steel. The standard free energy of adsorption is calculated from Equation 7:35
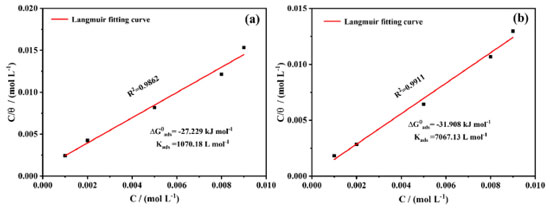 Figure 9. The Langumir adsorption curves of lowcarbon steel immersed in corrosion solution at 25 ºC: (a) adding AMC and (b) adding PVP
 where 55.1 is the molar concentration of water, R is the ideal gas constant, and T is the absolute temperature. The values of Kads indicate the bonding strength between the adsorbent and the surface.46 It can be seen from Figure 9 that the Kads value of PVP (7067.13 L mol-1) is much greater than that of AMC (1070.18 L mol-1), indicating that the bonding strength between the PVP molecules and the steel surface is much greater than that of AMC. This is the reason for the corrosion inhibition efficiency of PVP higher than that of AMC. In addition, the values are -27.229 kJ mol-1 for AMC and -31.908 kJ mol-1 for PVP. Usually, if the value is more positive than -20 kJ mol-1, the adsorption process is considered as physisorption. While the adsorption process is chemisorption caused by coordination bonding when the value is more negative than -40 kJ mol-1.47 Obviously, the values of the AMC and PVP are located within -20 and -40 kJ mol-1, indicating that the adsorptions of both AMC and PVP on the mild steel surface belong to a mixed adsorption containing physisorption and chemisorption. The value of PVP is more negative than that of AMC, indicating the chemisorption of PVP is higher than that of AMC. XPS analysis XPS characterization is used to explore the composition on the surface of steel. All XPS data are calibrated using the C 1s peak at 284.80 eV. As seen in Figure 10a, the surface of steel immersed in corrosion solution without inhibitor has detected the elements signal of Fe, O, C, Cl. After the addition of AMC and PVP, the N and S signals have been detected, indicating that the successfully adsorbed of the corrosion inhibitors on the surface of lowcarbon steel. It is worth noting that the Cl signal weakens on the surface of adding AMC (Figures 10a and 10b), which maybe because the adsorbed of AMC reduces the adsorption site of Cl-. More importantly, the surface of adding PVP has no Cl signal, indicating the formation of denser protective film on the steel surface. The C 1s in Figure 10c can be deconvoluted into C-C (284.80 eV), C-O (285.26 eV) and C=O (288.80 eV).48 The O 1s peak (Figure 10d) can be assigned to Fe2O3/Fe3O4 (530.20 eV), FeOOH (531.89 eV) and C-O/ C=O (532.85 eV).49-51 The N 1s fitting peak (Figure 10e) with AMC and PVP inhibitors are related to C-N (399.78 eV) and C-N+ (400.75 eV), respectively.49 Obviously, the N 1s peak of AMC is higher than that of PVP, maybe because the presence of Cl- attracts more C-N+. The S 2p in Figure 10f exhibits two peaks: the ionic coordination bond of S-Fe located at 169.13 eV and the S=C/S-C bond located around 162.53 eV.29,51,52 The strength of S-Fe in steel surface with PVP is higher than that of AMC, indicating the chemical adsorbed of PVP is stronger than that of AMC, which is consistent with the aforementioned adsorption results. Moreover, the S=C/S-C bond in the surface with AMC inhibitor shift toward to high binding energy, which is because the presence of Cl- on the steel surface with AMC inhibitor. Figure 10g shows that the Fe 2p spectrum of all samples contains two peaks of 2p3/2 around 711.32 eV and 2p1/2 around 724.91 eV, respectively. The Fe 2p3/2 and Fe 2p1/2 without inhibitor can be allotted to Fe3+ (710.90, 723.87 eV), Fe2+ (712.84, 725.61 eV), FeCl3, (714.95, 727.85 eV), and two satellite peaks (718.71, 731.76 eV), respectively.50,52,53 After the addition of AMC and PVP, the Fe 2p3/2 and Fe 2p1/2 are decomposed into Fe2O3/Fe-N (710.36, 723.16 eV), FeOOH (711.49, 724.91 eV), Fe-S (713.49, 726.99 eV), Fe3O4 (715.48, 728.87 eV), and two satellite peaks (718.71, 731.51 eV), respectively.49,51,54,55 The AMC exhibits lower signal of FeOOH, Fe-S, and Fe3O4 compared with PVP, indicating the protective films on the surface with AMC inhibitor are lower than that of PVP.29 Therefore, the inhibition efficiency of AMC is lower than that of PVP.
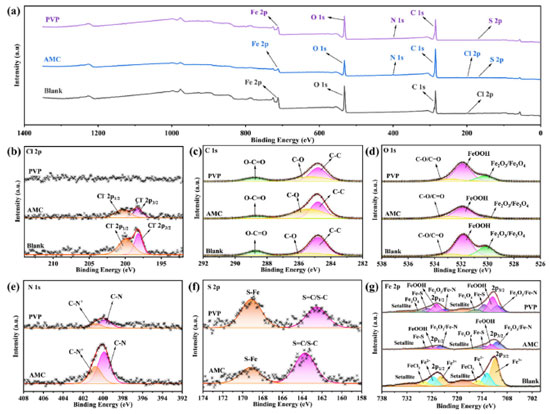 Figure 10. XPS of lowcarbon steel immersed in corrosion solution without and with different inhibitor at 25 ºC: survey (a) and high-resolution (b) Cl 1s, (c) C 1s, (d) O 2p, (e) N 1s, (f) S 2p, (g) Fe 2p
SEM analysis For verifying the corrosion inhibition effect of expired AMC and PVP, the morphologies of the mild steel surfaces are observed by SEM. Figure 11a displays the serious destroy on the steel surface by blank corrosion solution. After adding the AMC (Figure 11b) and PVP (Figure 11c) individually, the traces left during polishing can be clearly observed, indicating the corrosion of the steel is significantly alleviated. It is worth noting that a certain amount of corrosion products can be observed when AMC is added alone, while almost no corrosion products are observed when PVP is added alone. This further verifies that the corrosion inhibition effect of the PVP is greater than that of AMC. When AMC and PVP are used in combination with the optimal compound ratio (AMC:PVP = 1:9), no significant corrosion pits and corrosion products are observed on the steel surface at 25 ºC (Figure 11d). However, the steel surface exhibits severely corrosion after the temperature is increased to 50 ºC (Figure 11e), indicating that the corrosion inhibition effect of AMC + PVP combination inhibitor decreases as the temperature increasing. Therefore, the temperature should be noted when the expired AMC and PVP are combining use.
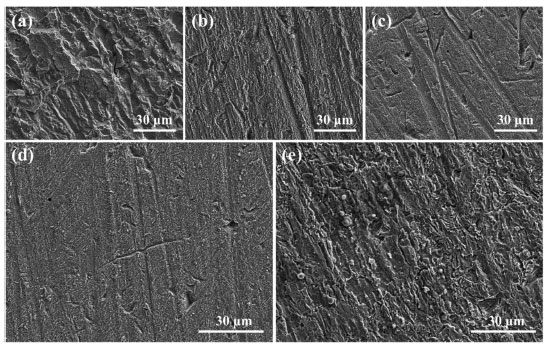 Figure 11. SEM images after lowcarbon steel immersed in corrosion solution: (a) without inhibitors at 25 ºC, (b) with 5.0 × 10⁻³ mol L-1 AMC at 25 ºC, (c) with 5.0 × 10⁻³ mol L-1 PVP at 25 ºC, (d) with 1.0 × 10⁻³ mol L-1 AMC and 9.0 × 10⁻³ mol L-1 PVP at 25 ºC, and (e) with 1.0 × 10⁻³ mol L-1 AMC and 9.0 × 10⁻³ mol L-1 PVP at 50 °C
Corrosion inhibition mechanism The corrosion inhibition mechanism of expired AMC and PVP can be explained by the formation of a protective film on mild steel surface (Figures 12 and 13). As can be seen in Figure 12 and XPS results, due to the interattraction of the specific adsorption of Cl- on the steel surface and the protonated amino group of AMC, a main part of AMC are adsorbed on the mild steel surface by electrostatic attraction (physisorption).56,57 Another part of AMC are adsorbed on the mild steel surface caused by coordination bonds of Fe-N, Fe-S and so on (chemisorption).58 The PVP are adsorbed on the steel surface mainly by chemisorption because of the stronger coordination bonds and more negative value. The stronger chemisorption of PVP reduces the specific adsorption of Cl- on the steel surface, as well as reduce the stable time of OCP. Therefore, a part of PVP are physically adsorbed to the steel surface due to its polarity rather than electrostatic attraction. The stronger adsorption strength of PVP causes the higher corrosion inhibition rate than that of AMC when they are individual use.
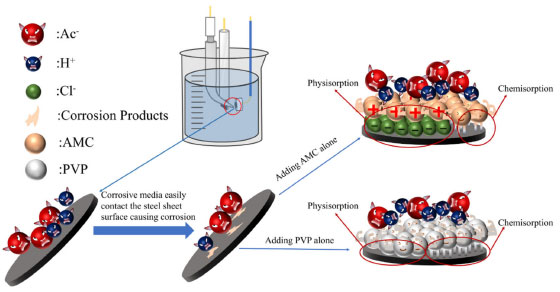 Figure 12. Corrosion inhibition mechanism of AMC and PVP individual use
 Figure 13. Corrosion inhibition mechanism of AMC and PVP combined use
As seen in Figure 13, both the AMC and PVP molecules possess a high steric hindrance, so they cannot compensate the voids after adsorption each other when they are combining used at close molar ratios (e.g., 1:1). Therefore, the adsorption film is defective tightness when the AMC and PVP are combined with a close molar ratio, which leads to a poor corrosion inhibition. When the AMC and PVP are combined with a great molar ratio of 1:9 or 9:1, the few amounts of AMC or PVP compensates the vacant at the adsorption of the other, thus improving the corrosion inhibition rate. The solution system internal energy is increased with the temperature increasing, leading to an intensification of molecular thermal motion. The adsorption energy of AMC + PVP combination inhibitor on the mild steel surface does not offset the kinetic energy of the molecular thermal motion. As a result, the adsorption film becomes unstable (Figure 13), leading to a reduction in corrosion inhibition effectiveness.
CONCLUSIONS The purpose of this study is to evaluate the corrosion inhibition performance of the expired AMC and PVP individual and compounded in acetic acid solutions containing chloride ions. Both the AMC and PVP shows as the mixed-type corrosion inhibitor at individual using, primarily affect cathodic process. The corrosion inhibition rate of them initially increases and then decrease with the concentration increasing. The best corrosion inhibition concentrations are reached at 5.0 × 10⁻³ mol L-1. The adsorption models of both AMC and PVP in the steel surface are consistent with Langumir monomolecular layer adsorption, whilst the stronger chemisorption of PVP leading a higher corrosion inhibition rate (79.21%) than that of AMC (61.22%). After the AMC and PVP are used in compound, a small amount of PVP enhance the corrosion inhibition effect of AMC, but the corrosion inhibition rate drops sharply when the AMC and PVP compounding ratios are close. Especially, the corrosion inhibition rate drops to the lowest value of 37.95% when the AMC and PVP are compounded with the 1:1 mole ratio. The adsorption of the AMC + PVP combination inhibitor on mild steel surface is impeded by elevated temperature, leading to a reduction of the corrosion inhibition rate.
ACKNOWLEDGMENTS This work was supported by the National Natural Science Foundation of China (grants No. 51972282 and grants No. U1602273) and the Yunnan Fundamental Research Projects Youth Fund (grant No. 202001AU070008).
REFERENCES 1. Hou, B.; Li, X.; Ma, X.; Du, C.; Zhang, D.; Zheng, M.; Xu, W.; Lu, D.; Ma, F.; npj Mater. Degrad. 2017, 1, 4. [Crossref] 2. Lin, B.; Shao, J.; Zhao, C.; Zhou, X.; He, F.; Xu, Y.; J. Mol. Liq. 2023, 375, 121296. [Crossref] 3. Krivý, V.; Materials 2022, 15, 6796. [Crossref] 4. Wang, Q.; Wang, R.; Zhang, Q.; Zhao, C.; Zhou, X.; Zheng, H.; Zhang, R.; Sun, Y.; Yan, Z.; Molecules 2023, 28, 2832. [Crossref] 5. Zhang, Y.; Yu, M.; Chen, C.; Li, S.; Liu, J.; Frontiers in Materials 2022, 8, 795397. [Crossref] 6. Beek, T. A. D.; Weber, F. A.; Bergmann, A.; Hickmann, S.; Ebert, I.; Hein, A.; Küster, A.; Environ. Toxicol. Chem. 2016, 35, 823. [Crossref] 7. Banjar, H.; Alrowithi, R.; Alhadrami, S.; Magrabi, E.; Munshi, R.; Alrige, M.; Int. J. Environ. Res. Public Health 2022, 19, 2875. [Crossref] 8. Alnahas, F.; Yeboah, P.; Fliedel, L.; Abdin, A. Y.; Alhareth, K.; Int. J. Environ. Res. Public Health 2020, 17, 787. [Crossref] 9. Ojeda, L.; Oliva, J.; Oliva, A. I.; Garcia, C. R.; New J. Chem. 2023, 47, 10090. [Crossref] 10. Guirguis, K.; Pharm. World Sci. 2010, 32, 52. [Crossref] 11. Garey, K. W.; Johle, M. L.; Behrman, K.; Neuhauser, M. M.; Ann. Pharmacother. 2004, 38, 1165. [Crossref] 12. Boumya, W.; Taoufik, N.; Achak, M.; Bessbousse, H.; Elhalil, A.; Barka, N.; Talanta Open 2021, 3, 100026. [Crossref] 13. Elanthamilan, E.; Ganeshkumar, A.; Radha, A.; Rajaram, R.; Merlin, J. P.; Int. J. Energy Res. 2021, 46, 4380. [Crossref] 14. Chen, C.; Xu, Y.; Shao, J.; Zhang, Y.; Yu, M.; Sun, L.; Wang, H.; Xie, Y.; Zhu, G.; Zhang, L.; Pan, L.; J. Colloid Interface Sci. 2022, 616, 413. [Crossref] 15. Gece, G.; Corros. Sci. 2011, 53, 3873. [Crossref] 16. Sherif, E. S. M.; Ahmed, A. H.; Abdo, H. S.; DefAllah, M. N.; Crystals 2021, 11, 1263. [Crossref] 17. Sharma, S.; Kumar, A.; J. Mol. Liq. 2021, 322, 114862. [Crossref] 18. Liang, D. D.; Wei, X. S.; Wang, Y.; Jiang, H. R.; Shen, J.; J. Alloys Compd. 2018, 766, 964. [Crossref] 19. Singh, S. K.; Mukherjee, A. K.; J. Mater. Sci. Technol. 2010, 26, 264. [Crossref] 20. Wu, Y.; Shi, Y. L.; Su, C. W.; Feng, L. L.; Guo, J. M.; Bai, W.; Int. J. Electrochem. Sci. 2017, 12, 10042. [Crossref] 21. Lagrenee, M.; Mernari, B.; Bouanis, M.; Traisnel, M.; Bentiss, F.; Corros. Sci. 2002, 44, 573. [Crossref] 22. Singh, M. M.; Gupta, A.; Corrosion 2000, 56, 371. [Crossref] 23. Liang, Y.; Li, Y.; Liu, H.; Chen, M.; Guo, J.; Xiang, M.; Bai, W.; Int. J. Electrochem. Sci. 2022, 17, 221052. [Crossref] 24. Ye, Y.; Zou, Y.; Jiang, Z.; Yang, Q.; Chen, L.; Guo, S.; Chen, H.; J. Alloys Compd. 2020, 815, 152338. [Crossref] 25. Mobin, M.; Aslam, R.; Salim, R.; Kaya, S.; J. Colloid Interface Sci. 2022, 620, 293. [Crossref] 26. Gao, L.; Peng, S.; Huang, X.; Gong, Z.; Appl. Surf. Sci. 2020, 511, 145446. [Crossref] 27. Chen, S.; Chen, S.; Zhu, B.; Huang, C.; Li, W.; J. Mol. Liq. 2020, 311, 113312. [Crossref] 28. Aslam, R.; Mobin, M.; Huda; Shoeb, M.; Murmu, M.; Banerjee, P.; J. Ind. Eng. Chem. 2021, 100, 333. [Crossref] 29. Alamry, K. A.; Aslam, R.; Khan, A.; Hussein, M. A.; Tashkandi, N. Y.; Process Saf. Environ. Prot. 2022, 159, 178. [Crossref] 30. Zakaria, K.; Abbas, M. A.; Bedair, M. A.; J. Mol. Liq. 2022, 352, 118689. [Crossref] 31. Li, H.; Qiang, Y.; Zhao, W.; Zhang, S.; Colloids Surf., A 2021, 616, 126077. [Crossref] 32. Olasunkanmi, L. O.; Ebenso, E. E.; J. Colloid Interface Sci. 2020, 561, 104. [Crossref] 33. Alamry, K. A.; Khan, A.; Aslam, J.; Hussein, M. A.; Aslam, R.; Sci. Rep. 2023, 13, 6724. [Crossref] 34. Sun, A.; Cui, G.; Liu, Q.; Colloids Surf., A 2023, 664, 131106. [Crossref] 35. Elabbasy, H. M.; Gadow, H. S.; J. Mol. Liq. 2020, 321, 114918. [Crossref] 36. Wang, Z.; Bai, W.; Xu, C.; Shi, Y.; Wu, Y.; Guo, J.; Feng, L.; Int. J. Electrochem. Sci. 2017, 12, 10291. [Crossref] 37. Han, P.; Zhang, B.; Chang, Z.; Fan, J.; Du, F.; Xu, C.; Liu, R.; Fan, L.; J. Mol. Liq. 2022, 348, 118044. [Crossref] 38. Wierzbicka, E.; Vaghefinazari, B.; Lamaka, S. V.; Zheludkevich, M. L.; Mohedano, M.; Moreno, L.; Visser, P.; Rodriguez, A.; Velasco, J.; Arrabal, R.; Matykina, E.; Corros. Sci. 2021, 180, 109189. [Crossref] 39. Nan, H. Y.; Zhu, L. Q.; Liu, H. C.; Li, W. P.; Corros. Eng., Sci. Technol. 2015, 50, 589. [Crossref] 40. Berdimurodov, E.; Kholikov, A.; Akbarov, K.; Guo, L.; Kaya, S.; Katin, K. P.; Verma, D. K.; Rbaa, M.; Dagdag, O.; Haldhar, R.; Colloids Surf., A 2022, 637, 128207. [Crossref] 41. Berdimurodov, E.; Kholikov, A.; Akbarov, K.; Guo, L.; Kaya, S.; Verma, D. K.; Rbaa, M.; Dagdag, O.; J. Electroanal. Chem. 2022, 907, 116055. [Crossref] 42. Udayappan, B.; Veawab, A.; Int. J. Greenhouse Gas Control 2022, 114, 103565. [Crossref] 43. Uzoma, I. E.; Solomon, M. M.; Loto, R. T.; Umoren, S. A.; Sustainability 2022, 14, 6500. [Crossref] 44. Damej, M.; Kaya, S.; Ibrahomo, B. E.; Lee, H. S.; Molhi, A.; Serdaroglu, G.; Benmessaoud, M.; Ali, I. H.; Hajjaji, S. E.; Lgaz, H.; Surf. Interfaces 2021, 24, 101095. [Crossref] 45. Gong, Z.; Peng, S.; Huang, X.; Gao, L.; Materials 2018, 11, 2107. [Crossref] 46. Zhang, W.; Nie, B.; Wang, M.; Shi, S.; Gong, L.; Gong, W.; Pang, H.; Liu, X.; Li, B.; Feng, Y.; Wu, Y. C.; J. Mol. Liq. 2021, 343, 117672. [Crossref] 47. El-Lateef, H. M. A.; Corros. Sci. 2015, 92, 104. [Crossref] 48. Zhou, Z.; Min, X.; Wan, S.; Liu, J.; Liao, B.; Guo, X.; Results Eng. 2023, 17, 100971. [Crossref] 49. Li, X.; Deng, S.; Du, G.; J. Taiwan Inst. Chem. Eng. 2022, 131, 104171. [Crossref] 50. Bach, L. X.; Dao, T. B. N.; Duong-Ngo, K. L.; Tran, T. N.; Minh, T. L.; Trong, H. N.; Ngoc, C. T. H.; Panaitescu, C.; Hoai, N. T.; Dang, N. N.; Journal of Taibah University for Science 2023, 17, 2247633. [Crossref] 51. Yao, X.; Qiang, Y.; Guo, L.; Xu, Q.; Wen, L.; Jin, Y.; J. Ind. Eng. Chem. 2022, 114, 427. [Crossref] 52. Saraswat, V.; Yadav, M.; Colloids Surf., A 2021, 627, 127172. [Crossref] 53. Zhou, Z.; Min, X.; Wan, S.; Liu, J.; Liao, B.; Guo, X.; Results Eng. 2023, 17, 100971. [Crossref] 54. Zheng, H.; Zhang, B.; Wang, X.; Lu, Y.; Li, F.; Li, C.; Chem. Eng. J. 2023, 452, 139043. [Crossref] 55. Sun, X.; Qiang, Y.; Hou, B.; Zhu, H.; Tian, H.; J. Mol. Liq. 2022, 362, 119733. [Crossref] 56. Fadila, B.; Sihem, A.; Sameh, A.; Gülfeza, K.; Mater. Res. Express 2019, 6, 046419. [Crossref] 57. Melian, R.; Radi, M.; Hachimi, F. E.; Galai, M.; Ouakki, M.; Assiri, E. H. E.; Guo, L.; Dkhirche, N.; Tougami, M. E.; Inorg. Chem. Commun. 2023, 152, 110679. [Crossref] 58. Geng, S.; Hu, J.; Yu, J.; Zhang, C.; Wang, H.; Zhong, X.; J. Mol. Struct. 2022, 1250, 131778. [Crossref] |
On-line version ISSN 1678-7064 Printed version ISSN 0100-4042
Qu�mica Nova
Publica��es da Sociedade Brasileira de Qu�mica
Caixa Postal: 26037
05513-970 S�o Paulo - SP
Tel/Fax: +55.11.3032.2299/+55.11.3814.3602
Free access


