Artigo
| Efavirenz microcrystals for dissolution enhancement - fluid-bed granulation, scale-up, tableting and pharmacokinetics |
|
Livia Deris PradoI,II; Isabella Costa Ramos de CastroI; Karen Medeiros GonçalvesI; Thamyrys Barreto ArgentaIII; Leandro TassoIII; Helvécio Vinícius Antunes RochaI,II,*
I. Laboratório de Micro e Nanotecnologia, Farmanguinhos, Fundação Oswaldo Cruz, 21040-361 Rio de Janeiro- RJ, Brasil Received: 11/28/2023 *e-mail: helvecio.rocha@fiocruz.br Efavirenz, an antiretroviral drug, is a class 2 according to the biopharmaceutics classification system. Many dissolution enhancement systems have been tried and our group had success using wet milling to decrease particle size and granules were obtained by spray and freeze drying. In this paper we present data related to the upgrade in the process, raising the solids concentration in the suspension from 10 to 50% (m/v) and changing the drying step for a fluid bed granulation. After that, tablets were obtained. Granules and tablets were fully evaluated and a pharmacokinetic study was also performed with the granules. By powder X-ray diffraction (PXRD) and Fourier transform infrared spectroscopy (FTIR) it was possible to prove that there was no phase transition in the sample after milling and drying. Dissolution efficiency of 4 from 5 granules was higher than 90%, considering 83% for the raw material. Tablets were technically approved but the dissolution was impacted and just 2 out of 11 showed results > 80%. A high enhancement in the bioavailability was also observed, around 172%. So, it is possible to conclude that efavirenz microcrystals with enhanced dissolution and bioavailability can be formulated into tablets and are a viable system to develop a new drug product. INTRODUCTION Efavirenz (EFV), an active pharmaceutical ingredient (API) non-nucleoside reverse transcriptase inhibitor, is used as part of antiretroviral therapy for people with acquired immunodeficiency syndrome (AIDS). EFV is available as coated tablets containing 600 mg of the drug. It was approved by the Food and Drug Administration (FDA) in 19981 and can be administered with other antiretroviral drugs, such as protease inhibitors and/or nucleoside analog reverse transcriptase inhibitors.2 In Brazil, EFV is available as coated tablets.3 Its low bioavailability reaches a maximum of 45%.4 Because of its hydrophobic nature, EFV is considered as class II5,6 according to the biopharmaceutics classification system (BCS),7 with low solubility and high permeability. For pediatric administration, a common practice is to split or crush the tablet which can evidence the bitter taste of EFV and, consequently, make adherence to the treatment difficult.8 The administration of the oral solution to pediatric patients is also possible; however, this dosage form has pharmacotechnical disadvantages, such as the eventual use of organic solvents to solubilize the API, unpleasant taste and poor stability.9 In favor of the manufacture of solid dosage forms is the recommendation of the World Health Organization (WHO), according to which pediatric antiretroviral formulations should preferably be solid dosage forms, especially (oro)dispersible tablets.10 These formulations have the great advantage of being administered without water and being easy to swallow.11 Also, the dissolution should be taken into account to ensure adequate bioavailability. There are several technologies available to improve the dissolution of APIs12-14 and the particle size reduction technique is considered one of the most promising, as it is already widely described in the literature15,16 and widespread in the market. The method selected, in this paper, for the particle size reduction and the preparation of microcrystals of EFV was milling drug suspensions in aqueous medium with stabilizers, processed in a colloid mill and dried in fluidized bed. Our group17 previously demonstrated the preparation of EFV suspensions by colloid milling, but the drying step was performed by lyophilization and spray-drying. Thus, the strategy was to improve processability according to the previous results focusing in two aspects: (i) changing the drying process using a fluidized bed, a more common process used in the pharmaceutical industry with viable cost and (ii) enhancing the solid proportion in the suspension, which is interesting to decrease the time necessary for the drying step and, consequently, the manufacturing cost. Results are relevant not only for the pediatric treatment, but all age groups since the increase in dissolution can affect treatment regardless of the age of the patient. Moreover, results usually presented in the literature are limited to the preparation and characterization of the microparticles and their pharmacokinetics and manufacturing in dosage forms are not commonly mentioned. So, the present work is also important in order to enhance the knowledge about the in vivo performance and processability of efavirenz in microparticles formulated by an industrially viable process. This paper is the continuity of an extensive research program of the laboratory. More than the focus on the development on a new drug product, efavirenz represented a case of study, by which we are trying to compare different dissolution/bioavailability enhancement scaleable approaches.17-21 All of them are alternatives that can be easily transported to an industrial production.
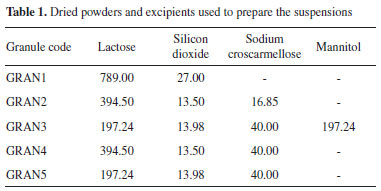
EXPERIMENTAL Materials Efavirenz manufacturer will not be disclosed because of a confidentially agreement. Hydroxypropylcellulose (HPC) was acquired from Ashland (Wilmington, USA), sodium lauryl sulfate (SLS) from Vetec (Duque de Caxias, Brazil), polyvinylpyrrolidone (PVP) F-30 from Boai NKY (Boai, China), red dye from Sun Chemical (Parsippany, USA), lactose monohydrate 200 mesh from Meggle (Wasserburg, Germany), silicon dioxide from Grace (Columbia, USA), sodium croscarmellose from Sigma-Aldrich (Saint Louis, USA), mannitol from Roquette (Lestrem, France), calcium phosphate from Vetec (Duque de Caxias, Brazil), sucralose from Tate & Lyle (London, England), mint flavor from Kerry (Tralee, Ireland), carboxymethyl cellulose from Denver (Cotia, Brazil) and heparin (5000 IU mL-1) was purchased from Cristália Produtos Químicos Farmacêuticos Ltda (Itapira, Brazil). Suspension preparation and granulation The suspension was prepared according to method described earlier by our group17 enhancing drug concentration from 10 to 50% (m/v) in 800 mL of water. To prepare the suspension, 270 mL of water was heated to 50 ºC and HPC (8 g) + SLS (8 g) were added using magnetic stirring MAG HS 7 (IKA, Germany). After excipient solubilization, heating was stopped and the remaining water was added. EFV was gradually added to the solution using a mechanical stirrer (IKA, Germany) and the suspension was processed in a colloid mill (Meteor, Brazil) for 1 h. After this period, the suspension was kept under mechanical stirring and PVP K30 (0.35% m/v, 16 g) (granulation agent) and red dye (2.8 g) were added, forming the final sample. The dye was added to allow visualization of the uniformity during drying/granulation. The suspension was dried using a fluid bed process (Glatt GPCG-3, USA). Initially, different mixtures of excipients (Table 1) were selected based in previous work of our group.17 Then the amount of lactose was reduced to decrease tablet size. The other excipients and quantities were chosen according to the results that were being collected. The excipients mixtures were sized by a 28 mesh (600 mm) sieve. The powder mixtures were added in the pan and heated to 60 ºC. The suspensions were then added and throughout the process, they were kept under mechanical agitation (200 to 300 rpm) using the spiral rod. The air flow was selected so that the powder would not stand still in the pan and also so that it would not reach the upper height of the spray gun. The chamber was opened at regular intervals to remove the product adhered to the wall and restart the addition. The dried samples are described in Table 1, with the suspension used and the excipients selected. The granule selected for in vivo evaluation was GRAN3, which theoretical concentration/content in terms of EFV was 59.9% (after drying).
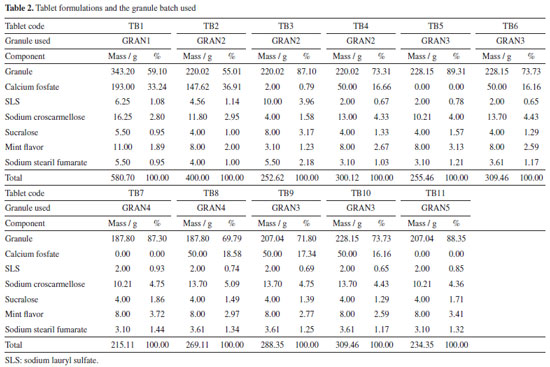
Powder X-ray diffraction (PXRD) Measurements of the granules were made on the Bruker D8 Advance diffractometer (Karlsruhe, Germany) with radiation CuKα (λ = 1.5405 Å), 40 kV and 40 mA, voltage and current, respectively. The step of 0.02º and the time per step of 0.01 s were used, and angles from 4 to 40º were explored. Detector Lynxeye XE (Bruker) was used. Crystal structure of EFV polymorph I (CCDC reference code: 767883)22 and II (CCDC reference code: 728655)23 were obtained from the Cambridge Structural Database.24 The simulated PXRD pattern of the structure was calculated using Mercury,25 which was used to identify the prepared samples. Fourier transform infrared spectroscopy (FTIR) Infrared spectra of the granules were obtained on the Thermo-Nicolet model 6700 (Waltham, USA) Fourier transform spectrometer with attenuated total reflectance (ATR) accessory. Spectra were recorded from 4000 to 400 cm-1 with a resolution of 4 cm-1. Scanning electron microscopy (SEM) The photomicrographs of the granules were obtained on a Hitachi model TM3030Plus (Tokyo, Japan) scanning electron microscope with a voltage of 10 kV. Small amounts of sample were adhered to a double-sided carbon tape on a support. The samples were metallized on the Sputter BalTech model SCD 050 (Pfäffikon, Switzerland) metallizer with a thin layer of gold at room temperature and vacuum to be evaluated. Particle size measurement The granules were evaluated for granulate size by the Produtest model Granutest (São Paulo, Brazil) sieve shaker sieving method with amplitude adjusted rheostat 8 for a total of 30 min. Approximately 25 g of sample and six sieves arranged from the largest to the smallest opening to the collector were used. Powder classification was based on the Brazilian Pharmacopeia.26 Also, with the particle size data, d10, d50 and d90 were calculated with the accumulated values just above and below 10, 50 and 90%, respectively, and considering a log base 2. Powder flow Powder flow may be evaluated by different perspectives. In this paper, we made measurements according to 4 methods, which are indicated in the United States Pharmacopeia.27 Moreover, we made the angle of repose determination by two different approaches (manually and instrumented). The set of the techniques used is not common in the pharmaceutical literature, since our knowledge. Flow through orifices To perform the test, 20 g of the granules were transferred to a 10 mm funnel coupled to the powder flow tester (Erweka PFT, Langen, Germany) in vibration mode (step 0).28-30 The funnel flow hole was opened and the time taken for the material to flow was measured. Angle of repose The angle of repose was measured manually and with the equipment Erweka PFT. In the manual method, it was established a pattern in height between the funnel base and a metal cylinder with a 37 mm radius. The samples (granules and raw material) were slowly placed into the funnel and the height of the formed cone was measured. The angle of repose was calculated by the ratio of height to radius of the cone. Assays were performed in triplicate. In the PFT, the procedure was identical to the one described in flow through orifices but the base was changed for a disc in which the powder flows and the cone height is measured by a laser beam which goes up and down all over the cone. The radius is previously known by the equipment. Bulk and tapped density Approximately 10 g of the samples (granules and raw material) were placed in 100 mL graduated beakers. The volume occupied by the powder was recorded and the bulk density was calculated. The beakers were placed on the Erweka model SVM 22 (Heusenstamm, Germany) tapped density meter and subjected to 10 beats. After recording the volume, the samples were subjected to 500 beats more and the volume was recorded. When the difference to the previous volume was greater than 2%, the test continued with more 1250 beats.27 The tests were performed in triplicate. The Hausner ratio (HR) and the compressibility/Carr index (CI) were calculated with the bulk and tapped density values. Powder dissolution Dissolution profiles were determined with sample quantities (granules and raw material) equivalent to 100 mg of EFV. Samples were added to vessels containing 900 mL 0.25% (m/v) of SLS at 37 ºC with paddle apparatus at 50 rpm. Aliquots of 10 mL were removed and immediately filtered at 5, 10, 15, 30, 45, 60, 90, 120 and 150 min. After dilution, the measurements were performed at 248 nm with an UV-Vis spectrophotometer (Shimadzu, Kyoto, Japan). The profiles were also evaluated by dissolution efficiency.31 Tablet formulation and characterization Tablets were prepared by mixing the granules with other excipients (Table 2). First, the granules were calibrated using 35 mesh sieve with an oscillating granulator (produtest sieve shaker, Granutest). Then, the granules were weighed to add an amount corresponding to 100 mg of EFV for each tablet. The final batches contained the amount to prepare 25 tablets.
Compression Compression was performed on a Fette 102i (Schwarzenbek, Germany) rotary tablet machine using a single punch system with manual addition to produce round tablet with a 7.5 mm diameter. Weight adjustment ramp was set to 18. The parameters depth filling, pre-compression cylinder height and compression cylinder height were adjusted so that the hardness of the tablets was between 50 and 65 N. The first two batches, TB1 and TB2, had their weight per tablet adjusted and the punches used were round with 10 and 8.5 mm diameter, respectively, both concave and plain. Disintegration of the tablets The disintegration time of the tablets was evaluated with a disintegrator (Erweka ZT71) containing 800 mL of purified water at 20 ºC; this temperature is used because the tablets are intended to be dispersible and, in this case, USP27 recommends room temperature and not 37 ºC, as in the case of swallowable dosage forms. For this procedure, 3 tablets were selected and the disintegration time was observed with the aid of a stopwatch and visual assay, without discs. Hardness of the tablets Hardness determination was carried out on a hardness tester (Erweka TBH310) and performed during the compression step to aid in tablet machine adjustments and to maintain tablet hardness between 50 and 65 N. Parameters such as diameter and thickness were also measured. The test was also performed in the middle and the end of the process. Dissolution of the tablets For dissolution, an efavirenz tablet was added to the Distek Evolution 6100 dissolution equipment (North Brunswick, USA) round bottom vessels containing 900 mL of 0.25% (m/v) SLS at 37 ºC. Stirring was maintained at 50 rpm using paddle apparatus (type 2 - USP).27 Collections were performed at 5, 10, 15, 30, 45, 60, 90, 120 and 150 min. The 10 mL aliquots were filtered through 0.45 µm filters. Aliquots were diluted and evaluated on the UV spectrophotometer at 248 nm. No replacement of the dissolution medium was performed. The analytical curve was prepared with efavirenz feedstock from 0.001 to 0.015 mg mL-1. Pharmacokinetics evaluation The experimental protocols involving animals were performed according to the National Institutes of Health Guide for Care and Use of Laboratory Animals and Institutional guidelines (protocol 006/2019, Universidade de Caxias do Sul). Male Wistar rats (body weight 320-350 g) were obtained from the Universidade Federal do Rio Grande do Sul (Porto Alegre, Brazil). They were acclimatized for 7 days in an environment with unlimited access of food and water in an air-conditioned animal centre at a temperature of 23 ± 2 ºC and 62 ± 3% relative humidity, with a 12-h light/dark cycle. The rats were deprived of food for 12 h before experimentation. Both groups, G1 (pure EFV, n = 6) and G2 (GRAN3 formulation, n = 7) after p.o. administration received a single oral dose (20 mg kg-1) of efavirenz (raw material) and EFV formulation by oral gavage. Administration was made with carboxymethyl cellulose 1.0%. Blood samples were harvested into heparinized tubes at pre-determined times (0.5, 1.0, 1.5, 2, 2.5, 3, 4, 6, 8 and 10 h). Plasma was separated by centrifugation at 12,000 rpm (centrifuge DTC16000, Daiki, Tokyo, Japan) for 10 min and stored at –80 ºC until analysis by a validated HPLC-MS/MS method. The pharmacokinetic parameters were determined for each individual animal, and the sample population averages were calculated. The determination of the pharmacokinetic parameters in plasma were performed using Phoenix WinNonlin software,32 version 6.4 (Certara L. P., Princeton, NJ, USA) employing noncompartmental analysis. The relative oral bioavailability (Fr) was calculated by considering the ratio between the area under the curve, AUC0-last of microcrystals (GRAN3) and the EFV suspension (reference) when 20 mg kg-1 dose was employed (Equation 1):  where AUCT is the area under the curve for test formulation and AUCR is the area under the curve for reference formulation.
RESULTS AND DISCUSSION In a previous report,17 we demonstrated the dissolution and bioavailability enhancement of efavirenz by a liquid-based milling process, with particle size reduction and a powder formation by spray and freeze-drying. In that case, there was prepared a suspension with 10% of drug (m/v). With this concentration, pharmaceutical suspensions may be considered diluted33 but they would be more adequate for spray-drying.34 Higher concentrations, however, usually cause increased viscosity and turn the process not very viable for lab scale equipment or need some improvements, such as ultrasonic atomizers.35 Moreover, in the industrial plant of our company, freeze and spray-drying equipments are not available, but a fluid bed one is. So, it would be very interesting to change the granulation process in order to enable the scale-up. One very important difference between spray-drying and fluid bed granulation is that in the first case the suspension can be sprayed as it is. But in the fluid bed process, a powder base must be introduced in the equipment and it will dilute the drug, lowering its concentration in the final granule. Nevertheless, as the concentration in the starting suspension is 5 times higher than in the spray drying process, it can be compensated and the final product may be not so affected. For this, some excipients (Table 2) were chosen based on their classical use in the pharmaceutical technology. Lactose is one of the most used diluents in tablet formulations;36 colloidal silicon dioxide presents a glidant property and promotes flow enhancement.37 Croscarmellose sodium is one the most relevant superdisintegrants and may contribute to the final dissolution of the system in an intragranule situation.38 Mannitol, in its turn, contributes in the drying process of wet granulations and may also contribute in the mouth feel of tablets.36 It is important to mention that this technology have been successfully applied to drug dissolution enhancement and is pointed as a versatile way to use as a scalable method in pharmaceutical research.39 Granules characterization Powder X-ray diffraction The granules characterized by PXRD showed similar patterns, indicative of the same crystalline form as EFV raw material (Figure 1). In addition, to verify the crystalline form present in the samples, the calculated XRD patterns of polymorphs I and II were evaluated. EFV polymorph I show characteristic peaks between 6 and 7º at 2θ that are also present in all prepared samples. Therefore, it could be concluded that the process to prepare the granules did not induce any phase transition.
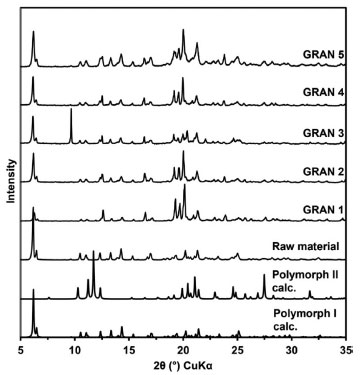 Figure 1. PXRD of the raw material and the dried samples compared to calculated patterns of polymorphs I and II
Fourier transform infrared spectroscopy (FTIR) By FTIR evaluation, it was possible to confirm the chemical identity of EFV present in all samples. In addition, no significant band shifts were observed, which could suggest phase transition. This result corroborates the data found in PXRD. However, it is important to note that, as the samples have EFV mixtures with different excipients, the verification of band shift to correlate with phase changes of the raw material becomes more limited by infrared spectroscopy analyses. The evaluation of the spectra was made by comparing experimental data with literature data for the correct attribution of vibrational modes. The –NH stretch region occurs at a wave number of approximately 3310 cm-1.40 This region showed greater differences between the samples. Table 3 presents the band assignment for the samples and the spectra are presented in Supplementary Material. GRAN4 showed higher frequency, which indicates that the –NH group is participating in weaker hydrogen bonds. This fact may be related to the interactions between EFV and the excipients present in the formulations.
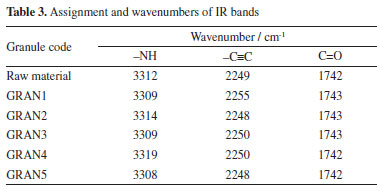
The absorption bands of –C=O and –C≡C occur at approximately 1740 and 2250 cm-1, respectively, as reported in the literature.40 It is possible to see that the prepared samples did not show significant differences in both regions. Scanning electron microscopy (SEM) Figure 2 shows the SEM images of the raw material and the prepared samples. All samples presented larger agglomerates (granules) compared to the raw material particles. Despite this larger size, the EFV particles present in these granules are possibly small. In the previous work,17 some samples presented very round particles, even been possible to see the small crystals of the drug, which were not solubilized during the process. In the present case, however, as the drying/granulation process was changed, particles showed a very distinct shape, more irregular and not round, although this is quite common for fluidized bed granulation and the microscopic shape of the particles here obtained was very similar to those observed in other works.41,42
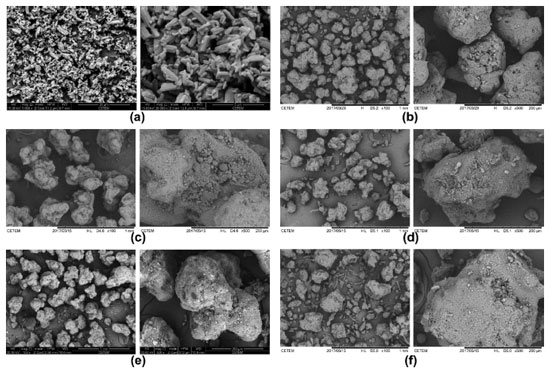 Figure 2. Photomicrographs of (a) raw material, (b) GRAN1, (c) GRAN2, (d) GRAN3, (e) GRAN4, (f) GRAN5
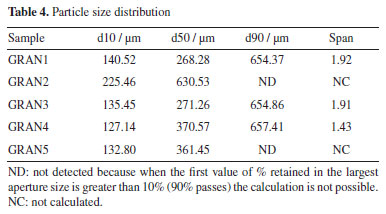
Particle size analysis The samples were evaluated for their particle size by the sieving method. According to the Brazilian Pharmacopoeia26 all samples can be described as moderately coarse powders, as their particles have all passed through the nominal mesh size 710 µm and at most 40% through the 250 mesh nominal size screen. However, it is possible to observe some differences between the samples (Table 4). GRAN2 showed greater retention in the initial sieves, featuring a larger particle size than in the others (higher d50). This sample was first prepared with croscarmellose sodium, but in smaller quantity than the following ones.
Flow properties Angle of repose was performed manually as well as instrumentally. Since our knowledge, it is the first time this is compared in the literature. With the results obtained by the equipment, it can be seen (Table 5) that all samples, except GRAN2, showed an excellent angle of repose (below 30º); in this specific case, the classification observed in the instrumented test is in accordance with that obtained by the index of Carr and Hausner ratio. In general, taking the visual inspection into consideration, it seems that the equipment did not show good discriminatory capacity and the angle of repose was better evaluated manually. It was found that the GRAN3, GRAN4 and GRAN5 showed passable, poor and good flow characteristics, respectively. It is interesting to note that the standard deviation of the tests made with the equipment was usually higher than those obtained manually. It is an important issue because there is no literature indicating what would be the maximum deviation that could be accepted.
Regarding the flow rate, the sample with the highest flow difficulty was GRAN2 and the one with the best flow was GRAN1. These results agree with the angle of repose measured by the equipment. The graphs obtained are shown in Figure 3. It is observed that the samples presented a continuous flow, but some had a high deviation.
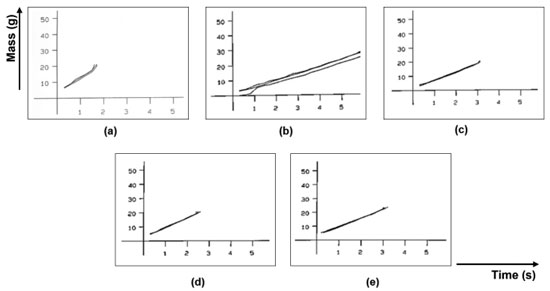 Figure 3. Flow rate graphs (from flow through orifice): (a) GRAN1, (b) GRAN2, (c) GRAN3, (d) GRAN4, (e) GRAN5
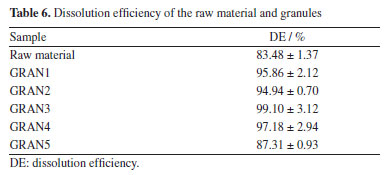
The uniform flow observed for the formulations is quite different from that seem in the case of the raw material, indicating that even poor flow characteristics of the drug may be corrected by a good manufacturing process and an adequate chose of the excipients. Powder dissolution All EFV granules showed higher drug release compared to the raw material. Except for GRAN5, the samples showed complete API dissolution in 15 min and their release profile is characteristic of very rapidly dissolving formulations (Figure 4). From in vitro dissolution studies it was evident that the process used for particle size reduction of the API and the microcrystals carrier increased the dissolution of EFV, without changes in the crystal form. The lower dissolution efficiency (DE) (Table 6) for GRAN5 may be due to the reduction in the concentration of hydrophilic excipients.
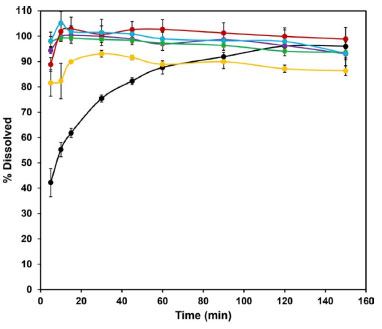 Figure 4. Dissolution profile of the granules compared to the raw material (black): GRAN1 (green), GRAN2 (purple), GRAN3 (red), GRAN4 (light blue) and GRAN5 (yellow)
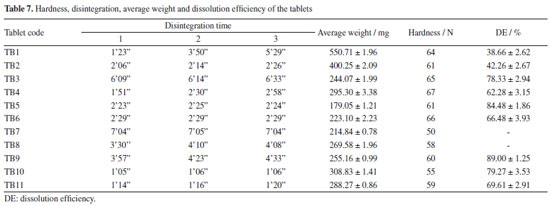
As all the prepared granules showed greater dissolution than the raw material, with acceptable flow properties, they were used for tablet formulations. Tablet formulation and characterization Physical tests The results (Table 7) suggest that, in this initial stage, the formulations TB1, TB3, TB7, TB8 and TB9 were not suitable for dispersible tablets classification, since they presented disintegration time greater than 3 min.43 TB1 presented very different results for the 3 tablets evaluated, what may be due to the fact that the granulation obtained by fluidized bed drying was not calibrated like the others, which passed through the oscillating granulator. Disintegration can be strongly influenced by hardness, TB10 and TB11 tablets were in the 50-60 N range, while TB7, TB8 and TB9 tablets around 65-70 N.
Dissolution of the tablets Tablets were evaluated regarding in vitro performance using 0.25% SLS (Figure 5). The beginning of the dissolution was much lower for TB1 and TB2 batches. The tablets with higher dissolution at the end of the test were TB3, TB5, TB9 and TB10. TB3 reached 91% dissolved in 120 min, while TB10 showed 84% dissolution at the same time. TB5 reached 88% dissolution in 45 min, with a maximum dissolution of 92% in 60 min and TB9 reached 93% dissolution in 45 min. The other batches did not exceed 80% dissolved within 150 min of testing. TB7 and TB8 were not submitted to dissolution test, as they had efavirenz content below 100 mg.
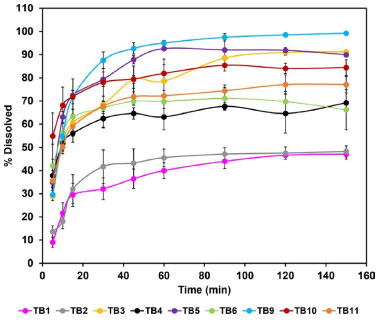 Figure 5. Dissolution profile of the tablets
The DE (Table 7) was higher for the TB5 and TB9 batches, with values of 84.48 and 89.00%, respectively. Both batches were produced with granules GRAN3 and the tablets did not present anhydrous dibasic calcium phosphate in their composition. Because formulation TB9 showed disintegration time greater than 3 min and was not proper for orodispersible dosage forms, TB5 batch could be selected for this purpose and as the tablets were prepared with the GRAN3 granule, it was selected for pharmacokinetic studies. Pharmacokinetics evaluation Considering that the extent of absorption of a drug present in a pharmaceutical formulation is related to its bioavailability, the determination of this pharmacokinetics parameter becomes essential in the search for the optimization of formulations. The area under the curve (AUC) was determined after oral administration of a single dose of efavirenz at 20 mg kg-1. The mean plasma concentrations versus time profiles are shown in Figure 6.
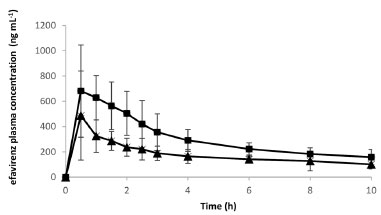 Figure 6. Pharmacokinetic plasma profiles of efavirenz (  ) and efavirenz formulation - GRAN3 ( ) and efavirenz formulation - GRAN3 ( ) at 20 mg kg-1 in Wistar rats ) at 20 mg kg-1 in Wistar rats
Pharmacokinetic parameters obtained after a noncompartmental analysis of the individual profiles enabled estimation of the AUC parameter: AUC0-last was 1747.9 ± 615.8 and 3009.0 ± 722.8 h × ng mL-1; ke = 0.14 ± 0.08 and 0.15 ± 0.05 h-1; t1/2 = 6.0 ± 2.6 and 5.0 ± 1.6 h; Vd/F = 66.11 ± 17.45 and 36.41 ± 17.98 L and Cl/F = 8.98 ± 5.0 and 4.84 ± 0.71 L h-1 to EFV (Group1) and GRAN3 (Group 2), respectively. There was a significant difference (p < 0.05) between these two groups, with a relative oral bioavailability around 172%. This result shows that the technological approach selected induced a higher absorption extension in comparison with unprocessed EFV. Maximum concentration (Cmax)were 521.16 ± 310.86 and 792.2 ± 317.6 ng mL-1 for Group 1 and Group 2, respectively. In a previously published work,17 our group also demonstrated an increase in the bioavailability of efavirenz (40 mg kg-1) in relation to the unprocessed raw material. Nonetheless, EFV exhibits nonlinear pharmacokinetics and comparison between doses can be misleading, as the gastric emptying and saturation of metabolic process can play important roles in its pharmacokinetics.44 But despite that there was a higher absorption extension in comparison with unprocessed EFV and this confirms the feasibility of scaling the formulation. It is important to note that the enhancement in bioavailability can be translated into dose reduction, which implies lower costs of production, considering the high percentage of active pharmaceutical ingredient in the dosage form and that it represents the most valuable raw material present in the formulation. Moreover, although we have demonstrated before a possible improvement in the palatability of the microcrystals in comparison to the isolated active principle, a decrease in the quantity of drug exposed to the taste buds can reduce the perception of its bad taste. So, there are many benefits that can be attributed to the final product related to the bioavailability enhancement.
CONCLUSIONS This paper is based in a previous work of our group in which we developed efavirenz microcrystals focusing in dissolution and bioavailability enhancement. It is now presented an improvement of the process, changing from 10 to 50% (m/v) in the solids concentration of the suspension and also the granulation made by fluidized bed. Particle size was reduced and there was observed a change in the morphology of the particles. Powder flow was measured by 4 different indexes, and it was possible to detect variation in the profile of the granules but also a fluctuation in the results of the different techniques for the same sample. It is not usually discussed in the literature and a deeper evaluation should be done in future studies. Almost all granules showed dissolution efficiencies higher than 90% but there was a decrease in this percentage when they were formulated in tablets. Even with this reduction, some tablets still showed final dissolution above 80%, which is a very acceptable value for the final product. The pharmacokinetic study was very important, considering the relevance of an in vivo evaluation. In this case, it was verified an increase in AUC and Cmax when comparing microcrystals with the raw material (not processed). So, it is possible to conclude that efavirenz microcrystals with enhanced dissolution and bioavailability can be formulated into tablets and are a viable system to develop a new drug product.
SUPPLEMENTARY MATERIAL Complementary material for this work is available at http://quimicanova.sbq.org.br/, as a PDF file, with free access.
ACKNOWLEDGMENT The authors would like to thank LDRX/Universidade Federal Fluminense and CETEM (Centro de Tecnologia Mineral) for analyses of X-ray diffraction and scanning electron microscopy, respectively. The authors also thank to Banco Nacional de Desenvolvimento Econômico e Social (BNDES) and Conselho Nacional de Desenvolvimento Científico e Tecnológico (CNPQ). L. D. P. and H. V. A. R. acknowledge FAPERJ Rede Rio de Inovação em Nanossistemas para a Saúde - NanoSaúde (E-26/010.000983/2019).
REFERENCES 1. Food Drug Administration (FDA), https://www.fda.gov/media/123560/download?attachment, accessed in June 2024. 2. Wintergerst, U.; Hoffmann, F.; Jansson, A.; Notheis, G.; Huss, K.; Kurowski, M.; Burger, D.; J. Antimicrob. Chemother. 2008, 61, 1336. [Crossref] 3. Agência Nacional de Vigilância Sanitária (ANVISA), https://consultas.anvisa.gov.br/#/medicamentos/q/?substancia=20685, accessed in June 2024. 4. Chiappetta, D. A.; Facorro, G.; de Celis, E. R.; Sosnik, A.; Nanomedicine: Nanotechnology, Biology and Medicine 2011, 7, 624. [Crossref] 5. Chowdary, K. P. R.; Naresh, A.; J. Appl. Pharm. Sci. 2011, 1, 130. [Link] accessed in June 2024 6. Cristofoletti, R.; Nair, A.; Abrahamsson, B.; Groot, D. W.; Kopp, S.; Langguth, P.; Polli, J. E.; Dressman, J. B.; J. Pharm. Sci. 2013, 102, 318. [Crossref] 7. Amidon, G. L.; Lennernäs, H.; Shah, V. P.; Crison, J. R.; Pharm. Res. 1995, 12, 413. [Crossref] 8. Sosnik, A.; Nanomedicine 2010, 5, 833. [Crossref] 9. Strickley, R. G.; J. Pharm. Sci. 2019, 108, 1335. [Crossref] 10. World Health Organization (WHO), https://www.who.int/publications/i/item/9789241514361, accessed in June 2024. 11. Comoglu, T.; Ozyilmaz, E. D.; Pharm. Dev. Technol. 2019, 24, 902. [Crossref] 12. Rabinow, B. E.; Nature Rev. Drug Discovery 2004, 3, 785. [Crossref] 13. Atsukawa, K.; Amari, S.; Takiyama, H.; J. Ind. Eng. Chem. 2021, 101, 21. [Crossref] 14. Lim, C.; Kang, J. K.; Jung, C. E.; Sim, T.; Her, J.; Kang, K.; Oh, K. T.; AAPS PharmSciTech 2021, 22, 169. [Crossref] 15. Rasenack, N.; Müller, B. W.; Pharm. Dev. Technol. 2004, 9, 1. [Crossref] 16. Leleux, J.; Williams, R. O.; Drug Dev. Ind. Pharm. 2014, 40, 289. [Crossref] 17. Hoffmeister, C. R.; Fandaruff, C.; da Costa, M. A.; Cabral, L. M.; Pitta, L. R.; Bilatto, S. E.; Prado, L. D.; Corrêa, D. S.; Tasso, L.; Silva, M. A. S.; Rocha, H. V. A.; Eur. J. Pharm. Sci. 2017, 99, 310. [Crossref] 18. Costa, M. A.; Seiceira, R. C.; Rodrigues, C. R.; Hoffmeister, C. R. D.; Cabral, L. M.; Rocha, H. V. A.; Pharmaceutics 2012, 5, 1. [Crossref] 19. Costa, M. A.; Lione, V. O. F.; Rodrigues, C. R.; Cabral, L. M.; Rocha, H. V. A.; Int. J. Pharm. Sci. Res. 2015, 6, 3807. [Crossref] 20. Sartori, G. J.; Prado, L. D.; Rocha, H. V. A.; AAPS PharmSciTech 2017, 18, 3011. [Crossref] 21. Sartori, G. J.; Prado, L. D.; Rocha, H. V. A.; Braz. J. Pharm. Sci. 2022, 58, e18800. [Crossref] 22. Ravikumar, K.; Sridhar, B.; Mol. Cryst. Liq. Cryst. 2009, 515, 190. [Crossref] 23. Mahapatra, S.; Thakur, T. S.; Joseph, S.; Varughese, S.; Desiraju, G. R.; Cryst. Growth Des. 2010, 10, 3191. [Crossref] 24. Allen Junior, L. V.; Ansel, H. C.; Ansel's Pharmaceutical Dosage Forms and Drug Delivery Systems, 10th ed.; Lippincott Williams & Wilkins: Philadelphia, 2014. 25. Macrae, C. F.; Bruno, I. J.; Chisholm, J. A.; Edgington, P. R.; McCabe, P.; Pidcock, E.; Rodriguez-Monge, L.; Taylor, R.; van de Streek, J.; Wood, P. A.; J. Appl. Crystallogr. 2008, 41, 466. [Crossref] 26. Farmacopeia Brasileira, 6ª ed.; Agência Nacional de Vigilância Sanitária Editora: Brasília, 2019. 27. The United States Pharmacopeia (USP); USP 42-NF 37, General Chapter <1174> Powder Flow; The United States Pharmacopeial Convention, Rockville, 2019. 28. Alves, J. M. V.; Prado, L. D.; Rocha, H. V. A.; Pharm. Dev. Technol. 2019, 21, 856. [Crossref] 29. Andrioli, A.; Prado, L. D.; da Costa, M. A.; Rocha, H. V. A.; Rev. Cienc. Farm. Basica Apl. 2014, 35, 401. [Link] accessed in June 2024 30. Szumilo, M.; Belniak, P.; Swiader, K.; Holody, E.; Poleszak, E.; Saudi Pharm. J. 2017, 25, 900. [Crossref] 31. Khan, K. A.; J. Pharm. Pharmacol. 1975, 27, 48. [Crossref] 32. Certara, https://www.certara.com/software/phoenix-winnonlin/, accessed in June 2024. 33. Nutan, M. T. H.; Reddy, I. K. In Pharmaceutical Suspensions: From Formulation Development to Manufacturing; Kulshreshtha, A. K.; Singh, O. N.; Wall, G. M., eds.; Springer Science & Business Media: Berlim, 2009, ch. 2. 34. Patel, B. B.; Patel, J. K.; Chakraborty, S.; Shukla, D.; Saudi Pharm. J. 2015, 23, 352. [Crossref] 35. Naglieri, V.; Gutknecht, D.; Garnier, V.; Palmero, P.; Chevalier, J.; Montanaro, L.; Materials 2013, 6, 5382. [Crossref] 36. Sheskey, P. J.; Cook, W. G.; Cable, C. G.; Handbook of Pharmaceutical Excipients, 8th ed.; Pharmaceutical Press: London, 2017. 37. Alderborn, G. In Aulton's Pharmaceutics: The Design and Manufacture of Medicines; Aulton, M. E.; Taylor, K., eds.; Elsevier Health Sciences: Philadelphia, 2013, ch. 30. 38. Remington, J. P.; Remington: The Science and Practice of Pharmacy, 21st ed.; Lippincott Williams & Wilkins: Philadelphia, 2006. 39. Takahashi, A. I.; Lourenço F. R.; Duque, M. D.; Consiglieri, V. O.; Ferraz, H. G.; Braz. Arch. Biol. Technol. 2012, 55, 477. [Crossref] 40. Marques, M. M.; Rezende, C. A.; Lima, G. C.; Marques, A. C.; Prado, L. D.; Leal, K. Z.; Rocha, H. V. A.; Ferreira, G. B.; Resende, J. A.; J. Mol. Struct. 2017, 1137, 476. [Crossref] 41. Matsunami, K.; Nagato, T.; Hasegawa, K.; Sugiyama, H.; Int. J. Pharm. 2019, 559, 210. [Crossref] 42. Morin, G.; Briens, L.; AAPS PharmSciTech 2014, 15, 1039. [Crossref] 43. European Pharmacopoeia, 11th ed.; Council of Europe/European Directorate for the Quality of Medicines and Healthcare (EDQM): London, 2023. 44. Balani, S. K.; Kauffman, L. R.; de Luna, F. A.; Lin, J. H.; Drug Metab. Dispos. 1999, 27, 41. [Link] accessed in June 2024
Associate Editor handled this article: Eduardo H. S. Sousa |
On-line version ISSN 1678-7064 Printed version ISSN 0100-4042
Qu�mica Nova
Publica��es da Sociedade Brasileira de Qu�mica
Caixa Postal: 26037
05513-970 S�o Paulo - SP
Tel/Fax: +55.11.3032.2299/+55.11.3814.3602
Free access


