Artigo
| Rapid degradation of malachite green dye wastewater using H2O2 under recyclable silica/magnetic nanocatalyst |
|
Jingheng Ning* School of Chemistry and Chemical Engineering, Changsha University of Science and Technology, 410110 Changsha, Hunan, China Received: 02/23/2024 *e-mail: ningjingheng@126.com The discharge of dye contaminant malachite green (MG) into the water environment will seriously affect human health. In this paper, Fe3O4@SiO2 magnetic nanoparticles were prepared as catalysts using co-precipitation and sol-gel methods, which accelerated the removal of MG by H2O2 over a wide pH range with remarkable results. The degradation mechanism is consistent with the Fe2+-H2O2 Fenton system and the pseudo-first-order kinetic model, and the degradation rate can be increased by 179 times compared with not using this catalyst. When pH ≥ 5, Fe3O4@SiO2 catalyzes H2O2 oxidation of MG for only 10 min to achieve a high degradation rate of 99%, and less than 3 min to achieve a 95% degradation rate. The catalyst can be quickly separated and easily regenerated under an external magnetic field, and a degradation rate of 82% can still be reached after 5 uses. In a word, this work has successfully developed an efficient, green and economic MG wastewater treatment technology. INTRODUCTION Organic dye is one of the main pollutants discharged into water environment by textile and printing industry, and its discharge is increasing at an alarming rate. At present, the research on dye wastewater treatment mainly focuses on adsorption enrichment1 and catalytic degradation.2 Among them, the removal of dye molecules by the adsorption method requires combination with other methods for better removal, such as photocatalysis.3 In contrast, the catalytic degradation method is much simpler and more efficient because it breaks down the dye molecules directly in water. However, this method also has many problems, for example, the applicable pH range is often very narrow, and the catalyst is not easy to separate and recover, etc.4,5 In recent years, advanced oxidation processes have shown great potential in removing organic pollutants from water, especially H2O2 oxidation catalyzed by Fe3O4 magnetic nanoparticles (MNPs).6-8 Firstly, Fe2+ in Fe3O4 has good catalytic performance and can form a Fenton system with H2O2 greatly accelerating the degradation of organic pollutants by H2O2.9 Secondly, Fe3O4 nanoparticles have a high specific surface area, which can effectively adsorb and enrich organic pollutants, so as to further promote the complete oxidation and decomposition of dye molecules by H2O2.10 Thirdly, the strong magnetic properties of Fe3O4 MNPs make it easy to be separated and regenerated in external magnetic field, and this excellent recyclability reduces the economic cost of H2O2 degradation of dye wastewater.11 Therefore, Fe3O4 MNPs catalyzed H2O2 treatment of organic polluted wastewater has become a research hotspot.12,13 However, Fe3O4 MNPs tend to agglomerate, which usually requires various surface modification when used.14 By coating SiO2 to modify the Fe3O4 magnetic core, it can overcome the disadvantage of easy agglomeration, improve its dispersibility in water, and effectively prevent the oxidation of Fe2+ into Fe3+, thus ensuring its good catalytic performance and recyclability.15,16 Malachite green (MG) is a triphenylmethane cationic dye, which is widely used in the dye industry.17-19 MG can also treat fungal or bacterial infections in fish, so it used to be a common drug in aquaculture.20 Once MG enters the food chain with fish, it will cause carcinogenesis, teratogenesis, mutagenesis and other toxic side effects on human body.21-23 In addition, its metabolite leucomalachite green is more toxic in living organisms.24 Although MG has been listed as a prohibited drug in aquaculture by many countries, it is still illegally abused by illegal businessmen due to its low cost and good therapeutic effect on fish diseases.25 In recent years, MG has also been found to be used in large quantities to treat ornamental fish diseases and to enter aquatic environments with municipal sewerage systems.26 Under this background, it is of great significance to study how to quickly and effectively remove the residual MG from all kinds of complex wastewater. In this work, Fe3O4@SiO2 MNPs with good dispersibility, strong magnetism and good catalytic performance were prepared by co-precipitation and sol-gel method, and were used to catalyze the degradation of MG by H2O2 in wastewater at different pH. The catalytic effect of Fe3O4@SiO2 on the oxidative decomposition of MG by H2O2 were systematically investigated with the UV-Vis spectrophotometer. The conditions of H2O2 concentration, catalyst dosage, initial concentration of MG, temperature and pH range were optimized to perform the best treatment effect of MG wastewater. Besides, the recycling performance of Fe3O4@SiO2 catalyst was also investigated. By using Fe3O4@SiO2 nanocatalysts, we expect the degradation rate of malachite green to be greatly enhanced, much higher than that without Fe3O4@SiO2; and the stability, efficiency and regeneration of such kind of catalysts are expected to be excellent. At the same time, this new MG treatment method may be applied within a much wider pH range. Therefore, this new technology of Fe3O4@SiO2 MNPs catalyzing H2O2 to rapidly and completely degrade MG wastewater under acid-base conditions provides a new economic and eco-friendly idea for treating complex industrial wastewater with different pH values.
EXPERIMENTAL Chemicals and reagents All chemicals used in this work were analytically pure. Ferric chloride hexahydrate (FeCl3·6H2O), ethyl orthosilicate (TEOS), anhydrous ethanol (CH3CH2OH), tetramethylammonium hydroxide, polyethylene glycol (PEG-4000), hydrochloric acid (HCl), hydrogen peroxide (H2O2, 30%), and isopropanol (IPA, C3H8OH) were purchased from Sinopharm Chemical Reagent Co. (Shanghai, China); ferrous chloride tetrahydrate (FeCl2·4H2O) and sodium hydroxide (NaOH) were purchased from Xilong Chemical Company Limited (Guangdong, China); ammonia (25%) was purchased from Chongqing Chuandong Chemical Reagent Co. (Sichuan, China); and malachite green (MG) was purchased from Tianjin Chemical Reagent Research Institute (Tianjin, China). Deionized water (0.55 μS cm-1) was used throughout the experiments. Deionized water prepared with HHitech Eco-S15G from Shanghai HHitech Instruments Co., Ltd. (Shanghai, China) was used to prepare the sample solutions and to wash the samples. Preparation of Fe3O4@SiO2 In a 4 mL of hydrochloric acid solution dissolved with 0.886 g (3.28 mmol) FeCl3·6H2O and 0.326 g (1.64 mmol) FeCl2·4H2O, it was rapidly added a certain volume of 1 mol L-1 ammonia under the protection of nitrogen gas, followed by rapid stirring (120 rpm, 60 W) and sonication (40 kHz, 50 W). After mechanical stirring for 30 min, the solution was kept standing and stratifying under the action of an applied magnetic field, and then the upper clear layer was removed. The residual solids were dispersed in deionized water and separated again using an applied magnetic field. This process was repeated until the upper clear layer turned clear. Finally, a bright black Fe3O4 MNPs was obtained. A mass of 30 mg of Fe3O4 was added to 1.5 mL of water and mixed thoroughly. Then 100 mL of IPA was added, and the solution was sonicated for 30 min. Afterwards, 3.0 g PEG-4000 was added and mechanically stirred for 10 min, and 9 mL of water was added and stirred for another 10 min. Then, TEOS was added slowly and stirred for 12 h. In the end, the final mixture was placed in an external magnetic field, removing the upper clear layer. The solid was washed with deionized water, and then removed the upper clear layer again. This process was repeated until the upper clear layer turned clear. Then the residue was sonicated for 1 h, a black solution of Fe3O4@SiO2 MNPs was obtained, and stored at room temperature. Characterization The crystal structures of the prepared materials were characterized by the X-ray powder diffractometer (XRD, MAX-2500, Rigaku, Tokyo Japan). The morphology of the materials was observed by the scanning electron microscopy (SEM, JEM-3010, Shimadzu, Kyoto, Japan). The characteristic functional groups were investigated by the Fourier transform infrared spectrometer (FTIR, Avatar 360, Nicolet, Wisconsin, USA). The absorption spectra were obtained by ultraviolet visible spectrophotometer (UV-Vis, TU-1901, PERSEE, Beijing, China). A nitrogen adsorption/desorption apparatus (ASAP 2460, Micromeritics, Norcross, GA, USA) was employed to evaluate the Brunauer-Emmett-Teller (BET) surface areas distributions of the samples. The magnetic properties of MNPs were investigated using a vibrating sample magnetometer (VSM, VSM 7307, Lake Shore, Ohio, USA). pH was detected by a pH meter (PHS-3E, YOKE, Shanghai, China). Heating and temperature monitoring of solutions were done using thermostatic baths (thermostatic baths, DF-101Z, LICHEN, Shanghai, China). Determination of MG standard working curve The MG standard solutions were prepared at the concentrations of 1, 2, 3, 4, 5, 6 and 7 mg L-1, and the maximum absorption wavelength of 617 nm was selected, and the MG standard working curve was plotted. The MG concentration in the upper clear layer will be calculated by the standard working curve afterwards. Degradation of MG by H2O2 catalyzed under Fe3O4@SiO2 In order to study whether the prepared Fe3O4@SiO2 MNPs would show catalytic properties or not, the degradation of MG by H2O2 in the presence/absence of Fe3O4@SiO2 MNPs was investigated by using UV-Vis spectrophotometer. Two portions of 25 mL MG solution (10 mg L-1) were prepared: one was added with 0.06 g L-1 of Fe3O4@SiO2, while the other contained no Fe3O4@SiO2. Both solutions were then treated with 0.2 mol L-1 H2O2 and subjected to oscillation at 130 rpm for 25 ºC. After a specified reaction time, Fe3O4@SiO2 was separated using a magnetic field, and the upper clear layer was then placed in a spectrophotometer for analysis. At the same time, the concentration of MG in the solution without Fe3O4@SiO2 was measured, which was used to compare with the result obtained from the solution that contained Fe3O4@SiO2. In the experiment, the degradation rate (η) was calculated according to Equation 1:  where C0 (mol L-1) is the initial concentration of MG; Ct (mol L-1) is the concentration of MG at any moment. Condition optimization In order to improve the efficiency of degradation of MG by H2O2 catalyzed under Fe3O4@SiO2, some corresponding parameters were optimized, including the concentration of H2O2, the concentration of Fe3O4@SiO2, the initial concentration of MG, the degradation temperature and the initial pH of MG solution. All of these experiments were carried out according to the same procedure as the above. Reusability experiments The Fe3O4@SiO2 was washed with deionized water to neutral and the magnetic field was applied to separate the Fe3O4@SiO2 and dried under vacuum at 60 ºC to obtain the regenerated catalyst. The regenerated Fe3O4@SiO2 was added to 25 mL of 10 mg L-1 MG solution, the pH was adjusted to 6 with hydrochloric acid solution, and then 1.0 mol L-1 H2O2 was added, and the Fe3O4@SiO2 was separated by an external magnetic field after 5 min. The concentration of MG in the upper clear layer was measured by UV-Vis, and the degradation rate of MG was calculated accordingly and repeated five times. The regeneration performance of Fe3O4@SiO2 catalyst was judged according to the degradation rate.
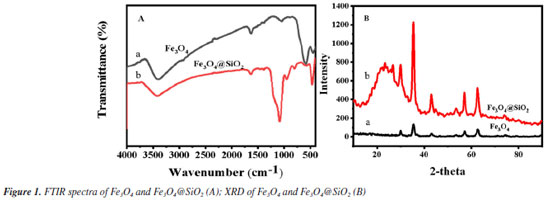
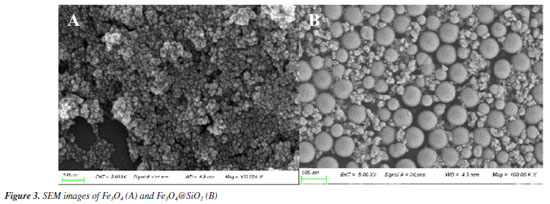
RESULTS AND DISCUSSION Characterization of Fe3O4@SiO2 The structure, morphology and magnetic properties of the prepared Fe3O4 and Fe3O4@SiO2 are investigated by FTIR, XRD, SEM and VSM (Figures 1 to 3).
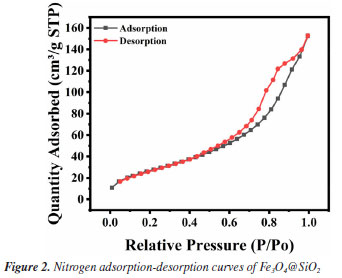
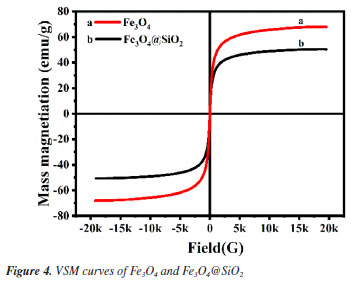
Figure 1A shows the FTIR spectra of Fe3O4 and Fe3O4@SiO2. In Figure 1Aa, the characteristic absorption peak at 582 cm-1 can be attributed to the vibration of Fe−O bond, which proves the successful synthesis of Fe3O4. In Figure 1Ab, 1090 and 944 cm-1 are attributed to the stretching vibration of Si−OH bond; 800 cm-1 is attributed to the bending vibration of Si−O bond; and 464 cm-1 is attributed to the bending vibration of Si−O−Si bond. At the same time, the characteristic absorption peak of Fe−O at 582 cm-1 is blueshifted to 570 cm-1; and the characteristic absorption peak of −OH can be observed at 3450 cm-1. All of these results indicate the formation of Fe−O−Si chemical bond and the successful synthesis of Fe3O4@SiO2. Figure 1B shows the XRD spectrum of the prepared Fe3O4 and Fe3O4@SiO2. In Figure 1Ba, the characteristic peaks located at 30º, 35º, 43º, 53º, 57º and 62º correspond to the (220), (311), (400), (422), (511) and (440) crystal planes of Fe3O4, respectively, which is in accordance with the JCPDS card (No. 88-315). These results imply that the prepared Fe3O4 has a good crystal structure. In Figure 1Bb, the broad and strong diffraction peaks appeared between 20-30º are caused by the amorphous SiO2, while the characteristic peaks of Fe3O4 can still be found, indicating that Fe3O4 has been successfully encapsulated by SiO2 and the crystalline structure has not been changed.27 Nitrogen adsorption-desorption experiments were carried out to evaluate the specific surface area and pore size distribution of Fe3O4@SiO2. The results are shown in Figure 2. The overall shape of the nitrogen adsorption-desorption indicates the presence of micropores and macropores in the catalysts, with an average pore size of 7.4994 nm. Based on the BET theory, the specific surface area of Fe3O4@SiO2 was calculated to be 102.1323 m2 g-1. The results suggest that the high specific surface area of Fe3O4@SiO2 can provide lots of binding sites for the dye molecule MG, which facilitates its adsorption and enrichment and the final quick removal by H2O2.28 Figure 3 shows the SEM images of Fe3O4 (Figure 3A) and Fe3O4@SiO2 (Figure 3B). It can be seen from Figure 3A that Fe3O4 magnetic nanonuclei are well dispersed and uniform in size, about 10 nm. In Figure 3B, the modified Fe3O4@SiO2 MNPs are also uniform spherical particles in size, about 80 nm, bigger with better dispersibility due to the coating of SiO2. Figure 4 shows the VSM diagrams of Fe3O4 and Fe3O4@SiO2. Both of the magnetic hysteresis lines are symmetric to the origin, and the saturation magnetization strengths of the prepared Fe3O4 and Fe3O4@SiO2 are 68.07 and 50.45 emu g-1, respectively. It can be seen compared to Fe3O4, the magnetization value of Fe3O4@SiO2 decreases due to the coating of non-magnetic SiO2. However, it still exhibits strong magnetic properties, which ensures rapid separation under the action of an external magnetic field and provides great feasibility for easy recovery and regeneration required by various applications.
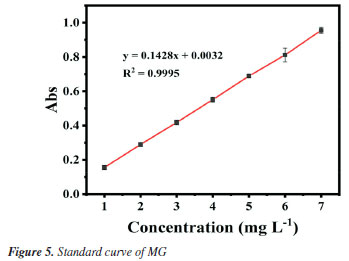
Standard curve for malachite green The working wavelength of malachite green solution was chosen to be 617 nm, and the standard curve was obtained as in Figure 5, with a linear relationship of y = 0.1482x + 0.0032, R2 (coefficient of determination) = 0.9995.
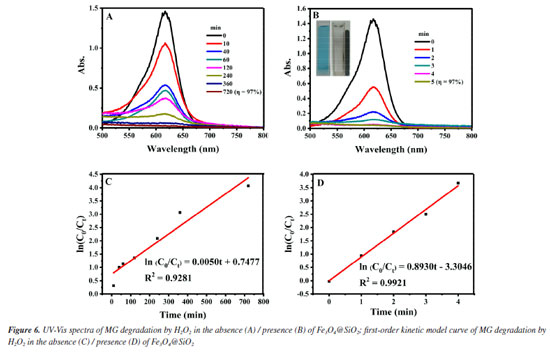
Performance of Fe3O4@SiO2 catalyzed H2O2 degradation of MG As mentioned above, after verifying the good magnetic properties of Fe3O4@SiO2, its catalytic performances for wastewater degradation are studied, and results are shown in Figure 6. Figures 6A and 6B are the UV-Vis spectra of the upper clear layers (see Experimental section), obtained from the reaction systems of the degradation of MG by H2O2 in the presence/absence of Fe3O4@SiO2, respectively. When Fe3O4@SiO2 was added, the degradation rate (η) reached 97% in just 5 min, while it took 720 min to achieve the same rate without the addition of Fe3O4@SiO2. Obviously, the degradation time can be greatly shortened by adding Fe3O4@SiO2, which proves its excellent catalytic properties for MG degradation.
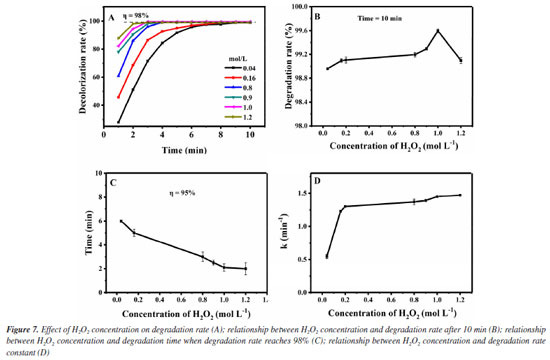
The pseudo-first-order kinetic model is used to better investigate the catalytic effect of Fe3O4@SiO2 on the degradation of MG by H2O2, and the degradation rate is calculated according to the following Equation 2.  where C0 (mol L-1) is the initial concentration of MG; Ct (mol L-1) is the MG concentration at any moment; k (min-1) is the degradation rate constant, and t (min) is the degradation time. Figures 6C and 6D show the diagrams according to Equation 2 for the pseudo-first-order kinetic models in the presence/absence of Fe3O4@SiO2, respectively. It can be seen that the degradation rate constant is only 0.005 min-1 without Fe3O4@SiO2 but 0.893 min-1 with the addition of Fe3O4@SiO2, a great increase of 179 times. This indicates that the prepared Fe3O4@SiO2 has good catalytic performance, and it can effectively catalyze H2O2 to degrade MG at a very rapid speed. After determining the catalytic performance of Fe3O4@SiO2, the degradation conditions are optimized, including the concentration of H2O2, Fe3O4@SiO2 or MG, the degradation temperature and the pH. Condition optimization Firstly, the influence of the concentration of H2O2 in the degradation effect is investigated. It was added 0.12 g L-1 of Fe3O4@SiO2 to 10 mg L-1 of MG solution and H2O2 concentrations were altered from 0.04 to 1.2 mol L-1, at the room temperature and pH 7. The results are shown in Figure 7. Obviously, from Figure 7A, it can be seen that all the investigated concentration of H2O2 (even as low as 0.04 mol L-1) can achieve an MG degradation rate of higher than 98% within 10 min. This is precisely because of the outstanding catalytic effect of the synthetic MNPs Fe3O4@SiO2. For further investigation, data reprocessing and reanalysis on Figure 7A were carried out and the results are shown in Figures 7B-7D. Figure 7B shows the relationship between H2O2 concentration and degradation rate at 10 min of degradation, from which it can be seen that the degradation rate gradually increases as the H2O2 concentration rises to 1.0 mol L-1, and the degradation rate reaches up to 99.6% at 1.0 mol L-1; while the degradation rate gradually decreases after exceeding 1.0 mol L-1, but still remains above 98%. Figure 7C shows the relationship between H2O2 concentration and degradation time when the degradation rate reaches 95%, from which it can be seen that the degradation time shortens rapidly as the H2O2 concentration increases to 1.0 mol L-1, and the degradation time is the shortest at 1.0 mol L-1, even less than 5 min; while the degradation time has no significant change after exceeding 1.0 mol L-1. Figure 7D shows the relationship between H2O2 concentration and degradation rate constant. It can be seen that as the H2O2 concentration increases to 1.0 mol L-1, the degradation rate also goes up and the maximum degradation rate reaches 1.45 min-1; while the degradation rate constant is almost unchanged after exceeding 1.0 mol L-1. These phenomena may be due to the fact that the degradation of MG is achieved through the decomposing of H2O2 into ·OH. When the concentration of H2O2 is low, the amount of ·OH is less, and the degradation rate of MG is low. With the increase of H2O2 concentration and the amount of ·OH, the degradation rate of MG is accelerated, and the degradation time is shortened. Finally, when the concentration of H2O2 increases to a certain extent, excess H2O2 can become a scavenger of ·OH for they can react to form hydroxyl peroxide radical (HOO·), leading to a decrease in the degradation rate of MG.29,30
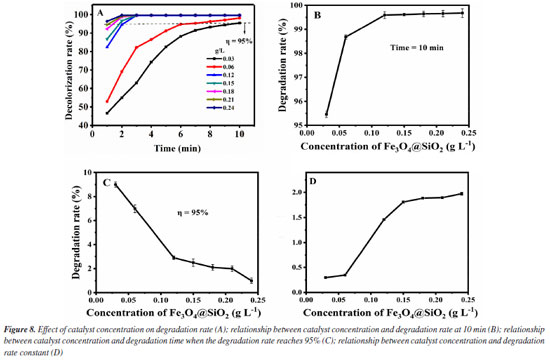
Secondly, the influence of the concentration of Fe3O4@SiO2 in the degradation effect is investigated. It was added 1.0 mol L-1 of H2O2 to 10 mg L-1 of MG solution and Fe3O4@SiO2 concentrations were altered from 0.03 to 0.24 g L-1, at room temperature and pH 7. The results are shown in Figure 8. As can be seen from Figure 8A, the Fe3O4@SiO2 concentration in all studies (even as low as 0.03 g L-1) shows good catalytic effect, which is reflected in the MG degradation rate higher than 95% within 10 min. For further investigation, data reprocessing and reanalysis on Figure 8A were carried out and the results are shown in Figures 8B-8D. Figure 8B shows the relationship between the Fe3O4@SiO2 concentration and the degradation rate at 10 min. Obviously, the degradation rate rises as the concentration of Fe3O4@SiO2 increases and all of them are above 95%. When the Fe3O4@SiO2 concentration is greater than 0.12 g L-1, the degradation rate can even reach higher than 99%. Figure 8C shows the relationship between the Fe3O4@SiO2 concentration and the degradation time when the degradation rate is 95%. The required time of reaching 95% degradation rate keeps shortening with the increase of the Fe3O4@SiO2 concentration, and all of them are less than 10 min. When the concentration is greater than 0.12 g L-1, the required time is even less than 3 min. Figure 8D shows the relationship between the Fe3O4@SiO2 concentration and the degradation rate constant. The degradation rate constant rises quickly before the Fe3O4@SiO2 concentration increases up to 0.12 g L-1, and it rises slowly after exceeding it. These phenomena indicate the excellent catalytic performance of the prepared Fe3O4@SiO2. This catalyst can provide more active centers before its concentration is increased to 0.12 g L-1, leading to faster degradation reactions and greater improvement in degradation rates. Meanwhile, more catalysts can adsorb more MG so as to accelerate its decomposition. When the Fe3O4@SiO2 concentration exceeds 0.12 g L-1, due to the fixed amount of H2O2, no matter how much the catalyst is increased, it can only catalyze a limited amount of H2O2. Therefore, when the catalyst is increased to a certain number, the acceleration in the degradation reaction will slow down.
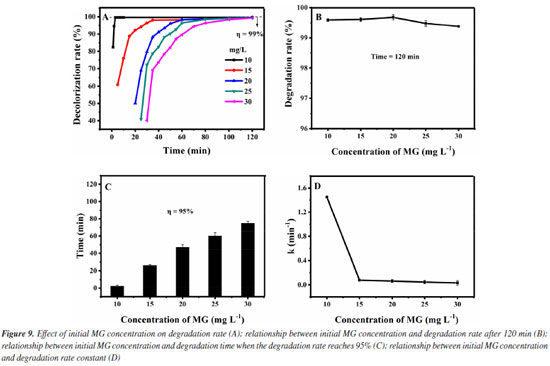
Thirdly, the influence of the initial MG concentrations in the degradation effect is investigated. It was added 1.0 mol L-1 of H2O2 and 0.12 g L-1 of Fe3O4@SiO2 to different initial MG concentrations solutions (10-30 mg L-1), at room temperature and pH 7. The results are shown in Figure 9. As can be seen from Figure 9A, the degradation rate of all the initial MG concentrations studied (even up to 30 mg L-1) can reach more than 99% within 120 min. For further investigation, data reprocessing and reanalysis on Figure 9A were carried out and the results are shown in Figures 9B-9D. Figure 9B shows the relationship between the initial concentration of MG and the degradation rate at the time of 120 min. The degradation rate rises a little bit before the initial MG concentration increases to 20 mg L-1 and the degradation rate reaches 99.7% at 20 mg L-1. After exceeding 20 mg L-1, the degradation rate decreases a little but still remains above 99%. Figure 9C shows the relationship between the initial MG concentration and the degradation time when the degradation rate reaches 95%. As the initial concentration of MG increases to 30 mg L-1, the degradation time keeps prolonging but it is still within 80 min. Figure 9D shows the relationship between the initial MG concentration and the degradation rate constant. Before the initial MG concentration is increased to 30 mg L-1, the degradation rate constant decreases significantly at first, and then remains basically unchanged (0.034 min-1), but is obviously higher than the rate without the use of catalyst (0.005 min-1). With the increase of the initial concentration of MG, the amount of ·OH required for degradation increases, but the amount of ·OH produced by H2O2 decomposition is limited. Therefore, when the initial concentration of MG exceeds a certain value, the amount of hydrogen peroxide that it can consume is still limited, so the change of the initial MG concentration no longer significantly affects the degradation rate.
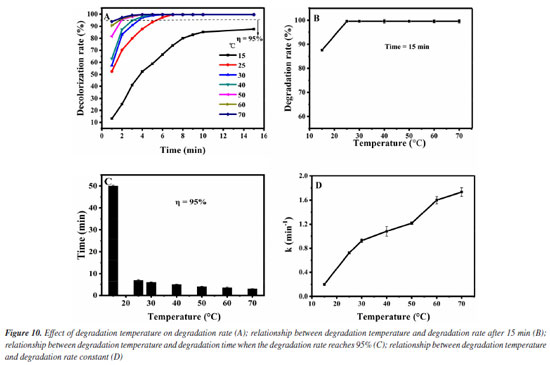
Then, the influence of the degradation temperature in the degradation effect is investigated. It was added 1.0 mol L-1 of H2O2 and 0.12 g L-1 of Fe3O4@SiO2 to 10 mg L-1 of MG solution, at pH 7 and different temperatures (15-70 ºC). The results are shown in Figure 10. As can be seen from Figure 10A, the degradation rate of MG can reach more than 95% within 15 min when the degradation temperature is above 25 ºC. For further investigation, data reprocessing and reanalysis on Figure 10A were carried out and the results are shown in Figures 10B-10D. Figure 10B shows the relationship between the degradation temperature and the degradation rate at 15 min. Before the degradation temperature is increased to 70 ºC, the degradation rate rises significantly at first and then remains basically unchanged, and all the degradation rates can reach more than 99% when the temperature is above 25 ºC. Figure 10C shows the relationship between the degradation temperature and the degradation time when the degradation rate is 95%. With the temperature rising to 70 ºC, the degradation time is continuously shortened, all within 10 min. Figure 10D shows the relationship between the degradation temperature and the degradation rate constant. The degradation rate constant increases with the temperature rising to 70 ºC, and are all greater than 0.2 min-1. It can be seen that the catalyst still has high activity when the temperature is 70 ºC, indicating that the catalyst has good stability. These phenomena may be due to the fact that with the increase of temperature, the molecular motion speed is accelerated, which increases the chance of MG molecules colliding with Fe3O4@SiO2 surface and H2O2, thus improving the degradation rate of MG. As is well known to us, higher reaction temperatures can provide more energy to overcome the activation energy barrier. The rate of decomposition of H2O2 into •OH increases exponentially with the increase of reaction temperature. Therefore, as the temperature increases, more ·OH will be produced in the system, so the degradation effect of MG will naturally be better. Therefore, it seems that the degradation temperature of 70 ºC is the best, but considering that the degradation rate at 25 ºC has reached 99%, increasing the temperature will also increase the cost and operation difficulty, so we believe that room temperature can be selected as the degradation temperature of MG.
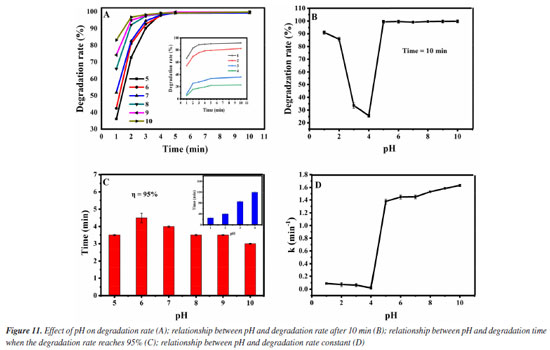
Lastly, the influence of the pH value in the degradation effect is investigated. It was added 1.0 mol L-1 of H2O2 and 0.12 g L-1 of Fe3O4@SiO2 to 10 mg L-1 of MG solution, at the room temperature and at different pH (1-10). The results are shown in Figure 11. It can be seen from Figure 11A that under all pH conditions tested, MG degradation can reach equilibrium within 10 min. Figure 11B shows the relationship between the degradation pH and the degradation rate at 10 min. When the pH value increases from 1 to 4, the degradation rate of MG gradually decreases within 10 min, especially when pH is 4, the degradation rate is only 22.7%. When the pH value increases from 4 to 10, the degradation rate first rises remarkably and then remains basically unchanged, and when the pH is 10, the degradation rate is the highest, reaching 99.8%. Figure 11C shows the relationship between the degradation pH and the degradation time when the degradation rate reaches 95%. When the pH value increases from 1 to 4, the degradation time exceeds 20 min, especially when pH is 4, the degradation time is as long as 120 min. When the pH value is increased from 5 to 10, the degradation time is less than 5 min, and when the pH value is 10, the degradation time is the shortest, even less than 3 min. Figure 11D shows the relationship between the pH value and the degradation rate constant. When the pH value increases from 1 to 4, the degradation rate constant is lower than 0.08 min-1, especially when pH is 4, the degradation rate constant is as low as 0.01 min-1. When the pH value increases from 5 to 10, the degradation rate constant is greater than 1 min-1, especially when pH is 10, the degradation rate constant is as high as 1.5 min-1. This indicates that the catalyst Fe3O4@SiO2 can maintain good activity in a wide range of pH values. The phenomena from pH 1 to 4 can be explained by the existence of the surface zero point of charge (pHzpc) of Fe3O4@SiO2 (about 2.8-3.4). When pH < pHzpc, the surface of Fe3O4@SiO2 is positively charged, which will repel the positively charged MG, and the closer the pH is to pHzpc, the stronger the repulsive force will be. Therefore, in the range of pH 1 to 4, the degradation rate of MG gradually decreases. When pH > pHzpc, the surface of Fe3O4@SiO2 is negatively charged, which can attract positively charged MG, leading to the increase in the degradation rate of MG in the pH range of 5-10.
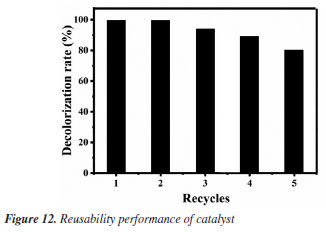
Reusability experiments After optimizing the degradation conditions of MG oxidized by H2O2 under the catalyzation of Fe3O4@SiO2, the reusability of the catalyst is investigated, and the results are shown in Figure 12. It can be seen that the degradation rate can still reach more than 80% after 5 cycles, indicating the outstanding reusability of the prepared Fe3O4@SiO2 MNPs. Combined with its good catalytic performance and unique characteristics of easy separation in magnetic field, its application in the treatment of industrial dye wastewater will have excellent economic value and important environmental significance.
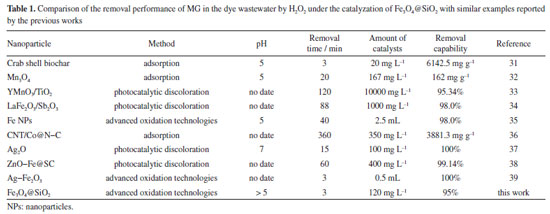
Comparative study and limitations In this study, the removal performance of MG in the wastewater by the Fenton-like reaction has been compared. The experimental conditions such as removal time, amount of catalysts, pH, and maximum removal capacity are listed in Table 1. It is found that Fe3O4@SiO2 has an outstanding catalytical effect to enhance the degradation efficiency of MG by H2O2. In this paper, a low dose of remover is used, which can save materials and reduce costs. Moreover, the time required for the 95% removal of MG by H2O2 under the catalyzation of Fe3O4@SiO2 is only 3 min, greatly reducing the time cost and enhance the removal efficiency. All of these results indicate that Fe3O4@SiO2 can be used as a promising catalyst to catalyze H2O2 for the treatment of MG in real wastewater.
CONCLUSIONS In this study, Fe3O4@SiO2 is used to catalyze the rapid and efficient degradation of MG by H2O2. Firstly, the structure, morphology and magnetic properties of the catalyst Fe3O4@SiO2 are characterized by FTIR, XRD, VSM, SEM. Then, systematical investigations about this degradation reaction are carried out by UV-Vis, including the mechanism, the kinetic model and the optimization of degradation conditions. Results show that under the optimal conditions of C (H2O2) = 1.0 mol L-1, C (Fe3O4@SiO2) = 0.12 g L-1, C0 (MG) = 10 mg L-1, at room temperature and at pH 5-10, Fe3O4@SiO2 can efficiently catalyze MG degradation by H2O2 and the degradation time to reach 95% degradation rate is less than 3 min. The catalyst can be separated quickly under the applied magnetic field, and the degradation rate is 82% after 5 times of recycling. Compared with no catalyst, the degradation time is greatly shortened and the degradation efficiency is significantly improved. Under acidic or alkaline conditions, the catalyst exhibits good performance at both room temperature and higher temperature. In conclusion, the new process of Fe3O4@SiO2 catalyzed H2O2 degradation of MG wastewater developed in this paper is convenient, rapid, economical and environmentally friendly, and is expected to be widely used in the treatment of industrial dye wastewater under various complex conditions.
ACKNOWLEDGMENTS This research was funded by the National Nature Science Foundation of China (NSFC No. 21505005), Hunan Provincial Natural Science Foundation (No. 2018JJ2424), International Cooperative Project for “Double First-Class”, CSUST (2019IC21). No potential conflict of interest was reported by the authors. All data generated or analyzed during this study are included in this published article.
REFERENCES 1. Abdelhamid, H. N.; Dalton Trans. 2023, 52, 2506. [Crossref] 2. Xiong, H.; Shi, K.; Han, J.; Cui, C.; Liu, Y.; Zhang, B.; Environ. Sci. Pollut. Res. 2023, 30, 59366. [Crossref] 3. Renda, C. G.; Goulart, L. A.; Fernandes, C. H. M.; Mascaro, L. H.; de Aquino, J. M.; Bertholdo, R.; J. Environ. Chem. Eng. 2021, 9, 104934. [Crossref] 4. Mahmoud, S. M.; Ammar, S. H.; Ali, F. D.; Ali, N. D.; J. Iran. Chem. Soc. 2023, 20, 1135. [Crossref] 5. Takdastan, A.; Pourfadakari, S.; Yousefi, N.; Orooji, N.; Desalin. Water Treat. 2020, 197, 402. [Crossref] 6. Nas, M. S.; Kaya, H.; Inorg. Nano-Met. Chem. 2021, 51, 614. [Crossref] 7. Zhang, F.; Xue, X.; Huang, X.; Yang, H.; J. Mater. Sci. 2020, 55, 15695. [Crossref] 8. Barakat, M. A.; Kumar, R.; Lima, E. C.; Seliem, M. K.; J. Taiwan Inst. Chem. Eng. 2021, 119, 146. [Crossref] 9. Cen, H.; Nan, Z.; J. Phys. Chem. Solids 2018, 121, 1. [Crossref] 10. Mansur, A. A. P.; Leonel, A. G.; Krambrock K.; Mansur, H. S.; Catal. Today 2022, 397, 129. [Crossref] 11. Angamuthu, M.; Satishkumar, G.; Landau, M. V.; Microporous Mesoporous Mater. 2017, 251, 58. [Crossref] 12. Hu, X.; Liu, B.; Deng, Y.; Chen, H.; Luo, S.; Sun, C.; Yang, P.; Yang, S.; Appl. Catal., B 2011, 107, 274. [Crossref] 13. Zhang, M.; Niu, Y.; Xu, Y.; J. Colloid Interface Sci. 2020, 579, 269. [Crossref] 14. Bai, J.; Wang, L.; Wu, J.; Zhang, X.; Liu, B.; Mao, Y.; Gao, H.; Li, S.; Zhu, X.; Wang, X.; Water, Air, Soil Pollut. 2023, 234, 1871. [Crossref] 15. Ye, L.; Zhu, P.; Wang, T.; Li, X.; Zhuang, L.; Nanoscale Adv. 2023, 5, 4852. [Crossref] 16. Ahmadian, M.; Derakhshankhah, H.; Jaymand, M.; J. Ind. Eng. Chem. 2023, 124, 102. [Crossref] 17. Goswami, R.; Mishra, A.; Prasad, B.; Bhatt, N.; Water, Air, Soil Pollut. 2023, 234, 1972. [Crossref] 18. Mehdinia, A.; Shilsar, S. M. S.; Mozaffari, S.; Abedi, S.; J. Iran. Chem. Soc. 2023, 20, 1073. [Crossref] 19. Hassan, A. F.; El-Naggar, G. A.; Braish, A. G.; El-Latif, M. M. A.; Shaltout, W. A.; Elsayed, M. S.; Int. J. Biol. Macromol. 2023, 249, 126075. [Crossref] 20. Zhao, S.-S.; Ma, C.-J.; Xu, Y.; Tan, X.-C.; Wang, Q.; Yan, J.; Microchim. Acta 2023, 190, 200. [Crossref] 21. Shetty, B.; Yashodha, S. R.; Johns, J.; Fibers Polym. 2023, 24, 1297. [Crossref] 22. Çiftçi, G.; Türkeli, U. D.; Özen, E. Y.; Özdemir, M.; Sanin, F. D.; İmamoğlu, İ.; Water Sci. Technol. 2023, 87, 1072. [Crossref] 23. Aridi, A.; Basma, H.; Chehade, W.; Hassan, R. S.; Yaacoub, N.; Naoufal, D.; Awad, R.; Environ. Sci. Pollut. Res. 2023, 30, 58399. [Crossref] 24. Zheng, C.; Chen, J.; Ling, Y.; Zhang, Z.; Microchem. J. 2024, 205, 111299. [Crossref] 25. Du, H. Y.; He, L.; Zhang, M.; Manyande, A.; Chen, H.; Journal of Food Measurement and Characterization 2023, 17, 3368. [Crossref] 26. Wang, J.; Hong, C.; Lin, Z.; Huang, Z.-Y.; J. Food Drug Anal. 2022, 30, 369. [Crossref] 27. Ji, X.; Qiao, R.; Xu, Z.; Liu, J.; Ma, Q.; Yuan, H.; Xing, H.; J. Mater. Sci.: Mater. Electron. 2024, 35, 1912. [Crossref] 28. Cai, X.; Zhang, Y.; Hu, H.; Huang, Z.; Yin, Y.; Liang, X.; Qin, Y.; Liang, J.; J. Cleaner Prod. 2020, 258, 120741. [Crossref] 29. Hou, K.; Wang, G.; Zhu, Y.; Ezzatahmadi, N.; Fu, L.; Tang, A.; Yang, H.; Xi, Y.; Appl. Clay Sci. 2019, 181, 105243. [Crossref] 30. Ansari, M. S.; Rases, K.; Khan, M. A.; Rafiquee, M. Z. A.; Otero, M.; Polymers 2020, 12, 2246. [Crossref] 31. Wu, J.; Yang, J.; Feng, P.; Wen, L.; Huang, G.; Xu, C.; Lin, B.; J. Ind. Eng. Chem. 2022, 113, 206. [Crossref] 32. Van Tran, T.; Nguyen, D. T. C.; Kumar, P. S.; Din, A. T. M.; Qazaq, A. S.; Vo, D.-V. N.; Environ. Res. 2022, 214, 113925. [Crossref] 33. Yulizar, Y.; Abdullah, I.; Surya, R. M.; Alifa, N. L.; J. Environ. Manage. 2023, 342, 118139. [Crossref] 34. Jabeen, S.; Ganie, A. S.; Ahmad, N.; Hijazi, S.; Bala, S.; Bano, D.; Khan, T.; Inorg. Chem. Commun. 2023, 152, 110729. [Crossref] 35. Puthukkara, P. A. R.; Jose, T. S.; Lal, S. D.; Mater. Today Commun. 2022, 33, 104759. [Crossref] 36. Jiang, J.; Song, W.; Zhang, M.; Feng, Y.; Bai, H.; Zhang, H.; Yu, K.; Kan, G.; Liu, B.; Jiang, Y.; ACS Appl. Nano Mater. 2023, 6, 12882. [Crossref] 37. Khattak, R.; Begum, B.; Qazi, R. A.; Gul, H.; Khan, M. S.; Khan, S.; Bibi, N.; Han, C.; Rahman, N. U.; Catalysts 2023, 13, 227. [Crossref] 38. Jing, H.; Ji, L.; Li, Z.; Wang, Z.; Li, R.; Ju, K.; Biochar 2023, 5, 1. [Crossref] 39. Kolya, H.; Kang, C.-W.; Sustainability 2022, 14, 15800. [Crossref]
Associate Editor handled this article: Lucia Mascaro |
On-line version ISSN 1678-7064 Printed version ISSN 0100-4042
Qu�mica Nova
Publica��es da Sociedade Brasileira de Qu�mica
Caixa Postal: 26037
05513-970 S�o Paulo - SP
Tel/Fax: +55.11.3032.2299/+55.11.3814.3602
Free access


