
 |
 |
 |
 |
 |
Artigo
| Technological advances in electroplating: artificial intelligence to predict zinc coating thickness on SAE 1008 low carbon steels |
|
Luciano M. L. de OliveiraI,* I. Instituto Federal de Educação, Ciência e Tecnologia do Rio Grande do Sul (IFRS), 95043-700 Caxias do Sul - RS, Brasil Received: 08/18/2024 e-mail: lucianomlo@gmail.com This study presents an artificial intelligence (AI)-based approach for predicting the thickness of electrodeposited zinc coatings on low carbon steel. The thickness of the coating is directly related to the corrosion resistance of the steel, according to the ABNT NBR 10476. The study investigates the influence of process time, ZnO/NaOH concentrations, anode material, and additives on coating thickness measured by X-ray fluorescence, employing the Hull cell method and a fractional factorial design. Statistical analysis and supervised machine learning algorithms, including multivariate regression, random forest, and extreme gradient boosting (XGBoost), were employed to develop prediction models. Among these models, XGBoost demonstrated superior performance with a coefficient of determination (R2) of 0.95 and a mean squared error (MSE) of 0.815, highlighting the effectiveness of AI in comparison to traditional regression methods. The AI models developed provide a valuable tool for the electroplating industry. They allow for the optimization of input parameters to achieve desired coating thicknesses and improve corrosion resistance. This ultimately reduces costs and improves product quality. INTRODUCTION To prevent corrosion, permanent coatings are applied to metals. Electroplating, also known as galvanizing, is one of the methods used to apply metallic coatings to the metal to be protected. This process involves immersing the metal to be protected, such as steel, in an electrolyte containing the salt of the desired metal, such as zinc or a metal alloy, and applying a constant cathodic potential to this metal from a direct voltage source. The effectiveness of a zinc coating in protecting the metal in a specific environment is directly related to its deposited thickness. It is therefore essential to control the process parameters to guarantee the quality of the part in terms of corrosion resistance.1,2 Various electrolyte formulations are available for electroplating. However, creating the best composition, which guarantees an adequate deposition and layer, through traditional experiments, carrying out one factor at a time, can be very time-consuming. A promising alternative for detecting the effect of parameters on process operation is the machine learning (ML) method.3 Machine learning is a subfield of artificial intelligence (AI) that allows computers to learn from data to perform specific tasks. The practice of machine learning consists of applying algorithmic models to data interactively, allowing the computer to identify hidden patterns or trends, which in turn can be used to make predictions.4 ML methods are suitable for developing predictive models in cases where a large data set is available, the outcome to be predicted depends on several variables, and when a mechanistic model of the relationship between the input variables and the outcome is not well established.5 Although machine learning has gradually been applied to corrosion research, the corrosion community has still benefited little from the progress of Big Data technologies.6 The ML (AI) algorithms used in this work were linear regression, random forest (RF) and extreme gradient boosting (XGBoost). Linear regression is a basic method in machine learning and statistics. It models the relationship between a dependent variable and one or more independent variables using a linear equation. Although useful for identifying basic trends and simple relationships (e.g., impact of current density (CD) on coating thickness), its lesser ability to model non-linear interactions limits its application in complex electroplating processes involving multiple factors, compared to the other models considered in the work.4,5,7,8 Random forest is a cluster learning method based on decision trees. It uses a mechanism to combine the predictions of multiple decision trees, each trained on a random subset of the data. RF is a solid choice for scenarios that require a balance between accuracy and interpretability. It effectively models non-linear interactions between variables such as current density, time and additive concentration, but can struggle with very high dimensional data.4,5,7,8 XGBoost is an advanced clustering algorithm designed for classification and regression. It builds decision trees iteratively (boosting) to minimize prediction errors. XGBoost is a highly advanced boosting algorithm with regularization, designed for maximum predictive power. It performs exceptionally well in complex, noisy datasets and offers built-in mechanisms to reduce overfitting. Nevertheless, it comes with high computational demands and reduced interpretability compared to the other models. Overall, linear regression is ideal for simpler, more interpretable tasks, random forest provides a balance of flexibility and robustness, and XGBoost delivers superior accuracy for demanding prediction problems, albeit at the cost of complexity and computational requirements.4,5,7,8 In the study of electroplating, XGBoost, with its regularization and advanced tree-based learning, is ideal for achieving high predictive accuracy. Its ability to deal with non-linearity, avoid overfitting and model complex interactions makes it suitable for the nature of the data analyzed.4,5,7,8 The aim of this work was to create a prediction model using artificial intelligence to predict the thickness of the electrodeposited zinc surface layer on low carbon steel substrates, based on variations in the parameters of the zinc electroplating process. The characterization of the material in relation to the thickness of the electrodeposited zinc coating is directly related to its resistance to corrosion in accordance with the ABNT NBR 10476.1 For this characterization, a test was carried out to measure the thickness of the layer using X-ray fluorescence.9 The innovation of this work is related to the application of known AI algorithms to the traditional zinc electroplating process to predict the main output variable of this process (thickness of the galvanized zinc layer) based on the seven main input variables: electroplating time, concentrations in the electrolyte of ZnO, NaOH, additives (Purifier, Base 250 and Brightener) and anode material, in order to bring together two known methods for this parameterization of the electroplating process that is not yet present in the Brazilian industry. As depicted in the Figure 1, this visual representation outlines the principal steps and key aspects of the proposed prediction model utilizing AI for the electrodeposition of zinc on low carbon steel substrates.
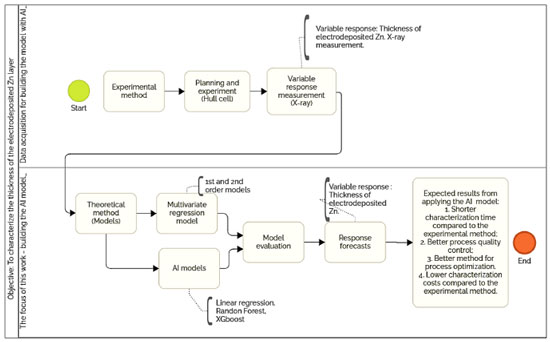 Figure 1. AI-based prediction model for zinc electrodeposition on low-carbon steel substrates
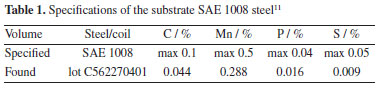
EXPERIMENTAL Material For the samples, in this work referred to as substrate, the alloy used as the base material (substrate) for electroplating was SAE 1008 low carbon steel, specifications shown in Table 1. The 0.9 mm thick sheet was laser cut to 100 mm × 70 mm.
Two types of anodes were used in the experiments. Anode 1, made of SAE 1008 steel, dimension 70 mm × 50 mm, same material as the substrate, according to the literature,10 in the Hull cell test procedure. Anode 2, 99.92% pure zinc, according to energy dispersive X-ray (EDX) spectroscopic analysis, dimension 80 mm × 50 mm × 4 mm. The use of a soluble anode (zinc) and an insoluble anode (steel) in the process was trialed in the laboratory to see if this variable had any significance on the electrodeposited thickness. In industry, steel is used as the anode because it is insoluble. The zinc for electrodeposition is entirely in the electrolyte.10 The chemical substances used to prepare electrolyte solutions for electroplating were zinc oxide (ZnO, 80.7% pure), sodium hydroxide (NaOH, 97.5% pure), and commercial solutions, as leveling additives so called Base 250, commercial purifiers so called Purifier 1 and Purifier 2, and a brightener solution so called Brightener 250, purchased from a company that manufactures chemical products for surface treatment in Caxias do Sul, RS, Brazil. The working electrolyte chosen was alkaline, based on sodium hydroxide (NaOH), because it is used commercially in the industry (a galvanic plant in the city of Caxias do Sul, RS, Brazil) where we would check the efficiency of the model applied in electrolyte production. The average pH of the solutions measured experimentally in the laboratory was 14.15. Acid zinc electroplating processes, based on chlorides and sulfates, are highly sensitive to impurities, corrosive and require a more complex infrastructure than alkaline processes.12 Methods Planning the experiment The fractional factorial design method was used to carry out the experiments. 2k-p was used for the study, where k is the number of factors that vary between 2 established levels.13 According to Grömping,14 the 7 factor experiment with 16 iterations has IV resolution. This type of design is useful in factor selection experiments because it provides good information about the main effects and some information about all the second-order interactions.13 The experimental design was carried out using the FrF2 package written in the R programming language, in software RStudio,15 of the 1/16 fractional factorial type, with IV resolution, totalling 2(7-4) 16 iterations. Substrates were taken in duplicate, totaling 32 for the experiment. Electroplating experiment The experiment was carried out using the Hull cell method, with a volume of 250 mL. This is a bench-top cell capable of producing a wide range of current densities in a cathode panel.16 According to the diagram of the Hull cell shown in Figure 2, the indicated region of high current density (HCD) and low current density (LCD) can be observed.
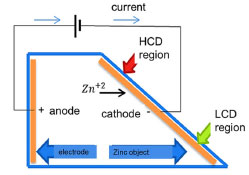 Figure 2. Schematic diagram of the Hull cell
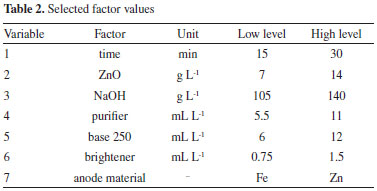
It was used the basic procedure for carrying out a Hull cell test described by Sillos.10 The input variables used for electrodeposition experiments were selected based on technical bulletin from the manufacturer of the chemical products and are described in Table 2.
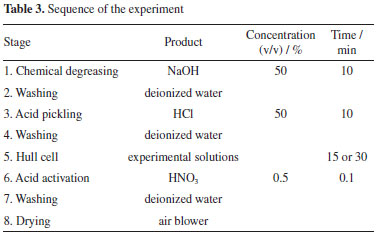
The process steps were carried out at room temperature (20 ± 2 °C). The experiments were executed according to the steps described in Table 3.
In the electrodeposit stage, the substrate was immersed in the electrolytic process in the Hull cell. For electroplating, a rectifier current source was used to supply electricity. In order to optimize the iterations, three Hull cells were used in parallel. Figure 3 shows the experiment. The iterations were randomized, and the same solutions did not occur simultaneously or successively.
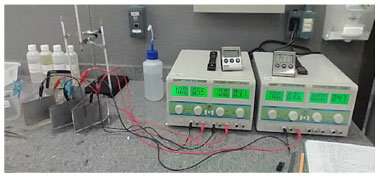 Figure 3. Hull cell experimental iterations
Figure 4 illustrates a substrate after the electroplating process, with the lower part electroplated with zinc and the upper part, the substrate without a layer.
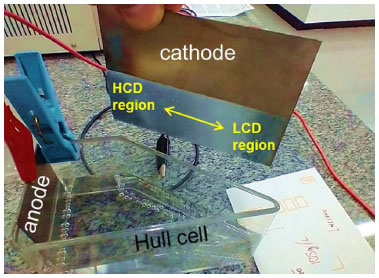 Figure 4. Substrate after electrodeposition in a Hull cell
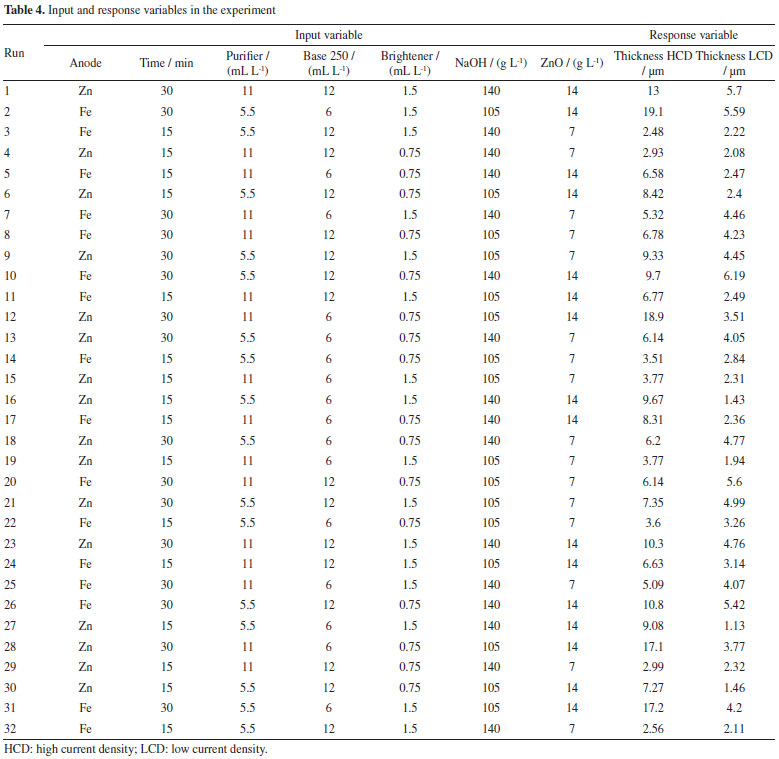
In this work, a benchtop digital power supply, model FA-3030, manufactured by Instrutherm was used. This power supply has two independent channels that allow precise and continuous adjustment of both the output voltage and current, with accuracy of ±1 and ±2%, respectively. Voltage and current stability is guaranteed by line and load regulation circuits, with extremely low ripple and noise.17 The thickness of the zinc coating was measured using a Fischerscope® XRAY XAN 215 X-ray apparatus at two points on the electrodeposited substrate, in the HCD and LCD regions. Obtaining the values of the input and response variables The experiment allowed to measure the thickness of the electrodeposited zinc coating at two points on each of the 32 substrates. One point in the LCD region and the other in the HCD region, totaling 32 measurements for each region or 64 total measurements. The data was tabulated and used to generate the zinc coating thickness prediction models. Table 4 illustrates the first 2 iterations (substrates) of the experiment. The last two columns are the response variables.
Forecasting models and performance evaluation methods Experimental data from the laboratory was used and five regression models were employed, including two analytical models (first- and second-order multivariate regression) and three machine learning models (linear regression, random forest and XGBoost) to predict the thickness of the zinc coating. The results of the models were compared with experimental measurements to assess the accuracy of the predictions. Given the knowledge of the input and output variables in our experimental system, supervised machine learning algorithms were applied. Initially, first- and second-order multivariate regression analytical methods were used as approximations, since the true functional relationship between Y and the variables x1, x2, ..., x_k was unknown. To check whether there was a linear relationship between Y and the independent variables, the regression significance test was applied using analysis of variance (ANOVA) to assess the significant contribution of each independent variable to the model.13 After creating the analytical models, as proposed in this work, AI methods were used with the linear regression, random forest and XGBoost (XGB) algorithms. To compare the performance of the models, the coefficient of determination (R2) was used as a global statistic to assess the fit of the model. The R2 ranges from 0 to 1, with 1 being the perfect fit of the model, representing 100% of the variability in the response.13 The mean squared error (MSE) was also used to compare the AI models. MSE reflects the mean square difference between experimental and predicted values, with a low MSE indicating a low error rate.18 The flowchart of the work steps is shown in Figure 5.
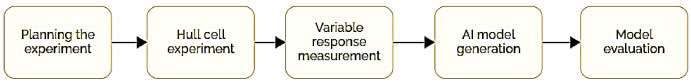 Figure 5. Flow of work stages
RESULTS AND DISCUSSION The aim of this work was to develop a model using AI to predict the thickness of the electrodeposited zinc coating. Different prediction methods were used to compare their performance and choose which of these models best fitted the experimental data. As a result, one of the AI models was found to have the best fit to the experimental data. Considering that in the industry some process parameters are known, and others do not have a practical quantitative analysis, as is the case of additives, an analysis was carried out to identify which ones have the greatest influence on the response variable, the thickness of the electrodeposited layer, through analysis of variance in multiple regression models. It can be seen that most of the process parameters that influence the thickness of the zinc coating can be measured and known. The experiments were carried out with a variation of seven factors at two levels. This was important in order to provide various electrolyte configurations as input data for generating the models. In practical terms, it would be difficult to set up such configurations in industrial production tanks. According to the ABNT NBR 10476,1 the thickness of the zinc layer is decisive for the corrosion resistance of steel, so its measurement indicates the efficiency of industrial process control. Therefore, predicting this response variable can anticipate corrections and adjustments in the process to meet technical specifications for layer thickness, avoiding rework or quality problems in the field, which can have a severe impact on costs. Multivariate regression models Multivariate regression models were employed as a pre-analysis step to evaluate their predictive performance and compare them against AI-based methods. Additionally, these models facilitated statistical observations. First- and second-order regression models were constructed using the lm( ) function in the R programming language.15 In this analysis, the response variable Y represented the thickness of zinc coatings electrodeposited on both the HCD and LCD (totaling 64 data points). The X input variables were the factors and their respective level values derived from the experimental design. Model validation was carried out using ANOVA, with the F-test verifying the significance of the variables in influencing the regression estimates. Figure 6 illustrates the linear regression between the predicted and experimental zinc layer thicknesses for the first-order regression model. The input variables from the design of the experiment were used to generate this model, which serves to establish how accurately the predictions align with the experimental results. The regression equation is represented as:  The R2 = 0.6944 indicates a moderate correlation between the predicted and experimental thicknesses. The results demonstrate that the first-order regression model provides a reasonable approximation but leaves room for improvement in capturing the experimental trends. Figure 7 displays the linear regression for the second-order regression model. This model demonstrates an improved alignment between predicted and experimental values, with the regression equation:  The R2 = 0.9424 indicates a strong correlation, highlighting the superior predictive capability of the second-order model compared to the first-order model. The incorporation of higher-order terms clearly enhances the accuracy of the model, as reflected by the closer clustering of data points around the regression line. Figures 6 and 7 provide a comparative insight into the performance of the first- and second-order multivariate regression models. The progression from the first- to the second-order model highlights the benefits of incorporating interaction effects, resulting in a substantially improved fit to the experimental data.
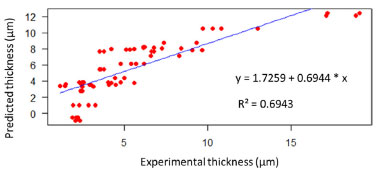 Figure 6. Linear regression and first-order model between predicted (Y-axis) and experimental layer thickness (X-axis), generated in RStudio15
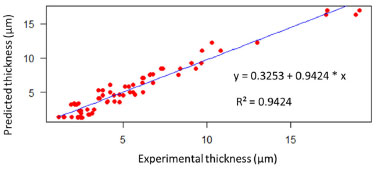 Figure 7. Linear regression and second-order model between predicted (Y-axis) and experimental layer thickness (X-axis), generated in RStudio15
Variables with a significant influence on the response of the model The F-test, carried out in the FrF2 package, showed which variables in the regression had a significant influence on the estimate. For the first-order regression the parameters of time, ZnO and CD were the ones that most influenced the zinc coating thickness. For the second-order regression, the parameters of time, ZnO, NaOH, current density (DC), as well as the interactions time/DC, Base 250/DC, NaOH/DC and ZnO/DC, had the greatest influence on zinc coating thickness. Machine learning models (AI) Orange Data Mining19 software was used to generate the AI models. Figure 8 shows the flowchart in the software.
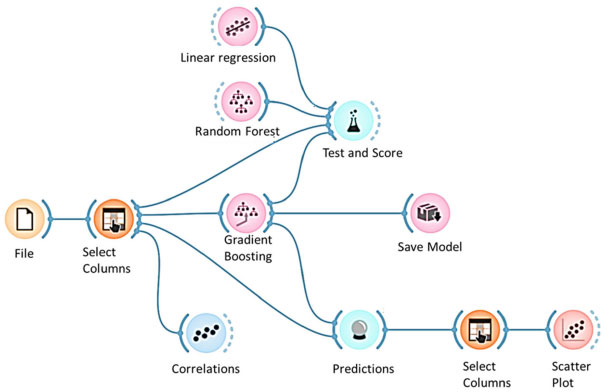 Figure 8. Flowchart for choosing the artificial intelligence algorithm (generated in Orange Data Mining)19
The first FILE step is to import the data. Next, the models generated by each of the chosen algorithms are evaluated and compared using the R2 and MSE metrics in TEST and SCORE. The algorithms chosen were: linear regression, as it is the one found in the FrF2 package, random forest, and gradient boosting.7,20-22 Figure 9 shows the method chosen for the XRB algorithm. This method was chosen because Katirci et al.7 pointed out in his conclusion that this was the best method verified in his work.
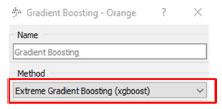 Figure 9. Method chosen for the gradient boosting algorithm (generated in Orange Data Mining)19
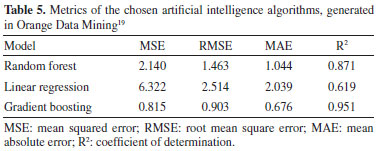
Table 5 shows through comparative metrics that XGB was the algorithm that generated the best model.
As XGB was the best algorithm, its generated model was used to make predictions using PREDICTIONS. Next, we plotted the XY dispersion, shown in Figure 10, which relates the experimental layer thickness to the layer thickness predicted using the model created by XGB, with the SCATTER PLOT step.
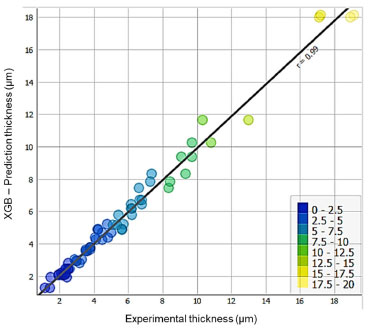 Figure 10. Linear regression of the layer thickness predicted with the XGB algorithm in relation to the experimental one (generated in Orange Data Mining)19
Evaluation of AI-generated models Through the comparative metrics between the three proposed AI algorithms, XGB had the highest R2 = 0.95. This means that the model explains 95 per cent of the variability in the data. The MSE = 0.815 means that there is a low dispersion of error between the prediction and the experimental response. These analyses indicate that the model is valid for predicting the thickness of the electrodeposited zinc coating under the conditions outlined in the experiment. Comparison between the analytical (multiple regression) and AI (XGBoost) models Considering the results of layer thickness predicted in the HCD and LCD regions, for the second-order linear regression model, whose performance was better than the first-order model, verified by the higher R2, generated by the FrF2 package in R language,15 with a coefficient of determination equal to 0.94, when compared with the AI model generated by the XGB algorithm in the Orange Data Mining software,19 it can be seen in Figure 11, its better performance with a R2 = 0.95.
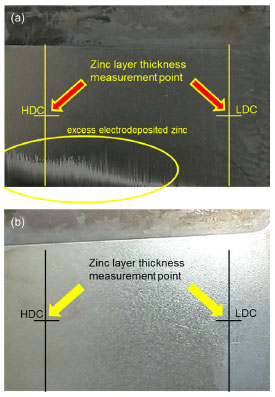 Figure 11. Macroscopic visual characterization of two electroplated substrates from the experiment. (a) Galvanized substrate with a non-uniform visual appearance of the electrodeposited layer, with a matte appearance and the formation of a coarse deposit in the high current density zone, characteristic of problems in the experimental conditions related to the variables and the electrolyte. (b) Galvanized substrate with a uniform visual appearance of the electrodeposited layer and a more open shine, characteristic of the optimal experimental conditions and the ideal condition of the electrolyte
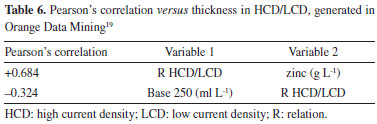
The results showed that the AI algorithm XGB stood out from the rest, providing the highest R2 values and the lowest MSE values for predicting the thickness of the zinc coating. This superior performance of XGB reinforces the ability of AI techniques to tackle complex problems such as electroplating low carbon steel. Relationship between thickness in the HCD and LCD regions This ratio is a parameter, calculated from the Hull cell experiment, which can indicate the quality of the electrolyte. The ratio between layer thickness measurements in the HCD and LCD regions can indicate excess (ratio below 1.8), lack (ratio above 2.2) or adequate quantity (ratio between 1.8 and 2.2) of the layer levelling additive (Base additive 250).10 Using the data from the experiment, and placing the relationship between HCD and LCD thickness as the response variable, Pearson's correlation was analyzed using the Orange Data Mining software.19 The correlation coefficient, also called Pearson's correlation coefficient, is a quantitative measure of the strength of the linear relationship between two random variables X and Y. If the two variables are perfectly linearly related with a positive slope, r = +1, and if they are perfectly linearly related with a negative slope, r = -1. If no relationship exists between the variables, r = 0.13 Based on the experiment, the variable with the highest correlation with the HCD/LCD ratio was the concentration of ZnO in the solution, with a Pearson coefficient = +0.684, a moderately strong correlation. The levelling additive (Base 250) is the second variable with the highest correlation with the HCD/LCD ratio, with Pearson coefficient = -0.324, a moderately weak correlation. This analysis indicated that for the conditions outlined in the experiment, this ratio not only qualitatively indicates the suitability of the levelling additive in the solution, but can also indicate the suitability of ZnO. In order to confirm this finding, experiments in a Hull cell, with different factor values, and in larger quantities are required. A larger number of experiments is also needed to check whether the correlation between the levelling additive (Base 250) and the HCD/LCD ratio will increase, or remain with a moderately weak correlation. Table 6 shows the result of the correlation between these variables.
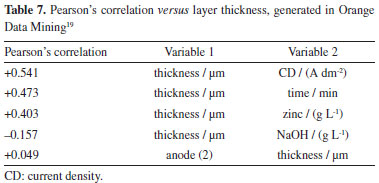
Using the predictive model, the thickness can also be predicted in the Hull cell experiment and this relationship between the layer thickness in the HCD and LCD region can be calculated to check the adequacy of the amount of levelling additive (Base 250) in the solution. Main effects of factors on the thickness of the electrodeposited zinc layer Pearson's correlation analysis was carried out using the Orange Data Mining software19 to check the correlation between the input factors and the layer thickness response variable. Table 7 shows the correlation between the factors and the response. Three factors were found to have moderate correlations with the response (layer thickness). The highest correlation is with the CD factor (A dm-2), with a moderately strong correlation coefficient = +0.541. The correlations of the time and zinc (ZnO) factors show a moderately weak correlation. It was observed that the factor with the greatest influence on the electrodeposited layer, under the conditions outlined in the experiment, is the CD factor, followed by the time factor and the zinc factor. Sillos10 shows a direct relationship between the output variable, the thickness of the electrodeposited layer, and the factors (input variables) time and current density, indicating that the relationships found in this work are consistent with the literature.
Aspects of the visual characterization of the electroplated substrates Due to the variation in factors, different combinations of electrolytes were created, making it possible to observe different visual aspects of the electroplated substrates. Figure 11 compares two electroplated substrates. Sillos10 relates the condition of the electrolyte to the visual appearance of the panel tested in the Hull cell, indicating that for an ideal electrolyte condition, the surface of the panel should be shiny and uniform. Figure 11a shows a galvanized substrate with a non-uniform visual appearance of the electrodeposited layer, with a matt appearance and the formation of a coarse deposit in the high current density zone, which according to Sillos,10 may be characteristic of the combination of high levels of the current density, time and electrolyte factors with an imbalance of brighteners. Figure 11b shows a visually uniform appearance of the electrodeposited layer and a more open shine, characteristic of the optimum experimental conditions and the ideal electrolyte condition. In the zinc electroplating process, the desired pattern should be visually similar to that in Figure 11b, with an open sheen, visually uniform deposition of the layer and no apparent defects (burnt surfaces, orange peel appearance, matt surface). Influence of current density on zinc deposition and thickness The thickness of the deposits varied directly with the current density, being greater in the regions of higher current density. A difference in thickness was observed in the electrodeposited substrates, with higher values in the HCD regions, closer to the anode, and lower values in the LCD regions, further away from the anode. This variation is attributed to the non-uniform distribution of current density resulting from the geometry of the electrolytic cell, which causes a gradual increase in the electrical resistance of the solution with the distance between the electrodes. The literature10,12 corroborates this observation, reporting that HCD promote intense gas evolution, as part of the applied current is used for metal deposition and part reduces other elements, mainly hydrogen. This phenomenon defines current efficiency. These changes lead to the formation of thicker deposits and a greater number of defects, such as pores and inclusions. On the other hand, in conditions of LCD, gas evolution is less intense, favoring the formation of more uniform deposits with fewer defects. These effects can be clearly seen visually in Figure 11a, where in the region of HCD there is an excessive deposit of zinc in the bottom left-hand corner that is not uniform in relation to the right-hand side (LCD). Application of the model to an industrial electrolyte To confirm the applicability of the model generated by the XGB algorithm, we carried out a new set of experiments using an electrolyte with an industrial composition. These experiments were carried out using electrolyte extracted directly from a real production tank at a galvanic plant in the city of Caxias do Sul, RS, Brazil. The input parameters and resulting coating thicknesses were recorded according to the methodology described in section Electroplating experiment. The data from the experiment with the industrial electrolyte is presented in Table 8, showing the input variables and experimentally measured layer thicknesses.
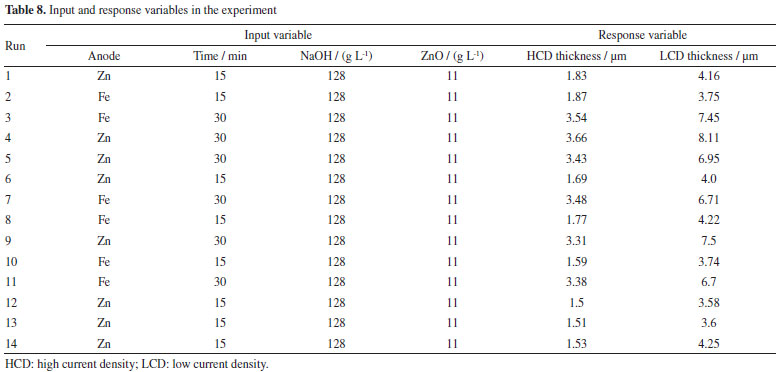
The input variables include the type of anode, the electrodeposition time, the NaOH concentration and the ZnO concentration. The measured response was the thickness of the zinc coating. Model application process The XGB model was applied using Orange Data Mining software.19 Figure 12 shows the workflow used to load the data, select the variables, apply the model and generate the predictions, as well as visualizing the results in a scatter plot. The workflow consisted of the following steps: (i) load data (file): load the experimental data; (ii) select rows: filter the data as required; (iii) select columns: select the relevant input and output variables; (iv) load model: load the previously trained XGB model; (v) generate predictions: apply the model to the experimental data to predict the coating thicknesses; (vi) scatter plot: visualize the correlation between the values predicted by the model and the experimental values.
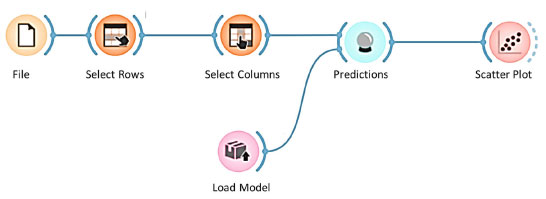 Figure 12. Flowchart for choosing the artificial intelligence algorithm (generated in Orange Data Mining)19
Model validation Figure 13 shows a scatter plot relating the layer thickness predicted by the XGB model to the thickness measured experimentally. The linear correlation shown in the graph, with a correlation coefficient of r = 0.95, indicates a strong agreement between the predicted values and the experimental values. The colors of the points on the graph represent different thickness intervals, making it easier to see the distribution of the data.
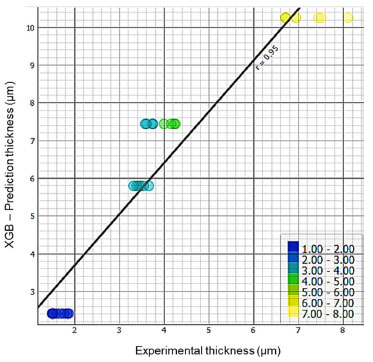 Figure 13. Linear regression of the layer thickness predicted with the XGB algorithm in relation to the experimental one (generated in Orange Data Mining)19
The high correlation observed between the experimental data and the model predictions confirms the robustness and applicability of the XGB model in industrial conditions. This experimental validation demonstrates that the model can be used reliably to predict zinc coating thickness in galvanizing processes using industrial electrolytes. The results presented corroborate the effectiveness of the XGB model in predicting zinc coating thickness with high accuracy, even when applied to electrolytes taken from a real industrial environment. This experimental confirmation validates the use of the model in practical applications, providing an effective tool for optimizing and controlling the zinc electroplating process. Correlation between expected coating thickness and process parameters In this study, the correlation between the expected zinc coating thickness and the process parameters was analyzed using the XGBoost (XGB) algorithm. The main objective was to verify the strength of the relationship between the input parameters (current density and time) and the layer thickness obtained, both experimentally and predicted by the model. Experimental correlation table To assess the correlation between the input factors and the coating thickness, Pearson's correlation was used. Table 9 shows the correlation coefficients for the experimentally measured thickness versus CD and time. The values indicate the strength of the linear relationship between these variables.
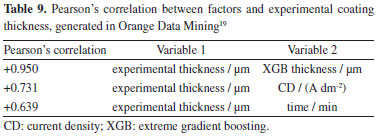
The results show an extremely high correlation (+0.950) between the experimental thickness and the thickness predicted by the XGB model, demonstrating the accuracy of the model in replicating the experimental data. CD showed a positive correlation (+0.731), indicating a strong relationship with coating thickness. The deposition time also showed a positive correlation (+0.639), although smaller, still significant. Correlation table predicted by the XGB model Table 10 details the correlation between the input parameters and the coating thickness predicted by the XGB model. These values were generated for the substrates tested with industrial electrolyte under real production conditions.
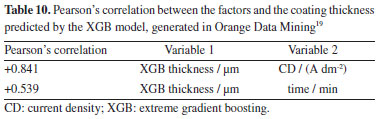
The data in Table 10 reveals that CD continues to be a determining factor in predicting layer thickness, with a positive correlation of +0.841. This reinforces the importance of precise control of CD in the electrodeposition process in order to achieve the desired coating thickness. The correlation between deposition time and the thickness of the layer predicted by the model is positive (+0.539), demonstrating that, although less influential than current density, time still has a significant impact on the thickness of the coating. Discussion of the correlations The correlations presented clearly indicate that the process parameters, specifically CD and time, have a significant relationship with the thickness of the zinc coating. The strong correlation between the experimental thickness and the thickness predicted by the XGB model (+0.950) validates the ability of the model to capture the influences of the process parameters on the coating thickness. CD proved to be the most influential factor, with correlations of +0.731 and +0.841 for the experimental and predicted data, respectively. Deposition time, although with lower correlations (+0.639 and +0.539), still proved to be a relevant parameter in determining coating thickness. These results confirm that there is a significant correlation between process parameters and coating thickness, corroborating the theoretical basis that process parameters are determinant in the formation of the coating layer. These correlations are fundamental for predictive modelling and for optimizing the zinc electroplating process in industrial environments. Challenges, limitations and industrial applications of the model It is important to emphasize the limitations of the model, with points to consider: (i) as for the substrates, although they are statistically representative and allow for satisfactory analyses, more data could improve the learning of the model and confirm the correlation between the thicknesses in the HCD/LCD and the concentration of zinc (ZnO) in the solution; (ii) the model used two time levels (15 and 30 min) based on the Hull cell test,10 but in industrial processes, the time can be longer, limiting the application of the model to longer periods; (iii) the lack of industrial process data with different factor values for comparison with the predictions of the model is a limitation. In addition to the points mentioned above, other factors (which remained at fixed levels) that could be influence the electroplating process, include the temperature and agitation of the electrolyte. The result of this study suggests a starting point for process control based on predictive analysis. Companies already have extensive control data, such as ZnO, NaOH, temperature, time and current density. However, the relationship between these parameters and the characteristics of the parts in production batches has not yet been explored in order to build predictive models. This work proposes integrating existing data on these parameters with the characteristics of the parts, such as layer thickness, composition (ZnNi, ZnFe, etc.), accelerated corrosion tests, peeling, visual analysis and surface defects. The method presented is easy to apply and open source, allowing models to be created to predict other characteristics based on the layer thickness measurement presented here. Implementation on an industrial scale is feasible with production tools for machine learning models. The model can be made available online for other companies to use, but it is important to consider the limitations mentioned in this work and the need for more data and validation in varied industrial conditions to improve the model.
CONCLUSIONS The aim of this study was to develop a model using AI to predict the thickness of the surface layer of zinc electrodeposited on low carbon steels using the electroplating process, taking into account variations in the parameters of the electroplating process. As a result, the best model using AI was generated by the XGBoost algorithm, which had the best performance among the models analyzed, obtaining R2 = 0.95 and MSE = 0.815. The results of this study are consistent with the publication by Katirci et al.,7 where the authors conclude that the results of the analysis show that the XGB algorithm provides the best estimate for the thickness of ZnNi and Ni%. Specifically, the XGB machine learning technique had the highest R2 values and the lowest MSE values for the prediction of coating thickness. Furthermore, the XGB method was found to be the most effective AI model generator among the models tested, based on the same metrics used in the literature. This is an important result, as it shows the scientific and methodological alignment with the work published by Katirci et al.,7 in the area of AI applied to electroplating processes for predicting the thickness of the electrodeposited layer on low carbon steel substrates. The predictive models generated in this work have the potential to optimize costs by improving the quality of parts, reducing the time between possible problems and the detection of effects, as well as providing predictive capacity for the process, providing the ability to know what is going to happen, before it happens, in terms of responses. Thus, for the variable chosen, the thickness of the electrodeposited zinc coating, due to its importance and direct relationship with the corrosion resistance capacity of the substrate, according to ABNT NBR 10476,1 the application of the predictive model is viable for this process. The possibility of predicting the thickness of the electrodeposited layer on low carbon steel substrates is a significant contribution to improving industrial processes, since this prediction relationship is currently non-existent in many electroplating companies, according to field visits carried out. The data and models from this study can be made available online for those interested to analyze and work with. It is worth emphasizing that although this study focused on the SAE 1008 steel alloy, the concepts and methodologies presented here can serve as a basis for future investigations involving other low carbon steel alloys. In short, this work contributes to the advancement of the application of artificial intelligence in electroplating processes, offering an innovative and accurate approach to predict the thickness of the electrodeposited zinc coating on low carbon steel substrates, with the potential to boost the anticorrosive coatings industry.
REFERENCES 1. Brazilian Association of Technical Standards (ABNT); ABNT NBR 10476: Electrodeposited Zinc Coatings on Iron or Steel; ABNT: Rio de Janeiro, 2016. [Link] accessed in January 2025 2. Matlakhov, A. N.; Matlakhova, L. A.; Corrosion and Protection of Materials, 1st ed.; Paco e Littera: Jundiaí, 2021. 3. Katirci, R.; Tekin, B.; Bitlis Eren Univ. J. Sci. Technol. 2022, 11, 1050. [Crossref] 4. Pierson, L.; Data Science for Laymen, 2nd ed.; Alta Books: Rio de Janeiro, 2019. 5. Aghaaminiha, M.; Mehrani, R.; Colahan, M.; Brown, B.; Singer, M.; Nesic, S.; Vargas, S. M.; Sharma, S.; Corros. Sci. 2021, 193, 109904. [Crossref] 6. Coelho, L. B.; Zhang, D.; Ingelgem, Y. V.; Steckelmacher, D.; Nowé, A.; Terryn, H.; npj Mater. Degrad. 2022, 6, 1. [Crossref] 7. Katirci, R.; Aktas, H.; Zontul, M.; Trans. IMF 2021, 99, 162. [Crossref] 8. Jayasinghe, T.; Liang, C.; Perera, D.; Constr. Build. Mater. 2023, 387, 131604. [Crossref] 9. Helmut-Fischer, https://loja.helmut-fischer.com.br/fluorescencia-de-raio-x/fischerscope-r-xan, accessed in January 2025. 10. Sillos, R.; Surtec Technical Manual: Surface Treatments, 4th ed.; SurTec do Brasil: São Bernardo do Campo, 2009. 11. Panatlântica Tubos, https://www.panatlanticatubos.com.br/pt/produtos/tubos/, accessed in January 2025. 12. da Silva, G. P.; Freire, N. S.; de Matos, D. E.; Correia, A. N.; de Lima-Neto, P.; Quim. Nova 2006, 29, 15. [Crossref] 13. Montgomery, D. C.; Runger, G. C.; Applied Statistics and Probability for Engineers, 7th ed.; LTC: Rio de Janeiro, 2021. 14. Grömping, U.; Journal of Statistical Software 2014, 56, 1. [Crossref] 15. RStudio Team, RStudio: Integrated Development for R. RStudio, version 1.3.1093; PBC, Boston, MA, 2020. [Link] accessed in January 2025 16. Gabe, D. R.; Wilcox, G. D.; Trans. IMF 1993, 71, 71. [Crossref] 17. Instrutherm, https://www.instrutherm.com.br/, accessed in January 2025. 18. Kirtis, A.; Aasim, M.; Katirci, R.; Plant Cell, Tissue Organ Cult. 2022, 150, 141. [Crossref] 19. Demsar, J.; Curk, T.; Erjavec, A.; Gorup, C.; Hocevar, T.; Milutinovic, M.; Mozina, M.; Polajnar, M.; Toplak, M.; Staric, A.; Stajdohar, M.; Umek, L.; Zagar, L.; Zbontar, J.; Zitnik, M.; Zupan, B.; Journal of Machine Learning Research 2013, 14, 2349. [Link] accessed in January 2025 20. Yan, L.; Diao, Y.; Gao, K.; Materials 2020, 13, 3266. [Crossref] 21. Yan, L.; Diao, Y.; Lang, Z.; Gao, K.; Sci. Technol. Adv. Mater. 2020, 21, 359. [Crossref] 22. Zhi, Y.; Jin, Z.; Lu, L.; Yang, T.; Zhou, D.; Pei, Z.; Wu, D.; Fu, D.; Zhang, D.; Li, X.; Corros. Sci. 2021, 178, 109084. [Crossref] |

On-line version ISSN 1678-7064 Printed version ISSN 0100-4042
Qu�mica Nova
Publica��es da Sociedade Brasileira de Qu�mica
Caixa Postal: 26037
05513-970 S�o Paulo - SP
Tel/Fax: +55.11.3032.2299/+55.11.3814.3602
Free access