
 |
 |
 |
 |
 |
Artigo
| Exploring the antioxidant activity of Eugenia uniflora L. extracts: a comparative approach by different techniques |
|
Vinicius Monteiro Schaffka; Cássia Gonçalves Magalhães* Departamento de Química, Universidade Estadual de Ponta Grossa, 84030-000 Ponta Grossa - PR, Brasil Received: 01/20/2025 *e-mail: cgmagalhaes@uepg.br Eugenia uniflora L (EU), Myrtaceae, known as pitangueira, is recognized as a source of bioactive compounds, mainly polyphenols. Considering the complexity and variety of factors that influence the composition of their extracts, assigning antioxidant properties to specimens from distinct locations and environmental conditions is important. In this study, the composition profile (total phenolic content (TPC), total flavonoid content (TFC), gas chromatography-mass spectrometry (GC-MS), and ultra-performance liquid chromatography-mass spectrometry (UPLC-MS) fingerprint) and antioxidant activity (by chelating effect, phosphomolybdenum, 2,2-diphenyl-1-picrylhydrazyl (DPPH), 2,2'-azino-bis(3-ethylbenzothiazoline-6-sulfonic acid) (ABTS), hypochlorous acid (HOCl), ferric reducing antioxidant power (FRAP), and cupric reducing antioxidant capacity (CUPRAC) assays) of the extracts from three specimens of pitangueira (EU1, EU2, and EU3) obtained at different pH values were compared. The results indicated that extracts obtained with ethyl acetate (EA) at pH 4 had the highest effectiveness due to their elevated levels of phenolic compounds. Additionally, a significant occurrence of flavonoids in EU2 was observed, as demonstrated by the antioxidant activity of EA at pH 8 and EA/MeOH (1:3). This study provides valuable insights into the chemical variability of E. uniflora and its significant impact on antioxidant activities, highlighting the importance of extraction conditions to enhance the therapeutic efficacy of its bioactive compounds. INTRODUCTION The search for compounds with antioxidant activity, whether of natural or synthetic origin, is of great relevance in promoting human health. The action of these substances is based on the containment of oxidative stress through the stabilization of reactive species.1 Reactive species are unstable compounds that can cause cellular damage and contribute to the development of various diseases, including cancer, cardiovascular disorders, and neurodegenerative diseases.2,3 Plant-derived antioxidants, such as polyphenols, offer significant benefits compared to synthetic compounds, considering that some of them show cytotoxic and carcinogenic potentials in in vivo assays.4 Their structural variety, combined with their greater safety, enables their application in the food and pharmaceutical industries. Polyphenols are classified as natural antioxidants due to their chemical characteristics. This kind of metabolite can directly capture reactive species, chelate metals, restore endogenous antioxidants, leading to protection against oxidative stress.5 Species of the Eugenia genus (Myrtaceae) display as a significant source of compounds with antioxidant action. Studies6 conducted with E. dysenterica highlight their neuroprotective action based on its efficacy in the balance of the action of biochemical markers of oxidative stress (catalase, superoxide dismutase activity, and lipoperoxidation). Eugenia uniflora L. (EU) is popularly known as pitangueira. It is a native Brazilian tree widely distributed throughout South America. In addition to the consumption of pitangueira's fruits in natura or their application in functional drinks, its leaves are used in infusions, decoctions, and tinctures for the treatment of diarrhea, stomach pains, worm infestations, fever, flu, hyperglycemia, hyperlipidemia, and hypertension.7-10 There are studies11,12 that point out the variability of the secondary metabolite composition of E. uniflora depending on the fruit color, ripening stage and seasonal influence. Variations in phenolic compounds have also been demonstrated based on tree maturation. The leaves extract of this plant is composed mainly of phenolic compounds, including phenolic acids, flavonoids, and glycosylated derivatives as the most prevalent.13,14 Many studies on E. uniflora attribute a range of bioactivities to its secondary metabolites and extracts, including antimicrobial, antiparasitic, anti-inflammatory, anticancer, neuroprotective and antioxidant properties. These bioactivities are primarily attributed to the high concentration and variability of phenolic compounds and flavonoids in the leaves' extracts.15-17 The antioxidant activity of E. uniflora extracts is the most described in the literature,18,19 and it is the main mechanism through which phenolic compounds and flavonoids exert other distinct bioactivities. Considering that the chemical profile of plant extracts is influenced by the ecosystem, the biological potential of their products will change.12 In this way, the phytochemical study of plants collected in different regions, as well as their biological properties, is relevant as it can guide harvesting based on the most interesting chemical compounds. Continuous research in this area is essential to explore the therapeutic potential of this species, considering factors that can influence its biological activities to ensure their quality is required for food and pharmaceutical industries. Therefore, the present work aims to evaluate the chemical profile and antioxidant potential of the leaves of E. uniflora specimens located in different environmental conditions.
EXPERIMENTAL Plant material, extraction and fractionation Three specimens of E. uniflora were named EU1, EU2 and EU3. The leaves were collected in Universidade Estadual de Ponta Grossa, Paraná, Brazil, in June 2022 and identified by Dr. Rosangela Tardivo. The average temperature during the day of the collection was 21 ºC, 60% air humidity, without recorded precipitation in the last 24 h. EU1 has small, yellowed leaves and is in a region that it is fully exposed to sunlight (25º05'39.5"S 50º06'23.6"W). EU2 is partially exposed to sunlight (25º05'42.2"S 50º06'07.3"W) and features small, dark leaves. EU3, which is completely shielded from sunlight (25º05'42.1"S 50º06'07.2"W), has large and dark leaves. A specimen was deposited in the herbarium of Universidade Estadual de Ponta Grossa (HUPG), under deposit number HUPG-22452. All procedures for access to genetic patrimony and associated traditional knowledge were carried out and the project was registered in SisGen (Register A23FAEE). The plant material was then dried at room temperature, protected from light. Subsequently, the dried leaves (120 g) were ground and subjected to hydrodistillation for 2.5 h. The essential oil was collected in diethyl ether and stored under refrigeration. The aqueous extract obtained was then filtered and partitioned by ethyl acetate at pH 8 (EA pH8), the mixture of ethyl acetate and methanol 1:3 (EA/MeOH) at pH 8 and ethyl acetate at pH 4 (EA pH4). Characterization of the extracts Total phenolic content (TPC) determination Total phenolic content of the E. uniflora extracts was determined using Folin-Ciocalteu method, adapted by Camargo et al.20 First, 100 µL of an ethanolic solution of the extracts (100 µg mL-1) were mixed with 100 µL of the Folin-Ciocalteu reagent (10% v/v) and 100 µL of Na2CO3 (7% m/v). After 30 min at room temperature, the absorbance was measured at 765 nm. Total phenolic content of each extract was determined from the calibration curve of gallic acid standard. The results were expressed as milligrams of gallic acid per gram of extract (mg GAE g-1). Total flavonoid content (TFC) determination Flavonoid content of the E. uniflora extracts was determined as described by Herald et al.,21 that consists of the spectrophotometric determination of the flavonoid-AlCl3 complex. To perform the assay 25 µL of an ethanolic solution of the extracts (100 µg mL-1) were mixed with 10 µL of NaNO2 (5% m/v), and 100 µL of distilled water were added. After 5 min, 25 µL of AlCl3 (0.414 M) was added. After another 5 min, 50 µL of NaOH (1 M) was added. After 5 min, the absorbance was read at 510 nm. Total flavonoid content was determined for each extract from the calibration curve of catechin standard. The results were expressed as milligrams of catechin per gram of extract (mg CAT g-1). Essential oil analysis by gas chromatography-mass spectrometry (GC-MS) The gas chromatographic analyses of the essential oils (10 mg mL-1) were performed using a gas chromatography-mass spectrometry system (Shimadzu GCMS-QP2020 Gas Chromatograph). The analysis was conducted on an RTx-5MS capillary column (30 m × 0.25 mm internal diameter × 0.25 μm film thickness), and the analytical conditions were as follows: split ratio of 1/10, injector temperature at 250 ºC, ion source at 250 ºC, and interface at 280 ºC. The temperature program of the oven was set at 60 ºC for 5 min, followed by a temperature ramp of 3 ºC min-1 until reaching the final temperature of 240 ºC. The components were identified based on the relative retention index, calculated for each constituent by injecting a series of n-alkane standards (C8-C20) under the same sample conditions and comparing them with tabulated values as well as comparing the obtained mass spectra with the mass spectra database and literature comparisons.22 Ultra-performance liquid chromatography-mass spectrometry (UPLC-MS) fingerprint analysis This analysis was carried out in an Acquity-UPLC system (Waters, MA, USA), composed by a quaternary pump, sample manager, and column oven. Detection was provided by a triple quadrupole, electrospray ionization-mass spectrometry (ESI-MS) Quattro LC (Waters, MA, USA). Chromatographic separation was performed using a Waters 1.7 μm Acquity UPLC® BEH C18 column (50 mm × 2.1 mm) at a flow rate of 0.3 mL min-1. The mobile phase was solvent A, H2O with formic acid 0.1% (v/v), and solvent B, methanol. A gradient of solvent B was used, from 5 to 100%, over 11 min, then 3 min with 100% B. After that, another 5 min with 5% B. The samples (1 mg mL-1) were dissolved in MeOH and the volume for injection was 3 μL. The detection was provided by ESI-MS on scan mode (m/z 50-700). The MS/MS parameters for the analysis were 3 kV on the capillary and 55 V on the cone (negative ion mode), 130 ºC source temperature and desolvation gas temperature of 550 ºC. The cone gas and desolvation gas were both nitrogen with flow rates set at 50 and 700 L h-1, respectively. The collision gas used was argon and the collision energy was 7 eV. Antioxidant activity evaluation 2,2-Diphenyl-1-picrylhydrazyl (DPPH) assay The antioxidant activity of fractions from E. uniflora extracts was evaluated using the DPPH method, as described by Brand-Williams et al.23 This method is based on the scavenging of the DPPH• radical by compounds present in the extracts, leading to a change in the color of DPPH from violet to colorless. To perform the assay, 80 µL of ethanol were added, followed by the addition of 20 µL of ethanolic solution of extracts at different concentrations (10-0.1 µg mL-1). Subsequently, 100 µL of an ethanolic solution of DPPH reagent (0.06 mM) was added. The plate was then incubated in the dark for 30 min, and the absorbance was measured at 518 nm. 2,2'-Azino-bis(3-ethylbenzothiazoline-6-sulfonic acid) (ABTS) assay The antioxidant activity was also performed using the ABTS method which evaluates the ability of the extracts to scavenge the ABTS radical.24 The working solution of ABTS was prepared by reacting 5 mL of 7 mM ABTS aqueous solution with 88 µL of 140 mM potassium persulfate and kept in the dark at room temperature for 12-16 h before use. Then, 80 µL of sodium phosphate buffer (0.05 mM) and 20 µL of an ethanolic solution of the extracts at different concentrations (10-0.1 µg mL-1) were added, followed by the addition of 100 µL of ABTS solution (7 mM) diluted in sodium phosphate buffer (10 mM). The plate was incubated for 30 min in the dark at room temperature. The absorbance was measured at 734 nm. Hypochlorous acid (HOCl) scavenging assay The scavenger capacity of HOCl was conducted following the methodology described by da Costa et al.25 This method relies on the extract's capability to scavenge HOCl, thereby preventing its reaction with 3,3',5,5'-tetramethylbenzidine (TMB) and the subsequent formation of a blue-colored compound. TMB solution (14 mM) was prepared by dissolving 34 mg of TMB in 5 mL of DMF (dimethylformamide), 100 µL of KI (10 mM) and 4.9 mL of acetic acid (0.8 M). For the assay, sodium phosphate buffer (50 mM, pH 7.4) and an ethanolic solution of the extracts at different concentrations (100-1 µg mL-1) were added, followed by the addition of 50 µL of the TMB solution and 50 µL of 0.01% NaOCl. After 10 min of incubation, the samples were read on a spectrophotometer at 652 nm. As a control, a standard curve with ascorbic acid was prepared. The results were then plotted on a concentration versus inhibition graph, allowing the determination of the half maximal inhibitory concentration (IC50). Oxygen radical absorbance capacity (ORAC) assay Antioxidant activity using the ORAC method was made using the procedure created by Cao et al.26 and adapted by Denev et al.27 The method is based on the scavenger of the peroxyl radical formed during the thermal degradation of AAPH (2,2'-azobis(2-amidinopropane) dihydrochloride), preventing the degradation of fluorescein. For the preparation of both reagent and sample solutions, a 75 mM sodium phosphate buffer pH 7.4 was used. To perform the assay, 100 µL of a fluorescein solution at a concentration of 8.4 × 10⁻⁸ M was added to a 96-well microplate, followed by the addition of 50 µL of the sample (5 µg mL-1). After mixing, the plate was incubated at 37 ºC for 3 min. Following the incubation period, 50 µL of a 153 mM AAPH solution was added. The plate was then read every 90 s using a microplate fluorometer with excitation at 485 nm and emission at 520 nm. ORAC values were calculated using the difference in areas under the fluorescein decay curve (AUC) between the blank and the samples. As a control, a standard curve with Trolox was prepared. The results were expressed as millimole Trolox equivalent per gram (mM TE g-1). Chelating effect To evaluate the extracts' capacity for iron chelation the method described by Cunha et al.28 was employed. This method is based on the interruption of the formation of an O-phenanthroline-Fe2+ complex by extracts with chelating capacity. For the assay, 50 µL of the extract (concentrations ranging from 100 to 1750 µg mL-1) and 25 µL of an aqueous solution of FeSO4 (2 mM) were added. After a 10-min incubation, 100 µL of an ethanolic solution of O-phenanthroline at 6 mM was added. After more 10 min, the samples were read on a spectrophotometer at 510 nm. As a control, a standard curve with ethylenediamine tetraacetic acid (EDTA) was prepared, and the results were expressed in mg EDTA g-1. Phosphomolybdenum method The total antioxidant activity was conducted using the phosphomolybdenum method, as described by Prieto et al.29 This method is based on the reduction of Mo6+ to Mo5+ by the sample, forming a green-colored phosphate-Mo5+ complex under acidic pH. For this purpose, 0.1 mL of the sample (100 µg mL-1) and 1 mL of the reagent (0.6 M sulfuric acid, 28 mM sodium phosphate, and 4 mM ammonium molybdate) were added to the reaction tube and homogenized. The tubes were maintained at 95 ºC for 90 min. After this time, the samples were cooled and read on a spectrophotometer at 695 nm. A blank tube containing the reagents and 0.1 mL of the same solvent used in the extracts served as the control. For calibration, a standard curve of ascorbic acid (AA) was prepared under the same conditions as the sample. The results were then expressed in mg AA g-1. Reducing power The evaluation of reducing power was performed following the methodology described by Bursal and Gülçin,5 with some modifications. The methodology is based on the spectrophotometric determination of the Prussian Blue complex formed by the reduction of Fe3+ to Fe2+ by the samples. For this purpose, 0.75 mL of the sample (100 µg mL-1), 1 mL of sodium phosphate buffer (0.2 M, pH 6.6), and 1 mL of potassium ferrocyanide [K3Fe(CN)6] (1%) were added. The samples were incubated at 50 ºC for 20 min. Reagents and 0.75 mL of the same solvent used in the samples served as the blank. After the incubation period, the medium was acidified with 1 mL of trichloroacetic acid (10%). Then, 0.25 mL of FeCl3 (0.1%) was added to the solution. The samples were read on a spectrophotometer at 700 nm. For control, a calibration curve of ascorbic acid under the same conditions as the samples was used. The results were then expressed in mg AA g-1. Cupric ion reducing antioxidant capacity (CUPRAC) For the determination of reducing power by the copper reduction assay, the methodology described by Apak et al.30 was performed. In test tubes, 100 µL of the sample (100 µg mL-1), 1 mL of copper chloride solution (CuCl2 1.0 × 10⁻² M), 1 mL of neocuproine solution (7.5 × 10⁻³ M in 96% ethanol), 1 mL of ammonium acetate buffer solution at pH 7.0 (C2H7NO2), and 1 mL of distilled water were added. The tubes were vortexed and kept protected from light for 30 min. After the incubation period, 300 µL of the reaction solution was transferred to a 96-well plate and read at 450 nm. For calibration, a standard curve of Trolox was prepared under the same conditions as the sample. The results were expressed in mM TE g-1. Statistical analysis All experiments were carried out in triplicate, and the results were expressed as mean ± standard deviation. In this study, one-way analysis of variance (ANOVA) with post hoc Tukey test was used. The statistical differences between the results were demonstrated using different letters (a-f). For comparison between the antioxidant values with different units, the Min-Max data normalization method was initially employed. After the normalization, a heat map was plotted to visualize the difference between the extracts. All calculations were performed using OriginPro 2023b software, version 10.0.5.157.31
RESULTS AND DISCUSSION Characterization of the extracts The method of extraction and the kind of solvent can influence quantitatively and qualitatively the chemical profile of plant extracts. The initial extraction in a Clevenger-type hydrodistillator aimed to obtain the essential oil and remove apolar and non-phenolic impurities present in EU extracts. To ensure the complete exclusion of the non-phenolic portion, liquid-liquid extraction with CHCl3 was made. By raising the pH of the aqueous solution to about 8, the pKa of any phenolic hydroxyl present in flavonoids is not sufficiently low to guarantee deprotonation. However, carboxylic acid groups present in phenolic acids react with the base, forming their respective carboxylates. Under these conditions, liquid-liquid extraction with ethyl acetate (EA) will produce an extract rich in moderately polar flavonoids. The addition of a highly polar solvent, such as methanol, to this system favors the extraction of highly polar flavonoids, typically containing 3 to 5 hydroxyl groups and linked to glycosides. The subsequent acidification of the aqueous phase to pH 4 shifts the chemical equilibrium of the carboxylate groups back to their molecular form, which can then be extracted through liquid-liquid extraction with ethyl acetate. This sequence of liquid-liquid extraction aims to generate selective extracts for three classes of phenolic compounds: the EA extract at pH 8 containing moderately polar flavonoids, the EA/MeOH 30% extract containing glycosylated flavonoids, and the EA extract at pH 4 containing higher amounts of phenolic acids.32 The extraction process was more efficient for the EA pH 8 and EA/MeOH 30% extracts, with EU2 MeOH standing out, where the proportion of total flavonoids is the highest (Table 1). The extracts obtained with EA at pH 4 were more abundant in total phenolic compounds. The sample EU3 pH 4 stood out, because it not only contained a high amount of total phenolic compounds but also exhibited a small number of total flavonoids, showing considerable selectivity for the phenolic acids present in E. uniflora. It is possible to observe that the extracts obtained in EA/MeOH 30% showed the highest values of total flavonoid content, indicating that the flavonoids in E. uniflora leaves are in the most form glycosylated.
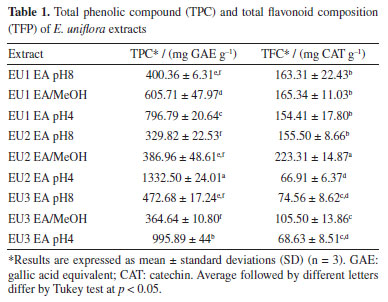
These results are in line with those reported for E. uniflora leaves growth in Crato, Brazil, considering the yield and sample solvent ratio used in an ethanolic extract that shown TPC of 75.6 mg GAE g-1 and for TFC 42.5 mg QE g-1, with an extraction yield of 1.07%.23 Another study33 reported values of 193.06 mg GAE g-1 and 28.64 mg QE g-1 for a hydroalcoholic extract with 10% MeOH. The essential oil of the leaves from three specimens of E. uniflora were submitted to GC-MS analysis to determine its composition. The volatile composition, relative area and retention time index are shown in Table 2.
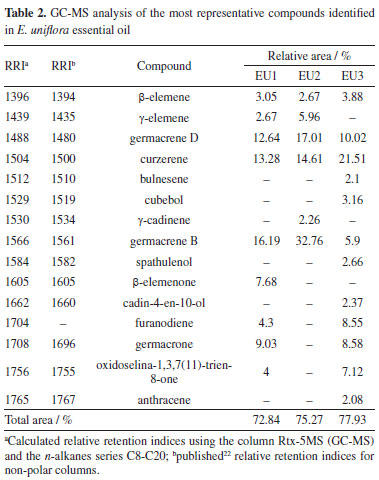
In the essential oils of the three specimens, 60 compounds were detected, mostly sesquiterpenes and oxygenated sesquiterpenes. The fifteen metabolites with the relative area above 2% are shown in Table 2. The identified compounds and most prevalent ones are in accordance with those found in the literature for E. uniflora collected in Ife, Nigeria and Ponta Grossa, Brazil,34,35 with changes in the majoritarian compound, which was oxidoselina-1,3,7(11)-trien-8-one and selina-1,3,7(11)-trien-8-one for both researches. Other studies36-38 had shown a constitution very similar to that found in this work. The variation in the constitution of the essential oil from the leaves of E. uniflora concerning the biotype of ripe fruits was reported by a couple of papers.36,39,40 The specimens are usually divided into three groups: Group I, containing yellow, dark red, and purple fruits, which showed high concentrations of germacrene B, germacrone, and atractylone; Group II, consisting of light red fruit samples, with high concentrations of curzerene, germacrene D, and germacrene A; and Group III, containing orange-red fruits, with a high content of selina-1,3,7(11)-trien-8-one and oxiselina-1,3,7(11)-trien-8-one. Based on this classification, the specimens evaluated in this study belong to Group II (EU1), Group I (EU2) and Group III (EU3), considering the chemical composition of the essential oil, matching as the red fruit type group. The constitution difference of the essential oil from the leaves of a single E. uniflora specimen, collected in the Brazilian Cerrado, was described in the literature.36 The correlation between the concentration of volatile compounds and the concentration of minerals and phenolic compounds in the leaves, total phenolics, flavonoids, and tannins was also evaluated. It was concluded that there was a positive correlation between these factors. That study demonstrated that seasonal influence and ecological variations can impact the composition and concentration of E. uniflora essential oil, and this process may be correlated with the concentration of minerals and phenolic compounds in the leaves. The qualitative changes observed in this study are correlated with the change in the biome where the specimens are found, in this case, the Brazilian Atlantic Forest. The differences observed in the composition of the essential oils of the three specimens of E. uniflora guided the selection of these specimens and the evaluation of the variation in the antioxidant activity of their phenolic compounds concerning a series of antioxidant activity assays. The UPLC-MS fingerprint analysis of all nine extracts of E. uniflora (Table 3) allowed the identification of thirteen known compounds, where all of them were present in all samples, in different proportions. In the EA pH8 and EA/MeOH extracts, the presence of flavonoids glycosides of quercetin, kaempferol and myricetin was prevalent. Gallic acid was detected as the main compound in all the EA pH 4 extracts, followed by flavonoid glycosides as the other ones. The identification of the compounds was carried out using the mass of ions, mass fragmentation, and comparison with data published in the literature.13,16
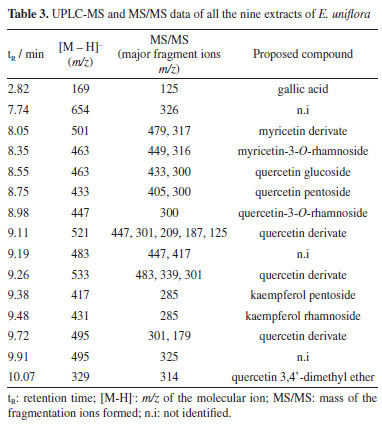
The fragmentation of the precursor ion at m/z 169 gives rise to fragment ion at m/z 125 (M-COO), indicating gallic acid.41 For quercetin glucoside ([M - H]- at m/z 463), quercetin-3-O-rhamnoside ([M - H]- at m/z 447) the ion fragment at m/z 300 is related to the respective radical aglycone ion, as well as for quercetin pentoside ([M - H]- at m/z 433),42,43 whose ion fragment at m/z at 405 was attributed to loss of CO, a typical pattern of these flavonoids.44 Myricetin-rhamnoside was annotated due to the presence of the deprotonated ion at m/z 463 [M - H]-, and a main fragment at m/z 316 was attributed to a myricetin radical anion resulting from the loss of the rhamnosyl moiety through homolytic cleavage.13 The formation of flavonol aglycone radical ions from flavonols during electrospray ionization mass spectrometry is a well-known phenomenon.45-47 Cone voltage experiments revealed that for some flavonol glycosides, ions at m/z 316, and 300 derive from the ions at m/z 317, and 301, respectively, by using higher cone voltages, whereas for other flavonol glycosides these ion pairs accumulate with the same cone voltages. It is suggested that 3-O-glycosylation favors formation of ions at m/z 300, and 316, whereas 4'- and 7-glycosylations favor formation of ions at m/z 301, 285, and 317.47 The loss of glycoside moiety for kaempferol pentoside ([M - H]- at m/z 417) and kaempferol rhamnoside ([M - H]- at m/z 431) justified the ion at m/z 285.42 Quercetin 3,4'-dimethyl ether was suggested due to observation of the precursor ion [M - H]- at m/z 329. The fragment ion at m/z 314 resulted from the loss of methyl moiety. There are several bioactivities that can be attributed to the E. uniflora due to the presence of previously identified compounds in its extracts, with a notable prevalence of glycosylated flavonoids and phenolic acids, such as gallic acid and glycosylated derivatives of flavonoids,16,48-50 as seen in Table 3. The flavonoids myricetin, quercetin, myricetin-rhamnoside, quercetin-pentoside, found in all the extracts are in line with the literature.7,10,13,16,49 The occurrence and concentration of phenolic compounds can change during the plant's development and in response to environmental factors.51 Factors such as saline and water stresses, and leaf mineral content trigger specific biochemical pathway expressions that enhance the content of their secondary metabolites as a mechanism for intracellular signaling, defense, and maintenance of homeostasis.11,52 Despite the visible difference in the constitution of the essential oils of the three analyzed specimens, there was no significant difference in the composition of the phenolic extracts. The volatile composition of E. uniflora appears to be more sensitive to environmental conditions than the phenolic composition for those specimens. Antioxidant activity of E. uniflora The results for DPPH, ABTS and HOCl assays were expressed as IC50 and are present in Table 4. All extracts strongly inhibited the DPPH radical. Furthermore, the leaves extracts obtained in ethyl acetate (EAF) at pH 4 were more efficient compared to the positive control, ascorbic acid. In ABTS assay, all the studied extracts were able to scavenge 50% of the ABTS radical at very low concentrations, with particular emphasis on the extracts EAF at pH 4, which yielded results at least three times lower than those of ascorbic acid. Regarding the scavenging of HOCl by E. uniflora extracts, significant activity was observed, particularly in the extracts obtained in EAF at pH 4, with extract EU3 pH4 showing the best result. The values obtained for EU1 EA pH8, EU1 EA/MeOH, and EU3 EA/MeOH differed from the others by presenting significantly higher IC50 values.
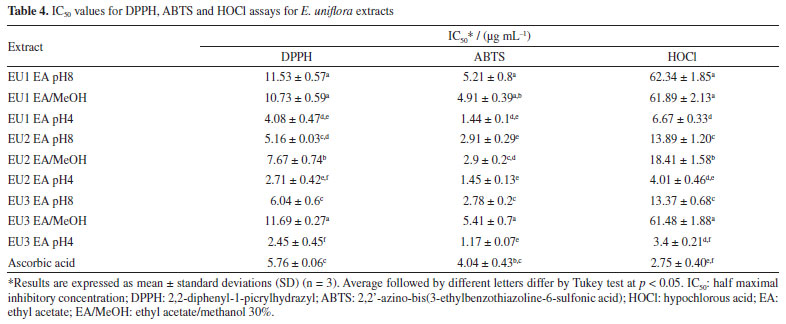
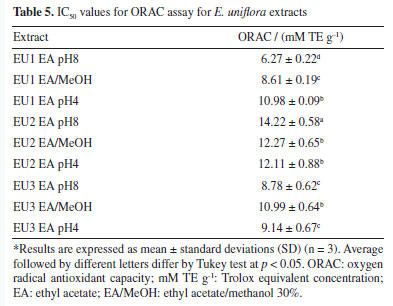
Those results can be directly correlated with the chemical composition of the extracts. Those with higher concentrations of total phenolic compounds exhibit the lowest IC50 for DPPH, ABTS and HOCl assay (DPPH Pearson's r: -0.69; ABTS Pearson's r: -0.68; HOCl Pearson's r: -0.52). A different trend for total flavonoid content was observed, which seems to decrease the potential of radical scavenging (DPPH Pearson's r: 0.45; ABTS Pearson's r: 0.34; HOCl Pearson's r: 0.31). The higher incidence of glycosylated flavonoids in E. uniflora extracts and the significant difference in antioxidant power between flavonoid glycosides and their respective aglycones may be the determining factor for this result, as already described in the literature.50,53,54 The ORAC method is based on the capture of the peroxyl radical (ROO• ), formed by the thermal degradation of AAPH by the extract, preventing the loss of fluorescence due to the consequent oxidation of fluorescein. The samples evaluated exhibited a very distinct pattern in ORAC method. In this case, the increase of flavonoids is directly proportional to the improvement of antioxidant activity (Table 5). The EU2 EA pH8 extract stands out for its high content of total flavonoids and for exhibiting the highest ORAC value. That pattern can be explained by the correlation between the presence of 3', 4' catechol group in the flavonoid with the higher inhibition of lipid peroxidation.53,55
The reducing power of an extract reflects its electron-donating capacity. Extracts with reducing power in the presence of oxidizing agents will act by reducing them to more stable products, exhibiting antioxidant activity.1,54 For the determination of the reducing power of the extracts, three methods were employed. The evaluation of reducing power using the phosphomolybdenum method is carried out through spectrophotometric detection of the phosphomolybdenum complex Mo5+ in an acidic medium. Meanwhile, the assessment of ferric reducing antioxidant power (FRAP) is conducted through spectrophotometric detection of the Prussian Blue complex, formed by the reduction of Fe[(CN)6]3 to Fe[(CN)6]2 followed by the addition of FeCl3 to the reaction, forming the complex Fe4[Fe(CN-)6]3. The CUPRAC was also used to evaluate the reducing power of the extracts. This assay is based on the reduction of Cu(II) to Cu(I) by the extracts and it is measured by the complex formed with Cu(I) and neocuproine (2,9-dimethyl-1,10-phenanthroline). The results are presented in Table 6.
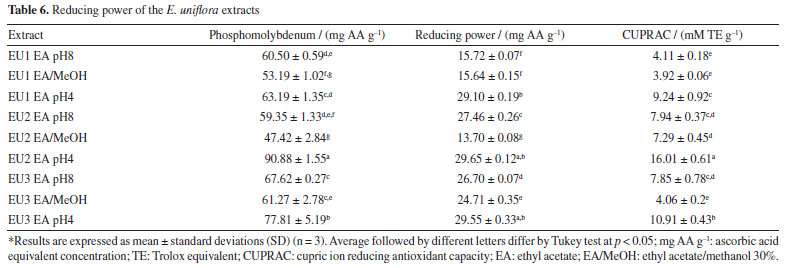
Many studies describe a clear linear correlation between the content of phenolic compounds and the reducing power of a plant extract.56-58 The results obtained in this work from E. uniflora extracts exhibit a consistent correlation between total phenolic content and reducing power across in all applied methods. EA pH 4, the richest in phenolics, was more efficient, with EU2 EA pH 4 standing out for yielding better results in all three methods (Table 6). However, this correlation did not exhibit a clear linear relationship, especially for the FRAP method (r: 0.536). This phenomenon can be explained by the synergistic effect between phenolic compounds and flavonoids, potentially contributing with comparable intensity to the ultimate reducing power. However, when the results for the EU2 specimen were analyzed, a slight difference in the performance of EU2 EA pH 8 extracts, rich in aglycones, and EU2 pH 4 extracts, rich in phenolic acids, could be observed when looked upon EU2 EA/MeOH extract, which is rich in glycosylated flavonoids, a drastic decrease in reducing power was noticed. This indicates that glycosylated flavonoids present in E. uniflora extracts may negatively influence the reducing power by FRAP method (r: -0.755). For the phosphomolybdenum and CUPRAC, a more linear correlation was observed between total phenolics and the reducing power of the extracts (r: 0.846 and r: 0.848 respectively). This positive correlation indicates that, concerning the assessment method of reducing power through the reduction of Mo6+ to Mo5+ and the reduction of Cu(II) to Cu(I), phenolic acids contribute more strongly than flavonoids. The same phenomenon was observed in the FRAP method, where flavonoid glycosides negatively influenced the reducing power, held true for the phosphomolybdenum and CUPRAC method (r: -0.857 and r: -0.523, respectively). A decrease in the performance of extracts obtained in EA/MeOH was noted, which may be correlated with the similar characteristic of flavonoids present in these extracts (Table 6). The presence of free transition metals in a biological environment favors the occurrence of Fenton-type reactions, where H2O2 is transformed into a hydroxyl radical (OH• ). The formed radical is highly reactive and promotes the oxidation of biomolecules. Therefore, the chelation of transition metals, especially Fe2+, will interrupt this process, preventing oxidative stress.3 Chelating activity was assessed by the ability of compounds present in E. uniflora extracts to inhibit the formation of the Fe2+-1,10-phenanthroline complex, which exhibits an orange color. Neither extract was able to prevent the formation of this complex, indicating a lack of chelating capacity for Fe2+. This result contrasts with the findings reported by Cunha et al.,28 who identified an IC50 of 2430.9 µg mL-1 for a pitanga extract containing quercetin as its major component, collected at the Botanical Garden of Crato, Brazil. However, the IC50 value found for the positive control EDTA was the same, validating the experiment. Flavonoids are molecules known for their chelating ability with various metals.59,60 Studies61 describe this property as a possible mechanism through which flavonoids may act as adjuvants in the treatment of neurodegenerative diseases. The most common method for spectrophotometric detection of flavonoids involves the formation of a complex with AlCl3.17 Therefore, the observed discrepancy in this study may be linked to factors not clarified, providing evidence that metal chelation is not the primary mechanism by which E. uniflora extracts exert their antioxidant activity. Comparative analysis To enable comparison among specimens based on the performance of the selective extracts and their antioxidant activities, data normalization was necessary. Normalization is employed to enable the comparison of antioxidant activity data with different units. Following normalization, the previous quantitative values were scaled to the range between zero and one, where zero represents the lowest value and one represents the highest value found for a specific test. With the normalized data, a heat map was constructed, with extracts displayed in vertical rows and the now normalized values corresponding to each utilized method presented in horizontal rows (Figure 1). This methodology for comparing antioxidant activity data is outlined in the literature.20,62
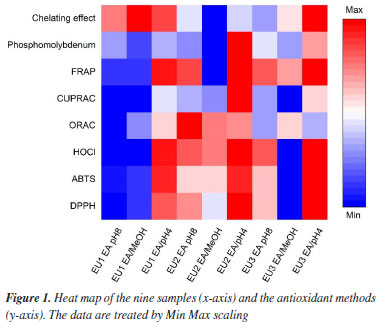
The extracts obtained in EA at pH 4 yielded the best results for most methodologies, except for ORAC which drives by the flavonoid composition, notably in EA pH8 and EA/MeOH extracts. The heatmap (Figure 1) reveals that there is a difference in both composition and antioxidant activity among the samples. Upon analyzing the EA pH 8 and EA/MeOH fractions from the three specimens, distinctions in the performance of the EU2 compared to others were observed, implying potential slightly difference among these trees. Based on the fingerprint analysis conducted by LC-MS, it was observed that the difference in constitution was minimal, with all three specimens having the same compounds in their composition. Therefore, the difference observed must be related to the concentration of the present flavonoids.
CONCLUSIONS The sesquiterpenes were prevalent in the essential oil of E. uniflora specimens. Thirteen phenolic compounds were detected in the extracts of the specimens studied. The extracts obtained in EA at pH 4 yielded the best results for most antioxidant activity evaluations, emphasizing, in the reduction mechanisms, the capacity to exert electron transference by the phenolic acids, present in these samples, since it shows the highest activity in DPPH, ABTS, HOCl, phosphomolybdenum, reducing power and CUPRAC. The higher incidence of glycosylated flavonoids in E. uniflora extracts and the significant difference in antioxidant power between flavonoid glycosides and their respective aglycones may be the determining factor for these results. Furthermore, in the ORAC assay, which involves proton transference, the increase of flavonoids is directly proportional to the improvement of antioxidant activity, since the EU2 EA pH8 extract stands out for its high content of total flavonoids and for exhibiting the highest ORAC value. About the chelating effect, the data provided evidence that metal chelation is not the primary mechanism by which E. uniflora extracts exert their antioxidant activity. Here, it is important to emphasize the differences about the sunlight exposure that each of three trees were subjected (EU1 is in a region that it is exposed entirely to sunlight, EU2 is partially exposed to sunlight, EU3 is completely shielded from sunlight). This is an important factor that influence the chemical composition. Since the difference in constitution was minimal, with all three specimens having the same compounds in their composition, the observed differences must be related to the concentration of the phenolic and flavonoids. Upon analyzing the EA pH 8 and EA/MeOH fractions from the three specimens, distinctions in the performance of the EU2 compared to others were observed, implying a potential slightly difference among them. This evidence emphasizes the importance of evaluating the antioxidant profile of different specimens submitted to distinct environmental conditions to ensure the quality of natural products, mainly that with industrial applications. Finally, considering the complex composition of the plant extracts, antioxidant activity can occur through different mechanisms and be influenced by specific compound classes. Despite literature containing many studies about antioxidant activity due to the ease and low cost of same methods, without a precise and holistic investigation, the applicability of such studies will remain limited. Therefore, the central focus of the present work was to provide a more accurate analysis that serves as a foundation for understanding the antioxidant mechanism of action of flavonoids and phenolic compounds in Eugenia uniflora, thereby guiding their applications and bioactivities. This study shows that it is essential to investigate antioxidant activity comprehensively and accurately, using methods encompassing the broadest possible range of mechanisms. That way, our study provides a good vision about this, since we employ techniques that simultaneously assess proton transfer (HAT) and electron transfer (SET), such as DPPH, ABTS, and HOCl; methods specific to HAT, such as ORAC; methods focused on SET, such as reducing power, phosphomolybdenum, and CUPRAC; as well as metal chelation assays, specifically iron chelation.
SUPPLEMENTARY MATERIAL Data of GC-MS analysis of E. uniflora essential oils (EU1, EU2, EU3) are available at http://quimicanova.sbq.org.br/, in the form of a PDF file, with free access.
DATA AVAILABILITY STATEMENT All data are available in the text.
ACKNOWLEDGMENTS The authors are grateful to Coordenação de Aperfeiçoamento de Pessoal de Nível Superior (CAPES) for the scholarship.
REFERENCES 1. Gulcin, İ.; Arch. Toxicol. 2020, 94, 651. [Crossref] 2. Pizzino, G.; Irrera, N.; Cucinotta, M.; Pallio, G.; Mannino, F.; Arcoraci, V.; Squadrito, F.; Altavilla, D.; Bitto, A.; Oxid. Med. Cell. Longevity 2017, 2017, 8416763. [Crossref] 3. Singh, A.; Kukreti, R.; Saso, L.; Kukreti, S.; Molecules 2019, 24, 1583. [Crossref] 4. Silvestrini, A.; Meucci, E.; Ricerca, B. M.; Mancini, A.; Int. J. Mol. Sci. 2023, 24, 10978. [Crossref] 5. Bursal, E.; Gülçin, İ.; Food Res. Int. 2011, 44, 1482. [Crossref] 6. Thomaz, D. V.; Peixoto, L. F.; de Oliveira, T. S.; Fajemiroye, J. O.; Neri, H. F. S.; Xavier, C. H.; Costa, E. A.; dos Santos, F. C. A.; Gil, E. S.; Ghedini, P. C.; Oxid. Med. Cell. Longevity 2018, 2018, 3250908. [Crossref] 7. Fidelis, E. M.; Savall, A. S. P.; Pereira, F. O.; Quines, C. B.; Ávila, D. S.; Pinton, S.; Arabian J. Chem. 2022, 15, 103691. [Crossref] 8. de Araújo, F. F.; Neri-Numa, I. A.; Farias, D. P.; da Cunha, G. R. M. C.; Pastore, G. M.; Food Res. Int. 2019, 121, 57. [Crossref] 9. Moura, G. S.; de Oliveira, I. J.; Bonome, L. T. S.; Franzener, G.; Arq. Inst. Biol., São Paulo 2018, 85, e0752017. [Crossref] 10. Bezerra, I. C. F.; Ramos, R. T. M.; Ferreira, M. R. A.; Soares, L. A. L.; Rev. Bras. Farmacogn. 2018, 28, 92. [Crossref] 11. Santos, R. M.; Fortes, G. A. C.; Ferri, P. H.; Santos, S. C.; Rev. Bras. Farmacogn. 2011, 21, 581. [Crossref] 12. Migues, I.; Baenas, N.; Gironés-Vilaplana, A.; Cesio, M.; Heinzen, H.; Moreno, D.; Foods 2018, 7, 67. [Crossref] 13. Rattmann, Y. D.; de Souza, L. M.; Malquevicz-Paiva, S. M.; Dartora, N.; Sassaki, G. L.; Gorin, P. A. J.; Iacomini, M.; Evidence-Based Complementary Altern. Med. 2012, 2012, 623940. [Crossref] 14. Silva, N. C. C.; Barbosa, L.; Seito, L. N.; Fernandes Junior, A.; Nat. Prod. Res. 2012, 26, 1510. [Crossref] 15. Fortes, G. A. C.; Carvalho, A. G.; Ramalho, R. R. F.; da Silva, A. J. R.; Ferri, P. H.; Santos, S. C.; Rec. Nat. Prod. 2015, 9, 251. [Link] accessed in June 2025 16. Sobeh, M.; Hamza, M. S.; Ashour, M. L.; Elkhatieb, M.; El Raey, M. A.; Abdel-Naim, A. B.; Wink, M.; Pharmaceuticals 2020, 13, 84. [Crossref] 17. Borsoi, F. T.; Bonadiman, B. S. R.; Marafon, F.; Fischer, D. L. O.; Bagatini, M. D.; Kempka, A. P.; Nat. Prod. Res. 2023, 37, 3862. [Crossref] 18. de Brito, W. A.; Ferreira, M. R. A.; Dantas, D. S.; Soares, L. A. L.; PharmaNutrition 2022, 20, 100290. [Crossref] 19. Antonelo, F. A.; Rodrigues, M. S.; Cruz, L. C.; Pagnoncelli, M. G.; da Cunha, M. A. A.; Bonatto, S. J. R.; Busso, C.; Wagner Júnior, A.; Montanher, P. F.; Biocatal. Agric. Biotechnol. 2023, 48, 102629. [Crossref] 20. Camargo, L. E. A.; Pedroso, L. S.; Vendrame, S. C.; Mainardes, R. M.; Khalil, N. M.; Braz. J. Biol. 2016, 76, 428. [Crossref] 21. Herald, T. J.; Gadgil, P.; Tilley, M.; J. Sci. Food Agric. 2012, 92, 2326. [Crossref] 22. Adams, R. P.; Identification of Essential Oil Components by Gas Chromatography/Quadrupole Mass Spectroscopy; Allured Publishing Corporation: Carol Stream, IL, USA, 2009. 23. Brand-Williams, W.; Cuvelier, M. E.; Berset, C.; LWT--Food Sci. Technol. 1995, 28, 25. [Crossref] 24. Vellosa, J. C. R.; Barbosa, V. F.; Khalil, N. M.; Santos, V. A. F. F. M.; Furlan, M.; Brunetti, I. L.; Oliveira, O. M. M. F.; Rev. Bras. Cienc. Farm. 2007, 43, 447. [Crossref] 25. da Costa, M.; Ximenes, V. F.; da Fonseca, L. M.; Biol. Pharm. Bull. 2004, 27, 1183. [Crossref] 26. Cao, G.; Alessio, H. M.; Cutler, R. G.; Free Radicals Biol. Med. 1993, 14, 303. [Crossref] 27. Denev, P.; Kratchanova, M.; Ciz, M.; Lojek, A.; Vasicek, O.; Nedelcheva, P.; Blazheva, D.; Toshkova, R.; Gardeva, E.; Yossifova, L.; Hyrsl, P.; Vojtek, L.; Food Chem. 2014, 157, 37. [Crossref] 28. Cunha, F. A. B.; Pinho, A. I.; Santos, J. F. S.; Sobral-Souza, C. E.; Albuquerque, R. S.; Matias, E. F. F.; Leite, N. F.; Tintino, S. R.; Costa, J. G. M.; Boligon, A. A.; Waczuk, E. P.; Rocha, J. B. T.; Posser, T.; Coutinho, H. D. M.; Quintans-Júnior, L. J.; Franco, J. L.; Arabian J. Chem. 2019, 12, 4197. [Crossref] 29. Prieto, P.; Pineda, M.; Aguilar, M.; Anal. Biochem. 1999, 269, 337. [Crossref] 30. Apak, R.; Güçlü, K.; Özyürek, M.; Çelik, S. E.; Microchim. Acta 2008, 160, 413. [Crossref] 31. OriginLab 2023b Learning Edition, version 10.0.5.157; Origin Lab Corporation, Northampton, MA, USA, 2023. 32. Granato, D.; Nunes, D.; Análises Químicas, Propriedades Funcionais e Controle de Qualidade de Alimentos e Bebidas: Uma Abordagem Teórico-Prática, 1st ed.; Elsevier Brasil: Rio de Janeiro, 2017. 33. Monteiro, J. R. B.; Ardisson, J. S.; Athaydes, B. R.; Gonçalves, R. D. C. R.; Rodrigues, R. P.; Kuster, R. M.; Kitagawa, R. R.; Braz. Arch. Biol. Technol. 2019, 62, e19180285. [Crossref] 34. Weyerstahl, P.; Marschall-Weyerstahl, H.; Christiansen, C.; Oguntimein, B.; Adeoye, A.; Planta Med. 1988, 54, 546. [Crossref] 35. Ascari, J.; Pereira, M. F. M.; Schaffka, V. M.; Nunes, D. S.; Magalhães, C. G.; Santos, J. S.; Granato, D.; do Carmo, M. A. V.; Azevedo, L.; Archilha, M. V. L. R.; Scharf, D. R.; Molecules 2021, 26, 740. [Crossref] 36. Costa, D. P.; Santos, S. C.; Seraphin, J. C.; Ferri, P. H.; J. Braz. Chem. Soc. 2009, 20, 1287. [Crossref] 37. Victoria, F. N.; Lenardão, E. J.; Savegnago, L.; Perin, G.; Jacob, R. G.; Alves, D.; da Silva, W. P.; da Motta, A. S.; Nascente, P. S.; Food Chem. Toxicol. 2012, 50, 2668. [Crossref] 38. da Cunha, F. A. B.; Wallau, G. L.; Pinho, A. I.; Nunes, M. E. M.; Leite, N. F.; Tintino, S. R.; da Costa, G. M.; Athayde, M. L.; Boligon, A. A.; Coutinho, H. D. M.; Pereira, A. B.; Posser, T.; Franco, J. L.; Toxicol. Res. 2015, 4, 634. [Crossref] 39. Ramalho, R. R. F.; Barbosa, J. M. G.; Ferri, P. H.; Santos, S. C.; Food Res. Int. 2019, 119, 850. [Crossref] 40. da Costa, J. S.; Barroso, A. S.; Mourão, R. H. V.; da Silva, J. K. R.; Maia, J. G. S.; Figueiredo, P. L. B.; Biomolecules 2020, 10, 328. [Crossref] 41. Xu, F.; Liu, Y.; Song, R.; Dong, H.; Zhang, Z.; Nat. Prod. Commun. 2010, 5, 789. [Crossref] 42. Barros, L.; Dueñas, M.; Ferreira, I. C. F. R.; Carvalho, A. M.; Santos-Buelga, C.; Food Chem. 2011, 127, 169. [Crossref] 43. Song, X.-C.; Canellas, E.; Dreolin, N.; Nerin, C.; Goshawk, J.; J. Agric. Food Chem. 2021, 69, 10856. [Crossref] 44. Lin, L.-Z.; Harnly, J. M.; J. Agric. Food Chem. 2007, 55, 1084. [Crossref] 45. Acquavia, M. A.; Pascale, R.; Pappalardo, I.; Santarsiero, A.; Martelli, G.; Bianco, G.; Separations 2021, 8, 90. [Crossref] 46. Luo, C.; Wang, X.; Gao, G.; Wang, L.; Li, Y.; Sun, C.; Food Chem. 2013, 141, 2697. [Crossref] 47. Engström, M. T.; Pälijärvi, M.; Salminen, J.-P.; J. Agric. Food Chem. 2015, 63, 4068. [Crossref] 48. de Souza, C. E. S.; da Silva, A. R. P.; Rocha, J. E.; Vega Gomez, M. C.; Rolóm, M.; Coronel, C.; da Costa, J. G. M.; Netto, M. L. C.; Rolim, L. A.; Coutinho, H. D. M.; Asian Pac. J. Trop. Biomed. 2017, 7, 836. [Crossref] 49. Sobeh, M.; El-Raey, M.; Rezq, S.; Abdelfattah, M. A. O.; Petruk, G.; Osman, S.; El-Shazly, A. M.; El-Beshbishy, H. A.; Mahmoud, M. F.; Wink, M.; J. Ethnopharmacol. 2019, 240, 111939. [Crossref] 50. de Oliveira, F. M. G.; Borlot, J. R. P. O.; Kitagawa, R. R.; Gonçalves, R. C. R.; Filpo, R. C. B. O.; Kuster, R. M.; Nat. Prod. Res. 2024, 38, 4297. [Crossref] 51. Perin, E. C.; Messias, R. S.; Galli, V.; Borowski, J. M.; de Souza, E. R.; de Avila, L. O.; Bamberg, A. L.; Rombaldi, C. V.; Food Sci. Technol. 2019, 39, 245. [Crossref] 52. Crizel, R. L.; Perin, E. C.; Siebeneichler, T. J.; Borowski, J. M.; Messias, R. S.; Rombaldi, C. V.; Galli, V.; Plant. Physiol. Biochem. 2020, 152, 211. [Crossref] 53. Kumar, S.; Pandey, A. K.; Sci. World J. 2013, 2013, 162750. [Crossref] 54. Prior, R. L.; Wu, X.; Schaich, K.; J. Agric. Food Chem. 2005, 53, 4290. [Crossref] 55. Heim, K. E.; Tagliaferro, A. R.; Bobilya, D. J.; J. Nutr. Biochem. 2002, 13, 572. [Crossref] 56. Benzie, I. F. F.; Szeto, Y. T.; J. Agric. Food Chem. 1999, 47, 633. [Crossref] 57. Bursal, E.; Köksal, E.; Food Res. Int. 2011, 44, 2217. [Crossref] 58. Choi, M.; Yoon, J.; Yang, S. H.; Kim, J. K.; Park, S. U.; Plants 2023, 12, 3840. [Crossref] 59. Malesev, D.; Kuntic, V.; J. Serb. Chem. Soc. 2007, 72, 921. [Crossref] 60. Vlachodimitropoulou, E.; Sharp, P. A.; Naftalin, R. J.; Free Radicals Biol. Med. 2011, 50, 934. [Crossref] 61. Gharacheh, R. H.; Eslami, M.; Amani, P.; Novir, S. B.; Phys. Chem. Res. 2019, 7, 561. [Crossref] 62. Song, Y.; Chen, C.; Wang, F.; Zhang, Y.; Pan, Z.; Zhang, R.; Int. J. Food Prop. 2022, 25, 1576. [Crossref]
Guest Editor handled this article: Antonio E. M. Crotti |

On-line version ISSN 1678-7064 Printed version ISSN 0100-4042
Química Nova
Publicações da Sociedade Brasileira de Química
Caixa Postal: 26037
05513-970 São Paulo - SP
Tel/Fax: +55.11.3032.2299/+55.11.3814.3602
Free access